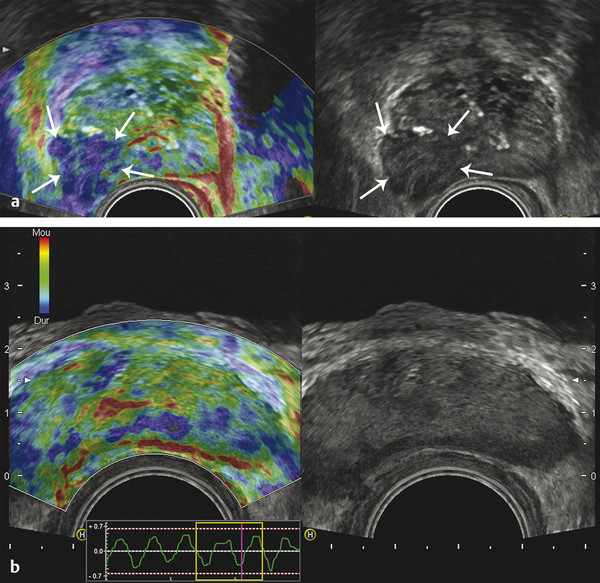
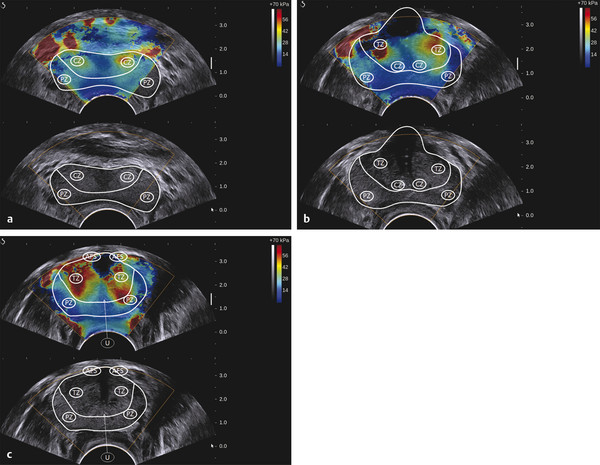
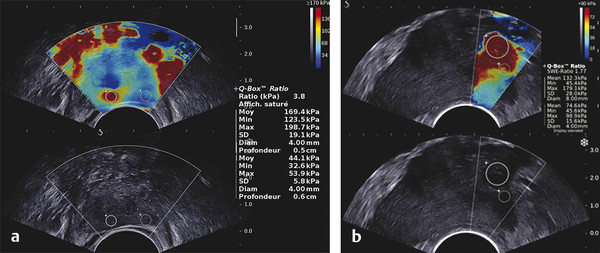
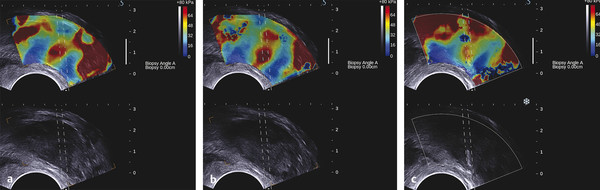
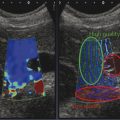
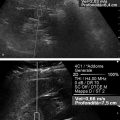
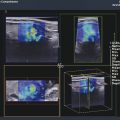
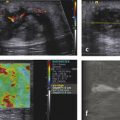
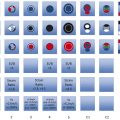
Prostate Cancer Screening PCa systematic screening has been challenged again following the publication of the recent recommendations by the French National Authority for Health (HAS).2 The aim of systematic screening is to detect a clinically significant cancer in healthy men, hopefully a curable lesion at an early stage, thereby improving the prognosis of the disease. Its benefits must be greater than its drawbacks, which include complications related to treatment (urinary incontinence, impotence, radiation cystitis or proctitis), to diagnostic methods (hematuria, rectal hemorrhage, urinary retention, postbiopsy prostatitis, complications due to MRI and administration of contrast agents, PSA false positives), to the psychological impact of this diagnosis, and finally to false positives of MRI examinations. The limits of screening stem from the lack of an effective and simple test to pinpoint men with a risk of cancer high enough to justify continuing the diagnostic procedure with more aggressive tests. Screening may concern either an entire population based on age (systematic screening) or a target population considered to be at high risk. Screening is considered to be organized, when it concerns an entire population actively recruited, or individual, when the population is recruited when treatment is sought. In France, just as in the United States or the United Kingdom, there is no systematic screening, because of the lack of proof that the specific death rate can be reduced.4 We cannot, however, rule out the role played by extending individual screening through combining PSA level screening to DRE in light of the recent fall in specific death rate. However, individual screening for PCa may be offered to men over 50 without a predisposition, after disclosing the benefits and risks to the patient. For high-risk patients (first degree family history, African American patients), screening may even start earlier, at age 40. Individual screening for PCa is based on DRE and PSA levels. However, increase of PSA levels is not specific to PCa and can be related to prostatic hyperplasia, acute and chronic prostatitis, or prostate trauma (caused by cystoscopy, resection, or biopsies). Moreover, there are significant PCas with PSA levels lower than the threshold of 4 ng/ml. PCa may be suspected if the PSA level is abnormal or increasing, or if the DRE is abnormal. Further tests are then carried out, which in most cases mean a transrectal ultrasound-guided biopsy. Prostate biopsy also allows estimating the tumor volume (number and spatial dispersion of the positive cores, length of the tumor in each positive sample) and its aggressiveness (Gleason score [GS] and invasion of the capsule or the neurovascular bundles). However, this approach has several limitations. PSA screening leads to a substantial number of unnecessary biopsies in patients with no cancer or with indolent cancer that does not need immediate treatment, with an estimated over-detection rate ranging from 27 to 56%.5 The false negative rate of prostate biopsy varies from 17 to 21% in patients with a negative first series of biopsies.4,6 Many urologists are now facing a dilemma when patients present with an abnormal level of PSA and negative biopsies: when should one stop and when should one continue carrying out biopsies?7 Finally, although PSA levels and biopsy results are correlated with the clinical stage, tumor volume, and histological tumor grade, the information provided is limited for predicting the tumor mass and its aggressiveness in each patient.5 The increase in the number of core biopsies (saturation biopsies up to 40) improves PCa detection and offers a better estimation of the tumor volume and GS,8,9 but it has many limitations including increased cost and morbidity, and over-diagnosis and overtreatment of microscopic tumor foci;10,11 saturation biopsies cannot really rule out PCa.8,9 MRI recently provided interesting results in terms of detecting and locating tumors.12 Multiparametric MRI (mp-MRI), combining T2-weighted imaging and functional sequences, has become a major modality for tumor detection and staging,12 particularly in candidates for radical prostatectomy (RP), with areas under the receiver operating characteristic (ROC) curve over 0.9.13,14,15 Other interesting results have been published on patient series having a first negative biopsy and an elevated PSA level.16 One clinical study has reported that mp-MRI could improve the positive biopsy rate in patients with a visible MRI anterior lesion.17 However, MRI performance varies depending on which combination of positive features is selected for cancer diagnosis between T2-weighted sequence, diffusion sequence (including apparent diffusion coefficient [ADC] calculation), dynamic contrast-enhanced sequence, and sometimes spectro-MRI. If the sensitivity of mp-MRI is high, its specificity remains low especially because it is affected by the increased vascularity of the normal inner gland and coexisting benign prostatic hyperplasic nodules. Also while its sensitivity is high for large (> 1 cm3) and high GS PCa (≥6),18 its remains low for the detection of small lesions of limited GS (< 6) and there is little information to help distinguish between aggressive and indolent tumors.19 Computer-aided diagnosis systems may help in standardizing the interpretation of images and in defining thresholds for distinguishing aggressive tumors.20 Different scoring systems combining the different sequences exist today: the subjective 5-point Likert score,13 the Prostate Imaging—Reporting and Data System (PI-RADS), and the morphology-location-signal (MLS) intensity. In a recent study comparing these different scoring systems,21 the Likert scoring system exhibited significantly higher diagnostic performance for the characterization of prostate lesions than the other two systems. This study also reported a poor to moderate interobserver agreement for categorization of prostate lesions visible at mp-MRI as benign or malignant for all scoring systems. Conventional transrectal ultrasound (TRUS) B-mode imaging has also been studied to assess its performance for PCa diagnosis. However, its sensitivity and specificity were very limited ranging between 40 to 50% for PCa detection, and were not significantly improved by the use of color or power Doppler.22,23 Contrast-enhanced ultrasound is still under evaluation and has proven to sensitize prostate biopsy;24 however, it requires an intravenous injection. Prostate harboring PCas are usually stiffer than “normal” prostate, and this feature plays a major role during DRE.25 However, DRE is not suitable for PCa diagnosis as its findings are subjective, its interobserver variability is very important,26 and it is not an accurate method for staging disease and locating the different foci accurately,27 which are two factors mandatory for planning primary therapy. An imaging technique able to map tissue elasticity could therefore be useful in detecting and locating cancer areas within the prostate. Up until recently, conventional imaging techniques did not provide any information about in vivo elastic properties of organs. However, the elasticity (or equivalently, the stiffness) of tissues in the body changes as diseases progress over several months and/or decades depending on the speed of the disease progression. PCa tissue becomes stiffer than the surrounding healthy prostate tissue due to several changes. There is an increase in cellular density and in microvascularization, destroying the glandular architecture28 and triggering wound repair. This process is characterized by the stromal reaction28,29 and the deposition of collagen in the stroma surrounding the cancer.30 This deposition of collagen also significantly increases with an increasing Gleason score31,32 and is linked to a significant reduction in the acinar area in the PCa stroma. All these changes contribute to the increased stiffness of tissue affected by PCa.33 Several studies focused on ex vivo samples mainly due to the engineering challenges of deploying mechanical devices to measure stiffness in vivo. The results of the different mechanical studies performed ex vivo on prostate tissue samples are summarized in ▶ Table 7.1.33,34,35,36,37,38 In the late 1990s Krouskop et al34 started a mechanical assessment of prostate tissue. A significant difference between normal and cancerous prostate tissue stiffness was demonstrated.35,37,38 Moreover, the increase in tissue stiffness was correlated to the aggressiveness of the disease as evaluated with the Gleason score (GS)37 and the disease severity.38 This fact is an important finding, as elasticity could help differentiate clinically significant cancer from insignificant disease. Benign prostatic hyperplasia (BPH) nodules can often induce false positive diagnosis when using DRE and/or TRUS imaging, revealing the presence of prostate nodules at B-mode imaging. Young’s moduli for BPH nodules versus those for cancerous tissues nodules reported in two of these studies are significantly different.33,38 Study Year Study design # Specimens Tissue stiffness range (kPa) Normal BPH PCa Krouskop et al34 1998 1 from patient with RP – 55–71 36–41 96–241 Phipps et al33 2005 83 samples from 22 patients with RP 11 BPH – 100 118 Zhang et al36 2008 17 samples from 8 RP peripheral zones 8 normal 15.9 ± 5.9 – 40.4 ± 15.7 Hoyt et al35 2008 17 samples from 8 RP specimens 8 normal 3.8–25 – 7.8–40.6 Ahn et al37 2010 46 RP specimens – 17.0 ± 9 – 24.1 ± 14.5 Carson et al38 2011 23 RP specimens, 6 autopsy specimens – 41.1 36.8 30.9–71.0 Abbreviations: BPH, benign prostatic hyperplasia; PCa, prostate cancer; RP, radical prostectomy; #, number of. Despite the limitations of ex vivo studies, these encouraging results, together with the wide use of TRUS for guiding systematic biopsy, prompted the development of an ultrasound-based elasticity imaging for the prostate gland. Several ultrasound-based methods were developed in the recent years to measure in vivo prostate tissue elasticities and provide an elasticity map. They improve both prostate lesion characterization and PCa detection; in particular, this approach can be extremely useful for prostate lesions, disclosing lesions on the elasticity map which are not visible in conventional TRUS imaging (isoechogenic lesions) or other imaging modalities such as MRI. In fact, it is of importance to understand that isoechogenic lesions can be detected with prostate elastography, as the displayed information does not rely on backscattered signals. Elastography may therefore have two major indications: to provide additional information for the characterization of prostate lesions and to improve the detection of PCas. Two concepts are currently used for ultrasound elastography: the analysis of the strain or deformation of a tissue created by a mechanical force (static/quasistatic elastography or strain elastography [SE]) and the analysis of the propagation speed of a shear wave (shear wave elastography [SWE]) which is linked to tissue elasticity. In prostate strain elastography, an external stress is applied on the patient’s rectal wall adjacent to the prostate peripheral zone by using the endocavity transducer as a compression device. There are technical issues that arise with the prostate application of strain elastrography. The first issue is related to obtaining homogeneity of the tissue deformation due to the use of a microconvex endfire transducer. The compression–release cycles should be applied without changing the imaging plane in order to avoid slippage artifacts. This might be difficult with the length of the transducer and its microconvex shape. A water-filled balloon placed between the imaging probe and the rectal wall can be used to improve the homogeneity of the deformation.39 The second issue is related to the position of the FOV. Indeed, the stiffness color scale is automatically distributed from the lowest to the highest strain found in the image plane. The display depends upon the range of stiffness found in the stiffness region of interest (ROI). This is why the size and position of the stiffness box may induce artifactual variation of the displayed strain and the ROI should cover the entire gland and the surrounding tissues. The third issue is related to the lack of true quantitative information. The stiffness threshold cannot be defined, and only qualitative images are provided to the clinician. The value of semiquantitative information that can be derived by measuring the strain ratio between two regions of interest (usually one considered “normal” in terms of stiffness and one considered “abnormal”) is limited. The strain for each pixel is color-coded (or grayscale-coded) and displayed as overlay on the B-mode image. This technique became available on endocavity probes to allow prostate scanning several years ago. Prostate strain elastography is conducted after a complete B-mode and color Doppler examination conducted in the transverse and sagittal planes, in order to measure prostate volume, identify suspicious areas in the peripheral gland (mostly hypoechoic and sometimes hypervascular), and analyze the periprostatic space (including the seminal vesicles). Strain elastography mode is activated and each suspicious focal lesion is analyzed during slight compression–release cycles induced by the transrectal probe, while the patient is lying in a left lateral position. The entire gland can also be studied for detection of stiff areas typically in the transverse plane. The Quality Index (quality factor) allows controls to ensure appropriate speed and pressure of the compression–release cycle. Stiff tissues exhibit a reduced strain color-coded in blue, while soft tissues have an increased strain color-coded in red. The normal strain elastography pattern of the peripheral zone is of intermediate elasticity (▶ Fig. 7.1), while the inner gland (mostly the transition zone) shows more heterogeneity and exhibits an increasing stiffness with growing age and volume40(▶ Fig. 7.1b). Hypoechoic lesions coded in blue are highly suspicious to be malignant (▶ Fig. 7.2). Fig. 7.1 Typical distribution of elasticity pattern using strain elastography in a 60-year-old patient with moderate benign prostatic hyperplasia (BPH). (a) Prostate base, transverse view, left lateral rotation of the transducer. The peripheral zone (PZ) is coded with green and red colors due to soft to intermediate tissue stiffness. Some blue colors are seen at the edges of the gland corresponding to nondeformation artifacts. At the most upper and anterior part of the gland, it is difficult to separate the central zone (CZ) from the anterior fibromuscular stroma. The pericapsular elastic border is coded in red (soft) and can be seen anteriorly. (b) Prostate mid-gland, transverse view, left lateral rotation of the transducer. The peripheral zone (PZ) appears larger with the same elasticity pattern. The transition zone (TZ) exhibits a more heterogeneous pattern due to BPH development with some blue colors due to stiffer areas. The pericapsular elastic border is coded in red (soft) and can be seen laterally. (c) Prostate apex, transverse view, slight right lateral rotation of the transducer. The peripheral zone (PZ) is mainly coded in green due to intermediate elasticity. The pericapsular elastic border is coded in red (soft) and can be seen anteriorly. Note the heterogeneous pattern of the urethra with peripheral ring-shaped lines. AFS, anterior fibromuscular stroma; U, urethra. Fig. 7.2 Prostate cancer pattern at strain elastography. (a) Typical hypoechogenic nodule developed in the posterior peripheral zone, with typical stiff pattern color-coded in blue (arrows); note that the cancer is certainly invading the capsule. (b) Diffuse prostate cancer invading the entire gland corresponding to a Gleason score 7 lesion. This diagnosis is difficult and was initially missed by the magnetic resonance imaging (MRI) study. However, the strain elastogram revealed the presence of abnormal stiff areas coded in blue distributed all over the peripheral and transition zones. This pattern was very stable with the compression–release cycles. Prostate strain elastography is facing some challenges, such as the lack of uniform compression over the entire gland, the operator dependency, and the requirement of significant training in order to improve reproducibility and limit artifacts. One of the greatest limiting factors is the difficulty in mastering the technique required to obtain appropriate and reproducible strain elastograms. The interobserver agreement in detecting cancer can show a moderate agreement between readers, as demonstrated by low kappa values.41 Even in experienced hands, up to 32% strain elastographic acquisitions can be judged to be unevaluable due to technical problems, such as slippage of the compression plane.41,42 The mismatch between the pre- and postcompression planes results in wrong estimation of the tissue elasticity, but this artifact is reduced with training and balloon interposition. Benign prostatic hyperplasia is responsible for most of the false positive elastography evaluation.41 Stiff areas can also result from inflammatory prostate disease and can be detected in up to 40% of the patients in whom cancer was not detected.43 Compression of the prostate from the rectum may prevent transmission of sufficient deformation through the entire prostate, more specifically the anterior region of the prostate. It should be noted that the compression applied to the posterior regions and the subsequent deformation is necessarily different from that at the anterior region (due to depth); the same mechanism applies with the base and the apex due to the different angulation of the endfire transducer. This may affect the strain elastography dectection rates (DRs), that were reported to be lower in the anterior region of the prostate than in the posterior region, and also lower in the prostatic base compared with the apical region, as shown by several studies.39,44,45,46 Unlike strain elastography (SE), shear wave elastography, or SWE, requires no compression on the rectal wall to produce elastograms. This technique is based on the measurement of shear wave velocity propagating through the tissues.47 It belongs to the field of multiwave imaging as it combines two different waves: one (shear wave) that provides stiffness information and another (ultrasonic wave) that captures the propagation of the shear wave. Thanks to the combination of these two waves, shear wave elastography provides a dynamic quantitative map of soft tissues’ viscoelastic properties in quasireal-time. It is important to know that the prostate can be easily displaced by perineal muscle contractions and/or by the endocavity transducer introduction and displacements. Despite the low frame rate, the quasireal-time acquisition is truly helpful in scanning the prostate. Mean elasticities are averaged from a region of interest (ROI) and can be displayed in kilopascals (kPa) or in meters per second (m/s) (if shear wave speeds are displayed). The shear wave speed (in m/s) or the Young’s modulus (in kPa) is color-coded for each pixel and displayed as an overlay on the B-mode image. Stiff tissues are color-coded in red, while soft tissues appear in blue. The elasticity values (mean, standard deviation, minimum, and maximum) are then calculated for each ROI (▶ Fig. 7.4a). The ratio between the mean values of two ROIs placed in a suspicious region and in the adjacent normal peripheral zone can be calculated (▶ Fig. 7.4a). This technology became available on endfire endocavity transducers only recently, explaining the limited number of published papers. Prostate SWE is also conducted after a complete evaluation of the prostate using B-mode and color Doppler imaging in a patient lying in a left lateral position. SWE mode is activated and each suspicious focal lesion is analyzed avoiding any pressure on the transducer. Optimized settings should include maximized penetration and appropriate elasticity scale (70 to 90 kPa). The entire gland can also be scanned for detection of stiff areas in the transverse plane. The SWE box is enlarged to the maximum in order to cover half of the gland on a transverse plane. Thus, each side of the prostate is scanned separately and stored from base to apex in 2 separate cine loops. For each plane, the transducer is maintained in a steady position for 3 to 4 seconds until stabilization of the signals occurs. Hypoechoic lesions coded in red are highly suspicious to be malignant. The digital cine loop can be reviewed and the ROI can be positioned on suspicious areas detected either at the B-mode scan or during the SWE detection scan, even during the review process. The elasticity values (mean, standard deviation, minimum, and maximum) are then calculated for each ROI. In young patients without prostatic disorder, the peripheral and central zones are coded in blue with a very homogeneous pattern (with stiffness values ranging from 15 to 25 kPa), while the transition zone exhibits stiffness below 30 kPa (▶ Fig. 7.3). With the development of benign prostatic hyperplasia, the peripheral zone remains soft with a very homogeneous color encoding in blue (soft tissue), while the transition zone becomes hard (red color) with a heterogeneous color pattern; elasticity values range from 30 to 180 kPa48 (▶ Fig. 7.3). Fig. 7.3 Typical distribution of elasticity pattern using shear wave elastography in a 35-year-old patient with minimal benign prostatic hyperplasia (BPH), from base to apex. (a) Prostate base, transverse view. The peripheral zone (PZ) is homogeneously soft and, thus, is coded with blue colors. The mean stiffness values are typically below 30 kPa. The central zone (CZ) remains rather homogeneous due to minimal development of BPH and appears slightly stiffer with mean values ranging from 20 to 30 kPa. Note that the space between the rectal wall and the posterior peripheral zone is coded in blue reflecting the minimal pressure induced by the endocavity transducer. (b) Prostate mid-gland, transverse view. The peripheral zone appears larger and remains homogeneous with typical soft pattern and mean stiffness values below 30 kPa. The central zone is still visible posteriorly and is rather homogeneous due to minimal development of BPH, appearing slightly stiffer with mean values ranging from 20 to 35 kPa. The transition zone (TZ) appears more heterogeneous due to BPH development. (c) Prostate apex, transverse view. The peripheral zone exhibits the same homogeneous soft pattern with mean stiffness values below 30 kPa. The transition zone appears heterogeneous due to BPH development and some anterior nodules are displayed at SWE with mean stiffness values of 30 to 55 kPa. Due to limited anterior penetration of SWE, the anterior fibromuscular stroma is not color-coded. AFS, anterior fibromuscular stroma; U, urethra. SWE reproducibility has been studied in a single paper and showed an excellent overall intraobserver reproducibility (intraclass correlation [ICC] = 0.876), with minimal impact of ROI location, prostate volume, and clinical variables (ICC = 0.826–0.917).49 The real-time capability of SWE allows one to sweep through the whole gland and to perform detection of stiff foci that are not always displayed in the B-mode image (▶ Fig. 7.4, ▶ Fig. 7.5). PCas usually appear as stiffer areas than the surrounding tissue (▶ Fig. 7.5). Targeted biopsy can be performed under SWE guidance to increase the detection rate of cancer. Despite the slow frame rate, the real-time capability of SWE is helpful in optimizing the needle tract, and targeting the stiffest area of the nodule that sometimes does not strictly correlate with the B-mode findings (▶ Fig. 7.6). Fig. 7.4 Shear wave elastography (SWE) typical pattern of prostate cancer. (a)The posterior peripheral zone at the apex appeared slightly hypoechogenic. SWE reveals a very stiff nodular area; the mean stiffness of the lesion is 169 kPa while the contralateral peripheral zone stiffness is at 44 kPa; the stiffness ratio is 3.8. SWE allows quantitative measurements of tissue stiffness using ROI. For prostate SWE, the typical scale of displayed elasticity values is set to 50 to 70 kPa. Note that the posterior periprostatic space is color-coded in blue demonstrating the minimal pressure of the endocavity transducer. Prostate biopsy confirmed the presence of a Gleason score 8 adenocarcinoma. (b) The diagnosis of anterior prostate cancer is more difficult. In this patient, the anterior peripheral zone was slightly hypoechogenic. SWE reveals a very stiff nodular area; the mean stiffness of the lesion is 169 kPa while the contralateral peripheral zone stiffness is at 132 kPa; the adjacent posterior peripheral zone is color-coded in light blue, corresponding to stiffness values below 35 kPa. Prostate biopsy confirmed the presence of a Gleason score 7 adenocarcinoma. Fig. 7.5 The additional value of shear wave elastography (SWE) for prostate cancer diagnosis and biopsy. (a,b) Prostate B-mode and directional power Doppler TRUS did not detect any lesion in the peripheral zone; a single hypervascular nodule was seen in the transition zone sitting next to the posterior surgical capsule and exhibited some strong hypervascularity (white arrows) in the transverse plane (a) and the sagittal plane (b). (c) During the detection scan from base to apex, SWE revealed a very stiff nodular area (red pattern) in the peripheral zone at mid-gland level. The area was previously seen at B-mode imaging as a pseudo-cystic hypoechogenic area and was not initially considered as a potential target. (d) SWE-targeted biopsy inside this lesion confirmed the presence of a Gleason score 6 adenocarcinoma. All other cores were negative. Fig. 7.6 Shear wave elastography (SWE)–targeted biopsies. (a) This prostate lesion was poorly seen at B-mode imaging but easily detected at SWE. The dotted lines indicate the needle tract. This angulation is suboptimal, as the tract is not targeting the stiffest area of the lesion. (b)After bending the transducer, the route was optimized and the tract was covering most of the stiffest part of the lesion. (c) The needle tract was passing exactly in the lesion. SWE-targeted biopsy is of interest particularly when the lesion cannot be seen at B-mode imaging.
7.3 Prostate Cancer Diagnosis
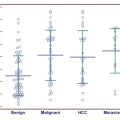
7.4 Why Measure Prostate Tissue Elasticity for Prostate Cancer Diagnosis?
11 PCa
9 PCa
9 PCa
7.5 Prostate Elastography Techniques
7.5.1 Strain Elastography
Acquisition and Interpretation

Limitations
7.5.2 Shear Wave Elastography
Acquisition and Interpretation

Related posts:
Stay updated, free articles. Join our Telegram channel

Full access? Get Clinical Tree


