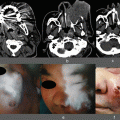
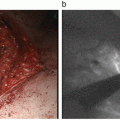
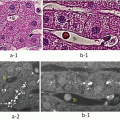
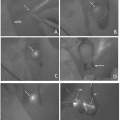
Fig. 19.1
Intraoperative ICG contrast enhancement of the greater curvature gastric tube. (a) Schematic diagram of the small-diameter gastric tube. (b) Arterial phase. Rapid contrast enhancement of a part of the left gastroepiploic artery and short gastric artery is seen. (c) Mural contrast phase. Extensive contrast enhancement of the gastric tube wall and greater omentum is seen. There is no contrast in the distal portion of the gastric tube. (d) Venous phase. Contrast has reached the left gastroepiploic vein
If we do not use the stomach for reconstruction, we use pedunculated jejunum or pedunculated ileocolic bowel and perform antethoracic reconstruction. In this case, we use the ICG-fluorescence video navigation system to evaluate perfusion of the elevated intestine, and, thereafter, we perform microscopic vascular anastomosis of the internal thoracic vessels and the relevant neck vessels, as required.
19.4 ICG-Based Assessment of Perfusion of the Small-Diameter Gastric Tube
Five to ten seconds after intravenous administration of ICG, Tcontrast is produced, first in the gastroepiploic artery arcade and then in the root of the right gastroepiploic artery (arterial phase: Fig. 19.1b). Several seconds after administration of the ICG, the small-diameter gastric tube wall is contrast enhanced (mural contrast phase: Fig. 19.1c), and, at approximately 10 s after administration of the ICG, venous outflow of the agent is observed (venous phase: Fig. 19.1d).
19.4.1 Assessment of Gastric Tube Perfusion: Results in 48 Patients
We reviewed the results of gastric tube perfusion assessment obtained by means of the LED-excitation ICG-fluorescence video navigation system in 48 patients for whom a small-diameter gastric tube was created when thoracoscopic esophagectomy is performed. The surgeries were performed at our hospital, starting in 2010. Good contrast enhancement of the right gastroepiploic artery and the small-diameter gastric tube wall in the same region was achieved in 47 of the 48 patients. In 38 of the 48 patients, blood flow from the right gastroepiploic artery root rapidly reached the left gastroepiploic artery. In the remaining ten patients, there was a delay of ≥3 s or poor contrast enhancement.
Rapid contrast enhancement was seen in the region of the short gastric artery in six patients, but poor contrast enhancement accounted for more than half of the patients.
A ≥ grade 3 (Clavien-Dindo classification) anastomotic leakage developed in 7 of the 48 patients (14.5 %). A significant difference occurred in the development of anastomotic leakages between patients in whom contrast enhancement of the left gastroepiploic artery was delayed or insufficient and those in whom this contrast enhancement was rapid, with anastomotic leakages being more common in the former group (p = 0.027, OR = 7.8) (Table 19.1).
Table 19.1
Quality of blood flow in the left gastroepiploic artery and corresponding anastomotic patency status
Blood flow in the left gastroepiploic artery
Stay updated, free articles. Join our Telegram channel
Full access? Get Clinical Tree
 Get Clinical Tree app for offline access

| ||
|---|---|---|


