Examination Technique


Examination Technique


This chapter describes specific aspects of examining the chest organs with the different imaging modalities. It is outside the scope of this textbook to give a comprehensive overview of the technical aspects of the equipment or the positioning techniques. These details can be consulted in the pertinent literature.1,2


1.1 Projection Radiography

The following descriptions relate to digital radiography (flat panel detector or image plate). By now this is available in most radiology institutions. This chapter does not take account of older, conventional screen-film radiography systems but many aspects are very similar to that of digital radiography.

For almost all chest diseases, chest radiography constitutes the first step in diagnostic imaging. The few exceptions to that rule (e.g., suspected pulmonary embolism) will be pointed out in the relevant sections.


1.1.1 Standing Position

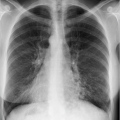
Patients are X-rayed in a standing position, whenever their condition permits. The standing patient is X-rayed in the PA (posteroanterior) beam path with the chest placed against the detector (PA image), while the focus detector distance is 1.4 to 2 m. ▶Table 1.1 summarizes the technical radiographic parameters. To avoid overlapping of the pulmonary fields, the scapulae must be rotated laterally. To that effect, the patient places his/her hands on the hips while rotating the elbows anteriorly as far as possible. Alternatively, the patient clasps the detector with their arms; this, too, assures anterior rotation of the scapulae.

If because of the patient’s general condition an X-ray cannot be taken in a standing position, this can be done with the patient sitting down. The patient leans his/her back against the detector; the beam path is therefore oriented in an AP direction (anteroposterior; AP image). As a result, the diaphragm will be positioned at a higher level than seen in a standing radiograph, the inspiration depth is reduced, and, accordingly, the basal lung segments are less well ventilated.

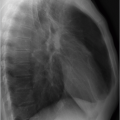
Likewise, a lateral radiograph is obtained with the patient standing and the arms raised. Normally, the patient’s left side rests against the detector. In general, a clearer image will be obtained of the lung closer to the detector compared with that farther away from the detector. If the clinical diagnostic indication calls for maximum image quality and the critical details are difficult to identify, in certain cases to visualize a rightsided pathology it may be advisable to take an image with the right side placed against the detector.


Table 1.1 Radiographic parameters for PA and lateral radiographs5


Imaging parameters


PA projection


Lateral projection


Scanner type


Vertical stand with stationary or moving grid


Vertical stand with stationary or moving grid


Tube voltage


125 kV


125 kV


Focal spot value


≤1.3


≤1.3


Total filtration


≥3.0 mm Al equivalent


≥3.0 mm Al equivalent


Focus detector distance


180 cm (140-200 cm)


180 cm (140-200 cm)


Automatic exposure control


Right lateral chamber selected


Central chamber selected


Exposure time


<20 ms


<20 ms


Antiscatter grid


r = 10; 40/cm


r = 10; 40/cm


Nominal speed class


SC 400


SC 400


Entrance surface dose for standard- sized patient


0.3 mGy


1.5 mGy


All radiographs of the chest organs should be obtained in deep inspiration. The expiratory image usually used in the past to exclude pneumothorax is now obsolete for several reasons3,4:


  • The expiratory radiograph does not permit assessment of the cardiopulmonary status since the lung is inadequately ventilated and the pulmonary vessels appear dilated. This can obscure other relevant findings, e.g., small pulmonary infiltrates or incipient congestive heart failure.


  • Comparability with previous or subsequent radiographs is not possible.


  • With modern digital equipment technology, a pneumothorax of clinically relevant size can also be recognized on an inspiratory radiograph.

The European Guidelines on Quality Criteria for Diagnostic Radiographic Images issued by the European Commission define criteria to be met by radiographs.5Table 1.2 lists the criteria specified for the image quality of overview chest radiographs.


1.1.2 Supine Radiographs

For diagnostic imaging of bedridden patients, in particular in intensive care settings, supine radiographs are normally

obtained. The mobile detector is positioned beneath the thorax of the supine patient and the tube of the mobile radiography unit is placed above the patient. The focus detector distance should be 90 to 120 cm. For several reasons, supine radiographs have poorer image quality than standing or sitting radiographs:


Table 1.2 Quality requirements for chest radiographs5


Requirements


PA/AP thorax


Lateral thorax


Image criteria


  • Performed at full inspiration (as assessed by the position of the ribs above the diaphragm—either 6 anteriorly or 10 posteriorly) and with suspended respiration


  • Symmetrical reproduction of the thorax as shown by central position of the spinous process between the medial ends of the clavicles


  • Medial border of the scapulae should be projected outside the lung fields


  • Reproduction of the whole rib cage above the diaphragm


  • Visually sharp reproduction of the vascular pattern in the whole lung, particularly the peripheral vessels


  • Visually sharp reproduction of:


    – The trachea and proximal bronchi


    – The borders of the heart and aorta


    – The diaphragm and lateral costophrenic angles


  • Visualization of the retrocardiac lung and the mediastinum


  • Performed at full inspiration and with suspended respiration


  • Arms should be raised clear of the thorax


  • Superimposition of the posterior lung borders


  • Reproduction of the trachea


  • Reproduction of the costophrenic angles


  • Visually sharp reproduction of the posterior border of the heart, the aorta, mediastinum, diaphragm, sternum, and thoracic spine


Important image details


  • Small round details in the whole lung, including the retrocardiac areas:


    – High contrast: 0.7 mm diameter


    – Low contrast: 2 mm diameter


  • Linear and reticular details out to the lung periphery:


    – High contrast: 0.3 mm in width


    – Low contrast: 2 mm in width


  • Small round details in the whole lung:


    – High contrast: 0.7 mm diameter


    – Low contrast: 2 mm diameter


  • Linear and reticular details out to the lung periphery:


    – High contrast: 0.3 mm in width


    – Low contrast: 2 mm in width


Fig. 1.1 High-energy and low-energy chest radiographs. Different detectability of bone structures. Bronchopneumonia in the left upper lobe is much easier to detect on the high-energy radiograph (a, arrow). (a) High-energy radiograph with 125 kV tube voltage. (b) Low-energy radiograph with 70 kV tube voltage.


Fig. 1.2 Geometric distortion in standing and supine radiographs. Schematic diagram. (a) Standing PA radiograph with large focus detector distance: low magnification of cardiac opacity. (b) Supine AP radiograph with small focus detector distance: high magnification of cardiac opacity.


Fig. 1.3 Grid artifact because of decentered X-ray tube. Schematic diagram. (a) Normal image: symmetric radiolucency of both hemithoraces. (b) Grid artifact: the decentered tube causes right hemithorax opacity.


Fig. 1.4 Grid artifact. Radiograph (supine radiograph). Different radiolucency of both axillae (arrows) as distinguishing feature of that artifact.


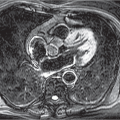
  • The reduced focus detector distance results in greater geometric distortion; the mediastinal width and heart size appear enlarged on the supine radiograph (▶Fig. 1.2); the heart is farther away from the detector, showing greater geometric enlargement.


  • The diaphragm is higher, resulting in reduced inspiration depth.


  • Lung perfusion has no gravity-mediated caudocranial gradient; it is not possible to diagnose pulmonary blood flow redistribution.


  • Since the tube voltage used is lower, bone superimposition is more pronounced.


  • The lower generator power of mobile radiography units results in a longer exposure time and is likely to cause motion blur due to breathing or heart pulsations.


The use of an antiscatter grid can enhance the image quality for obese patients, albeit at the expense of higher radiation exposure. A characteristic artifact is observed if the X-ray tube is not positioned above the middle of the detector fitted with an antiscatter grid (▶Fig. 1.3). To distinguish this artifact from pathologic hemithorax opacity, it may be useful to compare radiolucency of both axillae (▶Fig. 1.4). Unequal radiolucency is suggestive of a grid artifact.

Skin folds on the patient’s back result from placement of the X-ray detector between the bed and patient and can mimic pneumothorax (pseudo-pneumothorax).


1.2 Fluoroscopy

Chest fluoroscopy is mainly used for functional assessment of diaphragmatic movement. A standardized fluoroscopy examination procedure is described.6


Before commencing fluoroscopy examination, the patient practices deep breathing with the mouth open. In addition, the patient should repeat the sniff test around twice: the patient breathes deeply in and out with the mouth open, closes the mouth, and, again, with the mouth closed, breathes in deeply and strongly as fast as possible. The patient repeats this procedure once.

During examination, the patient stands against the vertically tilted fluoroscope. If the patient cannot be examined in a standing position because of their general condition, the patient sits on the footplate of the fluoroscope. The image section is centered vertically on the diaphragm and the image is collimated laterally as far as necessary. Next the patient breathes normally two to three times under fluoroscopic guidance, and then takes two to three forced breaths in and out. This is followed by conduct of the sniff test, also two to three times. The patient is then rotated by 90° and the examination sequence described is repeated in the lateral beam path.

The image documentation comprises the fluoroscopy video sequences of the PA and lateral fluoroscopy images which are digitally archived.


1.3 Computed Tomography

The enormous innovative boost experienced over the past two decades in computed tomography (CT) technology has greatly enhanced scanner performance. This, too, has led to increasing diversification of the technical features of CT equipment. Currently, scanners with a row count of between 1 and 640 are used for routine imaging. As such, standardization of examination protocols is virtually impossible. Various valuable internet sources of information provide vendor-specific CT examination protocols (e.g., www.ctisus.com). Below are listed some basic aspects to be considered in CT examination protocols:


  • Radiation exposure: Tube voltage, tube current, and pitch should be adjusted such that the radiation exposure complies with the reference values specified for diagnostic imaging of patients of normal weight. Relevant reference values vary greatly among different countries.7


  • Tube voltage: For most applications, a tube voltage of 110 to 120 kVp is suitable. For computed tomography angiography (CTA), the tube voltage may be reduced in certain circumstances to 80 to 100 kVp, in particular for pediatric or slim patients.8,9


  • Automatic tube current modulation: Due to the major differences in the absorption profiles of the thorax in the craniocaudal and axial directions, the use of automatic tube current modulation has greatly contributed to dose reduction.8 However, there is a risk of this automated facility preselecting a very high tube current for obese patients. It is therefore recommended to limit the maximum tube current in the scan parameters if this is technically possible. Other considerations apply for low-dose CT.


  • Slice thickness: The detector configuration should provide for a reconstructed slice thickness of 1 to 1.5 mm. But that does not apply to CT scanners with a limited row count, for which a compromise has to be made between the minimum slice thickness possible and the scan duration. A limiting factor for the slice thickness in such cases is the maximum length of breath suspension that can be maintained before breathing artifacts degrade the image quality. There does not appear to be much benefit in selecting a slice thickness of substantially less than 1 mm in the thoracic region because of the ensuing rise in image noise; a reduced slice thickness is unlikely to confer any additional diagnostic insights of relevance.


  • Image reconstructions recommended for routine examinations:


    • 5 mm axial for quick orientation also for the referring physician (soft-tissue and lung kernel).


    • Axial thin-slice reconstructions (1.5-3 mm) with soft-tissue kernel, in CTA possibly reduced slice thickness.


    • Axial thin-slice reconstructions (1-1.5 mm) with lung kernel to allow for volumetric measurements.


    • 3-5 mm coronal and sagittal.


  • Overlapping of thin-slice reconstructions: To achieve a good image quality for 3D (three-dimensional) reformatting of image data and precise volumetry, overlapping reconstruction of the thin-slice series by at least 20% of slice thickness is recommended.


  • IV contrast: If IV contrast administration is indicated, a fixed delay of 40 s may be used for most diagnostic purposes. Alternatively, a bolus tracking procedure could be employed. Here the arrival of the contrast bolus in the descending aorta triggers the scan. An additional delay of a few seconds is advisable, for example, to accentuate the contrast between a tumor and its surrounding tissues. The use of CTA for diagnostic exploration of pulmonary embolisms requires bolus tracking or a test bolus in the pulmonary trunk or right ventricle.


  • Scanning direction: Examination is performed in deep inspiration. A caudocranial scanning direction helps to reduce breathing artifacts. First, the basal lung regions most susceptible to breathing artifacts are scanned, followed by the less susceptible apical regions. Furthermore, with appropriate contrast medium timing, beam hardening artifacts caused by highly concentrated contrast material in the superior vena cava and brachiocephalic veins can be reduced.


1.3.1 High-Resolution Computed Tomography

The term “high-resolution computed tomography” (HRCT) dates back to the early 1980s.10 While that term has proved immutable over the past some 30 years, the underlying examination technology has undergone rapid development. Back then the body region to be scanned could only be visualized in sequential single slices, and acquisition of slices of 10-mm thickness represented the normal standard. Since each individual slice was acquisitioned in a separate breath-hold phase, imaging the entire lung took a lot of time.

Due to its low spatial resolution in the z-direction, the thickslice CT was of limited value for differential diagnosis of diffuse lung parenchymal diseases. This differential diagnosis requires the assignment of pathologic changes to the structures of the
pulmonary lobule, which is not possible with a 10-mm slice thickness. The key driver of HRCT was thus to generate thin slices of the lung parenchyma (slice thickness: around 1 mm) to improve such assignment. However, sequential 1-mm slices were not suitable for continuous imaging of the entire lung at that time. The only remedy here was therefore to acquisition discontiguous slices at greater distances apart (e.g., 10 mm). This inevitably results in incomplete visualization of the lung. For diagnosis of diffuse lung diseases, a number of representative slices suffice; however, thanks to the higher spatial resolution, it has been possible to achieve a diagnostic gain but there was a risk of focal changes being overlooked.

The term HRCT was thus normally understood as an examination technique which permits maximum spatial resolution11:


  • Reduced slice thickness (maximum 1.5 mm) at greater distances apart (e.g., 10 mm).


  • High radiation dose for the single slice (high tube voltage and high tube current).


  • Edge-enhancing reconstruction kernel for maximum spatial resolution in the slice plane.


  • Maximum image matrix (at least 512 × 512 pixels).

Since 1998, multidetector CT has been available providing for spiral imaging of the entire lung in 1-mm slices during a single-breath hold. This marked the advent of an alternative to the discontiguous thin single slices afforded by conventional HRCT. Its main advantage derives from the ability to display the entire lung in a slice thickness that hitherto had only been possible with HRCT. The problem of incomplete visualization of the lung parenchyma had now been resolved, albeit at the expense of higher radiation exposure and a minimally poorer image quality. Follow-up examinations became more precise since identical slice planes were always available for comparison of the previous and follow-up examinations. As such, in recent years thin-slice multidetector CT has just about fully supplanted the classic sequential HRCT.12 Nowadays, sequential HRCT plays a limited role for follow-up examination of diffuse lung diseases in young patients13 because of its lower radiation dose.


Fig. 1.5 Low-dose CT compared with standard CT. Higher image noise of low-dose CT, but good visualization of the pulmonary structures and of left posterior pleural plaque (arrows). (a) Standard CT with CTDIVol of 6.5 mGy. (b) Low-dose CT with CTDIVol of 1.5 mGy.


1.3.2 Low-Dose Computed Tomography

Many pathologic changes in the lung parenchyma contrast sharply with their surroundings. That means there is considerable potential for dose reduction in CT provided that the clinical issue of diagnostic interest is limited to detection or exclusion of high contrast objects. Typical examples of such clinical questions are early detection of lung cancer in the context of lung cancer screening, or detection of fungal pneumonia in immunocompromised patients. Both examinations are aimed at detection of foci of soft-tissue opacity in the aerated lung. Dose reduction causes considerably higher image noise (▶Fig. 1.5) but this does not adversely affect detection of relevant findings.14

At a technical level, dose reduction in low-dose CT is generally achieved by reducing the tube current. To further reduce the dose (ultralow-dose CT), a lower tube voltage (80-100 kVp) is sometimes used.15 The use of automatic exposure control is not generally recommended for low-dose CT.16 Scanogram-adapted methods of tube current modulation are thought to be errorprone due to eccentric patient positioning. Online modulation of the tube current may be overregulated in the region of the shoulders and upper abdomen because of higher radiation
absorption. Both present a risk of unnecessarily high radiation exposure or inadequate image quality when the tube current is too low. A more robust approach entails the use of a weightadapted, fixed tube current. Several lung cancer screening trials used a variety of low-dose CT protocols, which generally achieved an effective dose of approximately 1.5 mSv.16,17 These provide for a dose saving of over 80% compared with standard CT; with ultralow-dose protocols, radiation exposure similar to a chest radiograph in two views can even be achieved.15

There are limitations with regard to the detection of subtle ground-glass opacities and early forms of pulmonary emphysema since these findings induce only minor changes of CT density compared to their surroundings.18


1.3.3 Special CT Examination Techniques


Expiratory CT scan

Many diseases of the small airways are associated with obstruction of the bronchioles. Standard CT inspiratory images may yield normal results. Only on an expiratory scan can the disease be detected through pronounced air trapping (▶Fig. 1.6).

Two examination techniques are available:


  • Sequential expiratory scans: A few sequential expiratory scans, in addition to the inspiratory spiral scan, yield just slightly higher radiation exposure. Even severely dyspneic patients generally tolerate the very short breath-hold times for sequential expiratory scans. One drawback is the sampling error since only a small part of the lung parenchyma is displayed. Besides, interpretation of the findings with regard to air trapping may be difficult at times.


  • Expiratory volume acquisition: In addition to an inspiratory spiral CT scan, a second expiratory spiral scan is obtained across the entire thorax. Its advantage is that it displays the whole of the lung and focal air trapping is not overlooked. But this involves higher radiation exposure, although the expiratory scan can be obtained in low-dose technique. Besides, patients cannot hold their breath in expiration for as long as in inspiration. If a very fast CT scanner is not available, a compromise must be reached between slice thickness and scan duration since otherwise breathing artifacts would adversely affect image interpretation.


Fig. 1.6 Expiratory CT for visualization of small airway disease. (a) Hardly any abnormalities in inspiration. (b) In expiration greater evidence of air trapping (darker areas) in the diseased lung parenchyma.


Expiratory CT in addition to an inspiratory CT scan is also recommended for differential diagnosis of lung fibrosis—in particular, for differentiation between usual interstitial pneumonia and chronic hypersensitivity pneumonitis.19


Dynamic CT of the Ventilation Cycle

Dynamic CT of the ventilation cycle is indicated if there are difficulties in interpreting the expiratory scans or because of suspected dynamic respiratory tract stenosis which cannot be identified in inspiration.20,21

The easiest approach for this examination is to use the bolus tracking feature implemented in many CT scanners and to set
the threshold value to start the scan high enough so that it is never reached. To begin with, the patient takes a few normal breaths under bolus tracking, followed by a few forced breaths. Eventually, the bolus tracking mode must be stopped manually. An imaging frequency of one image per second suffices for interpretation of the findings.

For evaluation, lung parenchymal opacity is measured at the same site on all images using a region of interest of several centimeters, thus demonstrating how lung density changes in the course of the breathing cycles. These values can be displayed as graphs with the evaluation software present in many CT scanners (▶Fig. 1.7). The measurements are to be performed in both lungs.


Fig. 1.7 Dynamic CT of the ventilation cycle. Visualization of lung density during several breathing cycles. Illustrated in each case are measurements in the right (curve 1) and in the left lung (curve 2). (a) Normal results for the left lung (2). Density changes in one breathing cycle of more than 50 HU (Hounsfield units). On the right (1), mild air trapping with lower density amplitude. (b) Extensive air trapping. Only minor changes in lung parenchymal density; in the left lung (2) more massive air trapping than on the right (1).

Only gold members can continue reading. Log In or Register to continue

Stay updated, free articles. Join our Telegram channel

Apr 12, 2020 | Posted by in CARDIOVASCULAR IMAGING | Comments Off on Examination Technique

Full access? Get Clinical Tree

Get Clinical Tree app for offline access