Iodine-Based Contrast Media
These agents are mainly used for CT and for angiography. They contain one or two triiodinated benzene rings (monomeric or dimeric agents) and may have electrical charges in their structure or not (ionic or nonionic agents) (
Table 11.1). Ionic agents include one anion and one cation in each molecule.
1 These ions attract the negative and positive poles of the water molecules, and thus these agents are water soluble. Nonionic agents do not contain ions, but they are water soluble as well, thanks to their OH groups.
Therefore, we can classify iodine-based contrast media into four categories:
Ionic monomers
Ionic dimers
Nonionic monomers
Nonionic dimers
The monomers contain three atoms of iodine and the dimers contain six. Each molecule of ionic agents contains two particles in solution (one anion and one cation), while each molecule of the nonionic agent contains one particle in solution.
2 Therefore, the ratio between the number of iodine atoms and the number of particles in solution is as follows:
The ratio is closely related to the osmolality of the contrast materials because the osmolality of a solution is proportional to the sum of the concentrations of the different molecular or ionic particles contained in the solution. Indeed, the osmolality of ionic monomers is about five to seven times the osmolality of plasma (1,500 to 2,000 mOsm/kg) when considering iodine concentrations that are usually employed in CT or angiography. The osmolality of nonionic monomers and ionic dimers is two to three times the osmolality of the plasma, while nonionic dimers are isoosmolar to plasma at any concentration (
Table 11.2). Therefore, contrast media may be divided into high-osmolar agents (ionic monomers), low-osmolar agents (nonionic monomers and ionic dimers), and iso-osmolar agents (nonionic dimers).
2 It is interesting that nonionic monomers and ionic dimers are called lowosmolality agents even if their osmolality is still higher than the plasma osmolality.
The viscosity of the solution is another important parameter, although not as important as in the past, thanks to the use of modern injectors. Viscosity is affected by iodine concentration (the higher iodine concentration, the higher viscosity) and by the temperature (the higher temperature, the lower viscosity). Considering ionic monomers, their meglumine salts have a higher viscosity than sodium salts, but these agents generally have lower viscosities than nonionic monomers (
Table 11.2). Additionally, the dimers usually display a higher viscosity than the monomers. Therefore, warming nonionic contrast media to body temperature to lower viscosity before their administration is advisable, particularly when nonionic dimers are used.
Iodine-based contrast media are in most cases given by bolus injection. Their pharmacokinetics is similar to those of extracellular gadolinium-based contrast media, whereas they differ regarding the protein binders used for MRI.
1 They are described according to a two-compartment model, the two compartments being the intravascular plasma space and the interstitial space. The agents do not enter cells significantly in or outside of the circulation. On injection into the circulating blood, they are simultaneously diluted in the circulating plasma volume and immediately begin to pass out of the circulation into the interstitium. At some point, varying among tissues, an “equilibrium point” is reached at which falling plasma levels and rising interstitial concentrations are transiently equal. After this point, as the contrast agents are continuously removed from blood via renal filtration, there is a reversal of movement and the contrast agents begin to come out of the interstitium and back into the plasma. Iodine-based contrast agents are excreted almost solely by the normal kidney by passive glomerular filtration with no significant active tubular involvement.
Gadolinium-Based Contrast Media
MRI contrast agents can be classified according to
1
The metal ion
Whether the ion is paramagnetic or superparamagnetic
Naturally occurring ion in the body (yes or no)
Ionicity (ionic or nonionic)
Chelate (macrocyclic or linear)
The capability to hold the metal ion, in particular gadolinium (low, intermediate, or high stability)
Protein binding (yes or no)
Distribution in the body (extracellular or organ specific)
Today, the most used agents are based on a paramagnetic metal ion (gadolinium), which does not appear naturally in the human body. The agent may be either ionic or nonionic. High-stability agents based on a macrocyclic chelate are preferred more and more. In some countries, for example, Denmark, the low-stability agents are no longer used. The most used agents are extracellular with no protein binding.
Paramagnetic contrast agents (e.g., gadolinium, manganese) are mainly positive enhancers that reduce T1 and T2 relaxation times and increase signal intensity on T1-weighted MR images.
2 Gadolinium is a paramagnetic metal ion in the lanthanide series of the periodic table. It has a high magnetic moment and a relatively slow electronic relaxation time, and it is very toxic. Manganese has similar relaxivity properties to gadolinium but, unlike gadolinium, occurs naturally in the body. It is one of the least toxic metal ions and is excreted by the hepatobiliary system.
3 Agents containing manganese are no longer commercially available in Europe and the United States.
Superparamagnetic agents (e.g., iron) are extremely effective T2 relaxation agents, which produce signal loss on T2- and T2
★-weighted images. They also have a T1 effect, which is substantially less than their T2 effect.
4 However, superparamagnetic agents are no longer registered in most countries. Iron was used as the active ion in many agents. The iron agents were metabolized by the macrophages and the iron entered the body iron pool. Ferumoxytol is approved for intravenous treatment of patients with iron deficiency. Currently, it is studied whether it can be used for angiography and perfusion studies.
5 However, the MR use is off-label.
Gadolinium is a heavy metal, which in its free form is very toxic and may cause liver necrosis, hematologic changes, etc. A human being would not survive 0.1 mmol/kg free gadolinium injected into the circulation.
1 Therefore, the gadolinium ion is bound to a ligand in order to minimize its toxicity. For gadolinium-based contrast
agents, the choice of chelate structure influences the compound’s chemical and biologic stability and the colligative properties of its formulations, both of which in turn influence tolerance, pharmacokinetics, clinical uses, and contraindications. Two fundamental structural types are in use:
The fundamental difference between these structural types is that the chain of nitrogen and carbon atoms constituting the backbone of the chelating agent is open on both ends in linear agents and closed into a single loop in macrocycles. The macrocyclic chelate has much better grip on the toxic gadolinium than the linear chelate.
6 The ligands may be ionic, which have a charge in solution, or nonionic. In order to reduce the osmolality, the two carboxyl groups in the ionic linear chelate have been replaced by two amide bindings, which have a weaker binding grip on the gadolinium ion than the carboxyl groups.
Gadolinium-based contrast agents may be classified in two categories: (a) nonspecific extracellular gadolinium chelates and (b) high-relaxivity agents/organ-specific agents/protein-bound agents (protein binders).
1,
2 The nonspecific extracellular gadolinium chelates do not bind to proteins and are excreted by the kidney only, while the high-relaxivity agents show protein binding and are excreted to a varying extent through the bile as well as by the kidney. Nine gadolinium-based contrast agents are currently commercially available (
Table 11.3).
The osmolality of the gadolinium-based contrast agents varies between 600 and 2,000 mOsmol/kg (
Table 11.4). Unlike iodinebased contrast agents, high-osmolality gadolinium-based agents do not cause more acute nonrenal adverse reactions and discomfort than low-osmolality agents. This is probably because the molar amounts of gadolinium-based contrast agents used for the MR examinations are significantly less than the molar amounts of iodine-based agents used for radiography including CT.
The stability of gadolinium-based contrast agents depends on their kinetics, thermodynamics, and conditional stability (
Table 11.4). Although these parameters do not directly relate to molecular structure,
1,
6 the contrast agents with cyclic ligands, in which gadolinium is caged in a preorganized cavity, are more stable than those with linear ligands.
The relaxivity (r
1 and r
2) of the extracellular gadolinium-based agents is almost identical at both 1.5 and 3 T, since the change in field strength does not affect the relaxivity (
Table 11.4). Protein binding increases the r
1 relaxivity of gadolinium-based agents, particularly at 1.5 T, but the relaxivity decreases more the higher the protein binding is when one moves from 1 to 3 T (
Table 11.4).
The pharmacokinetics of extracellular nonspecific gadoliniumbased contrast agents are similar to those of iodine-based radiographic contrast agents (two-compartment model: the two compartments being the intravascular plasma space and the interstitial space).
1 They do not enter cells significantly in or outside of the circulation. After the extracellular gadolinium-based contrast medium has been injected into the circulating blood, it is diluted in the circulating plasma volume. Straightaway, it begins to enter the interstitium, leaving the circulation, and at some point, it will reach an “equilibrium point.” This point can vary from tissue to tissue. The “equilibrium point” is the point when the level of falling plasma and rising interstitial concentrations are the same. Hereafter, the extracellular contrast medium is continuously removed from the blood by means of excretion, and subsequently, the contrast medium begins to leave the interstitium and go back to the plasma, thereby revising its movement. The extracellular gadolinium-based contrast medium is excreted nearly by the normal kidney only by means of passive glomerular filtration without significant active tubular involvement.
High-relaxivity gadolinium-based contrast agents or protein binders behave similarly to the extracellular nonspecific agents immediately after intravascular injection.
7 However, because of their protein binding and biliary excretion, their pharmacokinetics differs and the liver uptake phase may be used for liver imaging. Of the available protein binders, gadobenate is used mainly as an extracellular agent, gadofosveset was specifically designed for MR angiography, and gadoxetate, which has the greatest biliary excretion, is mainly used for liver imaging. Protein binding, predominantly serum albumin binding, can produce (a) variable hepatobiliary versus renal excretion, (b) greater relaxivity where albumin is present, and (c) extended plasma half-life versus both excretion and leakage into extracellular space. All the currently available protein binders are based on the linear chelate (DTPA) and are ionic. Under similar conditions, gadobenate binds only slightly, approximately 5% to albumin; gadoxetate binds approximately 10%; and gadofosveset binds approximately 90%. These values are approximates for comparison and highly dependent on conditions of the measurement, including gadolinium concentration, which changes with time after injection, and also are complicated by binding of multiple gadolinium-based contrast agents to each albumin molecule. Gadobenate is excreted mostly into the urine at rate indistinguishable from the non-protein-binding agents, with only approximately 4% hepatobiliary excretion in man; in rats, it is much higher. The consequence of the added lipophilicity in gadoxetate is approximately 10% albumin binding along with very rapid hepatic uptake and then hepatobiliary excretion, approximately 50%, accompanied by relatively rapid renal excretion. In gadofosveset, the hepatobiliary excretion is 5%; due to the protein binding, its T1/2 is 18 hours or 12 times longer than that of the extracellular gadolinium-based contrast agents.


 Vascular Anatomy and Microanatomy
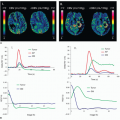 Dynamic Susceptibility Contrast MRI: Technical Considerations and Practical Issues
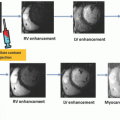 Myocardial Perfusion Imaging: MR Techniques
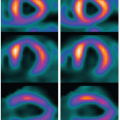 Myocardial Perfusion Imaging with PET/SPECT: Techniques and Clinical Applications
 Ultrasound Perfusion Imaging: Techniques and Analytical Methods
 Contrast-Enhanced Ultrasound: Clinical Applications


