Female Pelvis
Tristan Barrett
Andrew B. Gill
Evis Sala
The excellent spatial and soft tissue contrast resolution afforded by magnetic resonance makes it the key modality for the workup of pelvic lesions. It is standard practice to perform magnetic resonance imaging (MRI) for pretreatment staging of cervical and uterine tumors, and MRI also plays an important role in the workup of ovarian malignancy. Although MRI is used as a problem-solving modality for assessment of vulva and vaginal tumors, its use for these is not routine. Standard anatomical MRI is often useful in the diagnosis of benign gynecologic conditions. Multiphase contrast-enhanced MRI has become part of the standard protocol for imaging of the female pelvis and often provides additive benefit in the assessment of gynecological malignancy. Dynamic contrast-enhanced (DCE) MRI, generating quantitative or semiquantitative parameters, has shown promise for differentiating recurrent disease from posttherapy change, assessing early response to novel antitumor agents, and as a problem-solving tool. Nevertheless, the technique largely remains in the research environment, with results often reflecting single-institute studies performed with small sample sizes and intercenter standardization for the techniques presenting a challenge.
Ovarian carcinoma is a genetically heterogeneous disease and is the most frequent cause of mortality from gynecologic malignancy.1 In the Western world, endometrial cancer is the most common gynecologic malignancy. It is associated with obesity and excessive estrogen exposure (e.g., nulliparity, unopposed estrogen therapy), with approximately 75% of cases occurring in the postmenopausal population.2 Cervical cancer is associated with infection by human papillomavirus; although its incidence and mortality is declining in Western countries, it remains the second most common female cancer worldwide.2
Anatomy and Magnetic Resonance Imaging Appearances
The arterial supply to the female pelvis is an important consideration when selecting arterial input functions (AIF) for DCE-MRI. Four main arteries supply the pelvis: the paired internal iliac arteries (branches of the common iliacs), the paired ovarian arteries (arising from the aorta, below the level of the renal vessels), the medial sacral artery (from the aorta), and the superior rectal artery (branch of the inferior mesenteric artery). The ovaries are supplied by the left and right ovarian arteries. The uterus is supplied by the uterine arteries, via the internal iliac arteries, and the ovarian arteries. Cervical and vaginal branches of the uterine arteries supply the cervix and upper vagina.
The ovaries are paired endocrine organs found in the ovarian fossa, lateral to the uterine cornua, below the bifurcation of the common iliac vessels.3 The ovaries appear of homogeneous intermediate T1 signal intensity. Follicles can be distinguished on T2-weighted imaging (T2WI) due to their high signal, and they are easily differentiated from the surrounding stroma. The ovaries are connected to the uterus by the fallopian tubes.
The uterus is a pear-shaped organ, located ventral to the rectum and dorsal to the urinary bladder. The uterus is divided into three main segments: the fundus, the body, and the uterine cervix. The uterus has two main layers: the endometrium and the myometrium. on T2WI, the endometrium is of high signal intensity because of the mucin-rich glands and can measure up to 14 mm depending on the cyclical stage; in postmenopausal women the endometrium width should be less than 5 mm.4 The myometrium consists of the junctional (inner) zone, which contains compact smooth muscle and is of low T2 signal, and the outer myometrium, which is of higher T2 signal due to the increased intercellular matrix and vessels present. The zonal anatomy is often absent or poorly visualized in postmenopausal women. The internal os connects the uterine body to the cervix.
The cervix is connected to the vagina via the external os. The normal cervix appears of homogeneously intermediate signal intensity on T1WI. on T2WI, three distinct regions are identifiable: the inner cervical canal, which is of high signal due to mucus and the endocervical glands, the fibrous stroma layer, which appears of low T2 signal, and the outer muscular layer, isointense to myometrium of which it is considered to be a caudal continuation.5
Diagnostic Evaluation Strategies and Recommendations
Patient Preparation
In order to optimize pelvic imaging, several common approaches are used. Patients are asked to fast for approximately 4 hours beforehand, with the use of antispasmodic agents recommended in order to further reduce peristalsis-related artifact. Patients are additionally asked to empty their bladders immediately before the study and scanning is performed with patients in a supine position. Endovaginal contrast can be used to assess for vaginal
invasion from cervical or endometrial tumors; however, because this can be adequately assessed clinically, its use is not widespread. Endorectal or endovaginal coils are generally not recommended; although they offer an increased signal-to-noise ratio, they have the disadvantage of distorting the local anatomy and are invasive. Moreover, due to their high sensitivity, any motion of the coil will lead to considerable ghosting artifacts. Use of multichannel phased array coil (pelvic or cardiac) is standard to decrease scan time and improve image resolution of the anatomical sequences.6 These coils also allow for large field-of-view sequences to evaluate pelvic lymph nodes.
invasion from cervical or endometrial tumors; however, because this can be adequately assessed clinically, its use is not widespread. Endorectal or endovaginal coils are generally not recommended; although they offer an increased signal-to-noise ratio, they have the disadvantage of distorting the local anatomy and are invasive. Moreover, due to their high sensitivity, any motion of the coil will lead to considerable ghosting artifacts. Use of multichannel phased array coil (pelvic or cardiac) is standard to decrease scan time and improve image resolution of the anatomical sequences.6 These coils also allow for large field-of-view sequences to evaluate pelvic lymph nodes.
Protocols for Multiphase and Dynamic Contrast-Enhanced Magnetic Resonance Imaging
Three-dimensional spoiled steady state free precession gradient-echo T1-weighted images are acquired at different time points following injection of gadolinium (0.1 mmol/kg body weight) via a power injector immediately followed by saline flush. For multiphase MRI, three or four time points are selected, with the imaging plane determined by the tumor to be imaged (i.e., sagittal planes for endometrial and cervical tumors and axial planes for ovarian lesions), with a further delayed phase in a second plane (Table 61.1 and 61.2). For DCE-MRI, series are acquired at multiple consecutive time points. Individually selected AIFs are typically derived from the larger pelvic vessels: the external iliac or femoral arteries. Nevertheless, these vessels are still of relatively small calibre and prone to partial volume effects from pulsation, which may be confounded by inflow effects.2,7 It is possible to use model AIFs from population-averaged data in order to overcome these issues,1,8,9,10 however, this is somewhat counterproductive because these AIFs do not account for individual differences in cardiac output, bolus arrival, total blood volume, and so forth. Although its use is not universally recommended for DCE-MRI, parallel imaging is a potential means of achieving improved spatial coverage and temporal resolution to allow a larger field of view for DCE-MRI to assess for treatment response in more remote deposits.2
Multiphase MRI for pelvic imaging has generally been adopted as part of standard practice. The advantages over DCE MRI are the reduced time taken to acquire, the lack of postprocessing, and the relative ease of qualitative assessment. DCE MRI is generally only used in larger institutions and in certain problem-solving situations, vide infra.
Imaging the Ovaries
Anatomical Imaging
Ultrasound is the first-line imaging test for assessment of adnexal lesions, with MRI playing a secondary role in problem solving and further characterizing complex adnexal masses as being benign, borderline, or malignant and helping to provide prognostic information and inform treatment decisions.11 Standard anatomical MR sequences can confidently characterize benign lesions such as simple or hemorrhagic cysts, endometriomas, and mature cystic teratomas. Fat-saturated T1WI helps to distinguish between hemorrhage and fat within a lesion. Typically, endometriomas are hyperintense on T1WI due to the presence of methemoglobin, retaining this high signal on fat-saturated T1WI, and are of low to intermediate signal intensity on T2WI due to the presence of iron from blood degradation products. Mature cystic teratomas can be confidently diagnosed when fat is demonstrated within a cystic lesion,3 which appears as high signal intensity on T1WI and T2WI, with a drop in signal intensity following fat suppression (Fig. 61.1).
Morphologic features indicative of ovarian malignancy include size greater than 4 cm, presence of necrosis within a solid lesion, the presence of solid components or vegetations or papillary projections within a cystic lesion, and wall or septal thickening greater than 3 mm. Presence of at least one of these primary features and one ancillary finding of either involvement of pelvic organs,
ascites, peritoneal disease, or lymphadenopathy has been shown to correctly characterize malignancy in 95% of cases (Table 61.3).12 Transvaginal ultrasound and MR have similar sensitivity for the detection of solid components within cystic masses, but MR has improved accuracy due to its increased specificity.13
ascites, peritoneal disease, or lymphadenopathy has been shown to correctly characterize malignancy in 95% of cases (Table 61.3).12 Transvaginal ultrasound and MR have similar sensitivity for the detection of solid components within cystic masses, but MR has improved accuracy due to its increased specificity.13
 FIGURE 61.1. Mature cystic teratoma. Axial T2-weighted imaging (A), T1-weighted imaging (B), and short T1 inversion recovery images (C) show a multiloculated right adnexal mass with high T2 and high T1 signal intensity (arrows in A and B), which is confirmed to contain fat following signal dropout on the fat-suppressed imaging (arrow in C). |
TABLE 61.1 PROTOCOLS FOR OVARIAN MAGNETIC RESONANCE IMAGING | ||||||||||||||||||||||||||||||||||||||||||||||||||||||||||||||||||||||||||||||||||||||||||||||||||||||||||||||||||||||||||||||||||||||||||||||||||||||||||||||||||||||||||||||||||||||||||||||||||||||||||||||||
|---|---|---|---|---|---|---|---|---|---|---|---|---|---|---|---|---|---|---|---|---|---|---|---|---|---|---|---|---|---|---|---|---|---|---|---|---|---|---|---|---|---|---|---|---|---|---|---|---|---|---|---|---|---|---|---|---|---|---|---|---|---|---|---|---|---|---|---|---|---|---|---|---|---|---|---|---|---|---|---|---|---|---|---|---|---|---|---|---|---|---|---|---|---|---|---|---|---|---|---|---|---|---|---|---|---|---|---|---|---|---|---|---|---|---|---|---|---|---|---|---|---|---|---|---|---|---|---|---|---|---|---|---|---|---|---|---|---|---|---|---|---|---|---|---|---|---|---|---|---|---|---|---|---|---|---|---|---|---|---|---|---|---|---|---|---|---|---|---|---|---|---|---|---|---|---|---|---|---|---|---|---|---|---|---|---|---|---|---|---|---|---|---|---|---|---|---|---|---|---|---|---|---|---|---|---|---|---|---|
| ||||||||||||||||||||||||||||||||||||||||||||||||||||||||||||||||||||||||||||||||||||||||||||||||||||||||||||||||||||||||||||||||||||||||||||||||||||||||||||||||||||||||||||||||||||||||||||||||||||||||||||||||
TABLE 61.2 PROTOCOLS FOR ENDOMETRIAL MAGNETIC RESONANCE IMAGING | |||||||||||||||||||||||||||||||||||||||||||||||||||||||||||||||||||||||||||||||||||||||||||||||||||||||||||||||||||||||||||||||||||||||||||||||||||||||||||||||||||||||||||||||||||||||||||||||||||||||||||||||||
|---|---|---|---|---|---|---|---|---|---|---|---|---|---|---|---|---|---|---|---|---|---|---|---|---|---|---|---|---|---|---|---|---|---|---|---|---|---|---|---|---|---|---|---|---|---|---|---|---|---|---|---|---|---|---|---|---|---|---|---|---|---|---|---|---|---|---|---|---|---|---|---|---|---|---|---|---|---|---|---|---|---|---|---|---|---|---|---|---|---|---|---|---|---|---|---|---|---|---|---|---|---|---|---|---|---|---|---|---|---|---|---|---|---|---|---|---|---|---|---|---|---|---|---|---|---|---|---|---|---|---|---|---|---|---|---|---|---|---|---|---|---|---|---|---|---|---|---|---|---|---|---|---|---|---|---|---|---|---|---|---|---|---|---|---|---|---|---|---|---|---|---|---|---|---|---|---|---|---|---|---|---|---|---|---|---|---|---|---|---|---|---|---|---|---|---|---|---|---|---|---|---|---|---|---|---|---|---|---|---|
| |||||||||||||||||||||||||||||||||||||||||||||||||||||||||||||||||||||||||||||||||||||||||||||||||||||||||||||||||||||||||||||||||||||||||||||||||||||||||||||||||||||||||||||||||||||||||||||||||||||||||||||||||
TABLE 61.3 PRIMARY CRITERIA AND ANCILLARY FINDINGS FOR THE CHARACTERIZATION OF OVARIAN LESIONS AS MALIGNANTa | ||||||||||||
|---|---|---|---|---|---|---|---|---|---|---|---|---|
| ||||||||||||
Multiphase Contrast-Enhanced Magnetic Resonance Imaging
Accurately characterizing complex cystic adnexal masses as benign, borderline, or malignant can prove challenging and postcontrast imaging often adds value.13 Multiphase contrast-enhanced MRI can add additional information such as helping to differentiate solid components or papillary projections from clots and debris.14 Contrast-enhanced MRI also improves confidence for the detection of solid components in a cystic lesion (Fig. 61.2) and necrosis in a solid lesion by increasing conspicuity.13 In addition, early enhancement at multiphase MR has been shown to be a feature indicative of borderline malignant tumors and can help to differentiate them from benign ovarian tumors.12,15,16,17 Contrast-enhanced images improve detection of peritoneal implants, which appear as nodular or plaque-like soft tissue masses on the delayed (5-minute postgadolinium) series.18 Thus, contrast-enhanced MR can help improve planning of cytoreductive chemotherapy in advanced primary or relapsed ovarian carcinoma.
Dynamic Contrast-Enhanced Magnetic Resonance Imaging
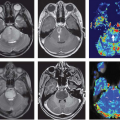
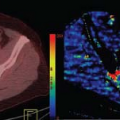
Ovarian cancer carries a generally poor prognosis, mainly due to the typically advanced stage at presentation, but also in part due to high rate of residual or recurrent disease.19 A mixed response frequently occurs at different abdominal sites of ovarian metastases. This can be explained, in part, by the variations in blood supply and consequent hypoxia, which limit delivery and efficacy of chemotherapy, or by a more desmoplastic response in high-grade serous tumors. DCE MRI can therefore be useful in the assessment of such vascular variations and in predicting treatment response. Indeed, DCE MRI has been shown to be predictive of future progression in asymptomatic patients with advanced ovarian cancer as early as 4 weeks following completion of chemotherapy (Fig. 61.3).20
 FIGURE 61.2. The added value of contrast-enhancement in ovarian cancer. (A and B) Axial fat-saturated T1-weighted image before (A) and after intravenous contrast (B) show an enhancing soft tissue component within the cystic lesion (arrow in B). (C and D) Axial fat-saturated T2-weighted image (C) and fat-saturated T1-weighted images after intravenous contrast (D) show enhancement of papillary projections within a cystic adnexal mass (arrow in D), a feature of malignancy. |
 FIGURE 61.3. Dynamic contrast-enhanced magnetic resonance imaging in ovarian cancer. Axial fat-saturated T1-weighted image (A and C) and Ktrans maps (B and D) obtained at baseline (A and C) and 6 weeks of treatment (B and D) with vandetanib, an oral antagonist of the vascular endothelial growth factor and epidermal growth factor receptors. Although there is relatively little change in lesion size (drawn regions of interest [ROI] and arrows in A and C), the Ktrans maps show reduced vascularity indicating successful antiangiogenic activity (ROI and arrows in B and D). VIF, vascular input function; ROI drawn around the left external iliac artery.
Related posts:Stay updated, free articles. Join our Telegram channel
Full access? Get Clinical Tree
 Get Clinical Tree app for offline access

|