Fluorodeoxyglucose PET Imaging of Dementia: Principles and Clinical Applications
Satoshi Minoshima
Takahiro Sasaki
Eric Petrie
In many countries, life spans have lengthened considerably in the past several decades. The incidence of dementia increases with age, and imaging to detect dementia is of increasing importance for both clinical and research applications (1). Although exact prevalence figures vary across studies, it is estimated that more than 10% of persons over the age of 70 may suffer from dementia, the most common type, in most populations, being Alzheimer’s disease (2).
Applications of positron emission tomography (PET) to imaging of dementia date back to the early stages of PET research developments in the late 1970s and early 1980s. In contrast to common clinical beliefs of the time that global reductions in cerebral perfusion and metabolic activity would be evident in dementia, early PET imaging demonstrated distinct patterns of regional heterogeneity in both hypoperfusion and hypometabolism (3). In 2004, more than 20 years after the initial application of PET imaging to dementia, and after considerable experience with fluorine-18-fluorodeoxyglucose (FDG) PET technology, the U.S. Center for Medicare and Medicaid Services announced their final decision to reimburse for FDG PET imaging for the differentiation of Alzheimer’s disease and frontotemporal dementia. This approval has ignited renewed clinical and industrial interests in PET imaging of dementia in parallel to continuing efforts to refine research applications of these imaging modalities.
Imaging in the Clinical Work-up of Dementing Disorders
Dementia is defined as the development of multiple cognitive deficits manifested by (a) memory impairment, and (b) at least one of the following cognitive disturbances—aphasia, apraxia, agnosia, and declines in executive functioning (4). It is important to recognize that memory loss alone does not define dementia. Also, other cognitive disturbances can be prominent clinical features in certain dementing disorders. Dementia patients often manifest associated features such as impaired visuospatial functioning; poor judgment and insight; personality changes; anxiety, mood, and sleep disturbances; delusions and hallucinations; fluctuations in attention; and parkinsonian motor signs. Some of these features can give clues as to the type of dementing disorder present. These diverse symptoms also imply that dementing disorders may alter neural activity in widespread brain regions, the effects of which are often reflected on PET imaging.
Dementia can be manifested in many medical disorders, some of which are common differential diagnoses in PET imaging practice. Table 9.2.1 describes examples of dementing disorders. In the category of neurodegenerative diseases, Alzheimer’s disease is the most common form, likely followed by dementia with Lewy bodies.
Vascular dementia includes both microvascular and macrovascular diseases, but classical multi-infarct dementia is now less commonly seen in imaging practice, in part due to improved control of risk factors for vascular diseases. Other medical conditions, such as metabolic disorders and infections, are typically diagnosed during a standard medical work-up but occasionally are part of the imaging differential diagnosis.
Vascular dementia includes both microvascular and macrovascular diseases, but classical multi-infarct dementia is now less commonly seen in imaging practice, in part due to improved control of risk factors for vascular diseases. Other medical conditions, such as metabolic disorders and infections, are typically diagnosed during a standard medical work-up but occasionally are part of the imaging differential diagnosis.
Table 9.2.1 Examples of Dementing Disorders | |
|---|---|
|
Clinical work-up of dementia patients involves medical, neurological, and laboratory examinations. Table 9.2.2 describes an example of the typical diagnostic work-up. The goals of the diagnostic work-up are to (a) confirm the presence of dementia; (b) identify the potential cause of dementia; and (c) establish a differential diagnosis for treatment decision making. It is important to note that the diagnosis of Alzheimer’s disease and other neurodegenerative diseases is made only after the exclusion of other detectable causes of dementia. Structural imaging (computed tomography [CT] and magnetic resonance imaging [MRI]) is suggested as a part of the work-up. However, the use of structural imaging is primarily to exclude other causes of dementia, such as brain tumor and vascular disease. In contrast, diagnostic applications of PET and single-photon emission computed tomography (SPECT) imaging are primarily designed to identify “positive” markers, such as characteristic changes in cerebral perfusion or glucose metabolism. Thus, the goal of PET and SPECT imaging in the dementia work-up is to identify diagnostic biomarkers of the underlying neurodegenerative disease processes, similar to other biomarkers such as cerebrospinal fluid levels of pathologic β amyloid (i.e., Aβ1–42) and tau protein (5).
Table 9.2.2 Clinical Work-up for Dementia | |
|---|---|
|
Brain PET and Single-photon Emission Computed Tomography Imaging for Dementia Diagnosis
In the current radiology/nuclear medicine practice, both PET and SPECT imaging can be applied to the diagnostic work-up of dementias. As described previously, the current Medicare reimbursement for FDG PET is limited to the differential diagnosis of suspected Alzheimer’s disease versus frontotemporal dementia. However, a large amount of research evidence suggests that FDG PET may also be capable of differentiating other dementing disorders. SPECT imaging can also be applied more generally in the dementia work-up, but the diagnostic accuracy of brain perfusion SPECT may not be as high as FDG PET imaging (6) presumably due to a combination of limited spatial resolution, sensitivity, and the nature of the perfusion tracers typically used in clinical SPECT imaging. For SPECT perfusion imaging, both technetium-99m (99mTc) ethyl cysteinate dimer (ECD) and 99mTc HMPAO (hexamethylpropyleneamine oxime) are available in the United States. In Japan, iodine-123 ([123I]) IMP (N-isopropyl- p-iodoamphetamine) is also available for routine clinical applications. These “perfusion” tracers accumulate in the brain proportional to regional blood flow. Since regional neuronal activity and blood flow are tightly coupled, decreased neuronal activity due to neurodegenerative processes can be detected indirectly by SPECT imaging of secondary changes in blood flow. In contrast, FDG PET directly detects changes in regional neuronal activity as reflected in rates of neuronal glucose metabolism (Table 9.2.3).
Table 9.2.3 Radiotracers: Brain PET and Single-photon Emission Computed Tomography for Clinical Dementia Work-up | ||
|---|---|---|
|
Brain PET Tracer: [18F]-2-fluoro-2-deoxy-D-glucose
The brain uses glucose as a major energy source but does not have substantial glucose storage capacity. Therefore, it requires a continuous supply of glucose from plasma to maintain its functions. If neurons in a certain part of the brain are not functioning normally, the change can be sensitively reflected by the amount of glucose utilization. If a glucose analogue is labeled with a positron emitting radionuclide and injected intravenously, areas of hypofunctioning neurons can be depicted as areas of decreased tracer uptake.
Sokoloff et al. (7) originally developed the glucose analogue, 2-deoxyglucose, for the study of regional brain function. Deoxyglucose is transported from plasma to brain cells through the neuronal membrane glucose transporter. Deoxyglucose is then phosphorylated by hexokinase to form deoxyglucose-6-phosphate (deoxy-G6P). However, deoxy-G6P cannot be further metabolized by enzymes in the glycolytic pathway and therefore accumulates within neurons. When deoxyglucose is labeled with a positron emitter such as [18F] (8), PET imaging can detect this activity from outside the brain in three dimensions.
Despite more than a decade of research and clinical use of FDG in brain imaging, the exact microscopic locus of glucose consumption in neurons is still a matter of investigation. Sokoloff et al. demonstrated, in dorsal root ganglion neurons, that glucose consumption at synapses increased in proportion to neuronal activity, while glucose consumption in cell bodies was stable. To the degree that this model applies to the central nervous system, FDG uptake observed by PET imaging would be expected to preferentially reflect synaptic activity, possibly coupled with surrounding astrocyte uptake (9). This would be consistent with the sensitivity of FDG PET imaging in detecting regional reductions in cortical glucose uptake and metabolism in the early stages of Alzheimer’s disease (10,11), as dysfunction and loss of synapses have been shown to be very early pathological processes in this disorder (12,13). This also implies that the degeneration of cortical projection neurons known to occur in Alzheimer’s disease could result in spatial discordance between structural imaging measures of neuron loss and cortical atrophy and FDG PET imaging measures of synaptic loss and cortical hypometabolism. This illustrates the importance of understanding major pathways of neuronal connectivity in the brain for correctly interpreting the interrelationship between regional hypometabolism and atrophy (an example of the more general phenomenon of diaschisis, which is more commonly encountered in the interpretation of imaging findings in stroke).
PET versus PET/CT
Combined PET/CT technology is replacing dedicated PET scanners in many clinical operations. Significant advantages of PET/CT for oncologic work-up are outlined elsewhere in this book. Although dedicated PET scanners can provide sufficient information for dementia work-up, the use of PET/CT has certain additional advantages. The use of CT for attenuation correction will reduce overall scanning time. This is a clear benefit for imaging elderly and demented patients who may have difficulty remaining still during prolonged scans. Simultaneous noncontrast CT also allows screening for gross anatomic abnormalities, such as tumors or subdural hematomas, which could potentially cause dementia. PET/CT scanners that use newer generation PET components can also provide better image quality that may potentially contribute to better diagnostic accuracy. Because head motion between CT and PET scans can be substantial in dementia patients, even with reduced scanning times, application of quality control measures prior to image reconstruction is critical.
Brain Fluorodeoxyglucose PET Imaging Protocols
A protocol for brain FDG PET imaging shares many procedural steps with oncologic FDG PET imaging. However, there are specific precautions that need to be taken for brain imaging. As an FDG PET scan is capable of detecting very subtle metabolic changes associated with dementing disorders, alterations in brain activity produced by environmental stimuli during the tracer uptake phase following intravenous injection of FDG can introduce artifactual metabolic alterations on brain PET images. The most noticeable changes occur in the primary sensory cortices. For example, if patients are exposed to light or visual stimulation, metabolic activity in the visual cortex increases. If auditory stimulation is given during the uptake phase, metabolic activity in the primary auditory cortex increases. This is similar to the muscle uptake occasionally seen in whole-body PET imaging when patients contract their muscles after FDG injection. To reduce metabolic variations due to external stimuli, a patient should be kept in a dimly lit room with low ambient noise levels both before and after FDG injection. An intravenous injection line should be established at least 10 minutes before FDG injection, so that brain activation due to intravenous line placement can subside prior to imaging. The patient should be instructed not to speak, read, listen to music, or watch television in the injection room. At many institutions, and recommended in several protocols, FDG injection is typically performed with the patient’s eyes open. It is important to minimize interaction with the patient during at least the first 20 minutes after FDG injection, during the period of maximal brain tracer uptake. With respect to tracer dosing, 300 to 600 MBq (typically 370 MBq) and 125 to 250 MBq (typically 150 MBq) of FDG are recommended for two-dimensional and three-dimensional image acquisition protocols, respectively (14).
The patient should fast for at least 4 to 6 hours prior to FDG PET imaging. It is desirable if the patient can avoid caffeine, alcohol, and other substances or drugs that may affect brain chemistry and function. If plasma glucose levels are more than 160 to 200 mg/dL, many institutions recommend rescheduling the study, since a high plasma glucose level will degrade image quality as a result of competitive inhibition of neuronal FDG uptake by high levels of endogenous, unlabeled, plasma glucose.
Image acquisition can be started after allowing at least 20 minutes of tracer uptake following the intravenous injection of FDG. A brain FDG PET emission scan is typically acquired in three-dimensional data acquisition mode for 5 to 20 minutes. As mentioned previously, a shorter scanning time is desirable for elderly and dementia patients. Images can be reconstructed by either filtered back-projection or iterative image reconstruction methods.
Fluorodeoxyglucose PET Image Interpretation
Many neurodegenerative diseases are known to affect certain parts of the brain both pathologically and metabolically. The differential diagnosis of dementia on FDG PET relies on identification of these characteristic patterns of altered cerebral metabolic activity.
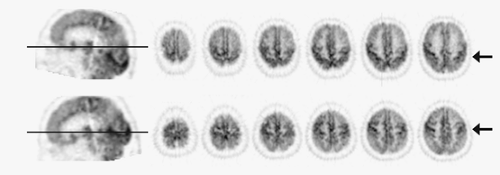
Owing to widespread availability of high-speed computer workstations, interpretation of FDG PET images is typically performed on a computer monitor using image display software. In this setting, image features such as the color scale and the intensity/contrast can be changed interactively by the interpreter. This helps the interpreter identify subtle metabolic changes and confirm the consistency of findings across different display modes (Fig. 9.2.1). Image interpretation based solely on printed films is not a desirable method of image interpretation. Also, it is often helpful to view all images in a multislice display, instead of scrolling through single slices, to better understand the overall distribution of hypometabolism in the brain. In addition to transverse images, reformatted sagittal and coronal images provide better structural definition in certain structures, such as temporal lobe, subcortical structures, and midline structures. Coronal images are also useful for comparison of metabolic asymmetry when the head position is tilted. To achieve consistent structural identification, it is desirable to reslice reconstructed images parallel to the line passing through anterior and posterior commissures (AC-PC line). The AC-PC line defines the standard stereotactic coordinate system for human brains (15) and allows consistent localization of cortical and subcortical structures. Since the anterior and posterior commissures cannot be appreciated on brain PET images, the AC-PC line can be approximated by a line passing through anterior and posterior poles of the brain (Fig. 9.2.2).
Structures that provide diagnostic clues for dementing disorders include frontal, parietal, temporal, and occipital association cortices; posterior and anterior cingulate cortices; primary sensorimotor and visual cortices; thalamus; striatum; pons; and cerebellum. These structures need to be identified on PET images to allow identification of regional metabolic alterations (Table 9.2.4). Modern PET and PET/CT scanners have sufficient spatial resolution to depict cortical gyri and subcortical structures (Fig. 9.2.3). However, the resolution is typically not sufficient to resolve individual gyri facing each other at a sulcus. As a result, in a normal brain, FDG uptake often appears accentuated at the sulcus. In contrast, if there is atrophy present and a sulcus is widened, the two gyri facing the sulcus can be seen separately.
In normal subjects, brain FDG uptake is greatest in the primary visual cortex, especially if the eyes are open during the uptake period. Other primary cortices, such as sensorimotor and primary auditory cortex, also show relatively high uptake. The posterior cingulate cortex often shows very high uptake as well, almost equivalent to that of the primary visual cortex (11). Within the association cortices, the frontal lobe should have general FDG uptake comparable to or greater than that of parietal or temporal association cortices (hyperfrontality). This hyperfrontality can be lost in many conditions. In the aging brain, FDG uptake in the frontal lobe, in particular the medial frontal cortex, tends to decrease more than other parts of the brain (16). This decrease is often associated with
a widened interhemispheric fissure in the medial frontal lobe that can be appreciated on PET images. Decreases in glucose metabolism may also extend to the lateral frontal cortex and anterior perisylvian regions in advanced age populations (Fig. 9.2.4).
a widened interhemispheric fissure in the medial frontal lobe that can be appreciated on PET images. Decreases in glucose metabolism may also extend to the lateral frontal cortex and anterior perisylvian regions in advanced age populations (Fig. 9.2.4).
Table 9.2.4 Structures Identification on PET Images for Dementia Diagnosis | |
|---|---|
|
Quantification, Pixel Normalization, and Statistical Mapping of Fluorodeoxyglucose PET Images
Using FDG PET imaging data, absolute regional glucose metabolic rates can be quantified by mathematical tracer kinetic modeling. The tracer kinetic modeling typically requires a plasma input function of tracer concentration, which can be measured by arterial sampling, arterialized venous sampling (warming of the arm to increase arterial-venous shunting), or image-based region of interest analysis of arterial activity on dynamic PET images. Early PET investigations with absolute glucose metabolic quantification demonstrated global metabolic reductions in Alzheimer’s disease as well as other types of dementias in addition to focally and differentially accentuated hypometabolism (17,18). Due to the requirement for arterial input function measurement, absolute quantification of glucose metabolism by FDG PET is not practical in many clinical settings. Clinical interpretation of FDG PET imaging for dementia is therefore typically based on the relative distribution of FDG uptake in the brain. (In this chapter, the terms FDG uptake and glucose metabolism are used interchangeably for convenience.)
Despite administration of a similar dose of FDG, the level of FDG uptake in the brain can vary significantly and is influenced by several factors, including endogenous plasma glucose levels and the distribution of FDG within the body. The standard uptake value, which is often used for semiquantitative analysis in oncologic image interpretation, is not commonly used for brain PET image interpretation due to limited quantitative accuracy. Instead, pixel values of FDG PET images can be normalized to FDG uptake in a reference region that is known not to be, or at least is expected not to be, significantly affected by the disease processes under study (i.e., brain pixel values/averaged pixel values within the reference region). Traditionally, the thalamus and the cerebellum have been used for this purpose in Alzheimer’s disease. Minoshima et al. (19) previously compared normalized FDG uptake by different reference regions, including thalamus, cerebellum, primary sensorimotor cortex, whole brain, and pons, in comparison to absolute glucose metabolic rates measured using an arterial input function in the same Alzheimer’s disease subjects and found that pixel normalization using the pons produced the most accurate and precise estimates of absolute glucose metabolism. It is important to note that normalization
by averaged whole-brain activity, as is often used in brain mapping analyses, can underestimate the degree and extent of hypometabolism in dementias as these disorders often affect relatively large areas of the brain and the averaged whole-brain activity is therefore affected by the disease processes. Also, particularly when global normalization is used, artifactual relatively increased regional FDG uptake may be observed. A caution should be exercised not to interpret this finding as increased regional glucose metabolism, as it often represents regionally less severe hypometabolism.
by averaged whole-brain activity, as is often used in brain mapping analyses, can underestimate the degree and extent of hypometabolism in dementias as these disorders often affect relatively large areas of the brain and the averaged whole-brain activity is therefore affected by the disease processes. Also, particularly when global normalization is used, artifactual relatively increased regional FDG uptake may be observed. A caution should be exercised not to interpret this finding as increased regional glucose metabolism, as it often represents regionally less severe hypometabolism.
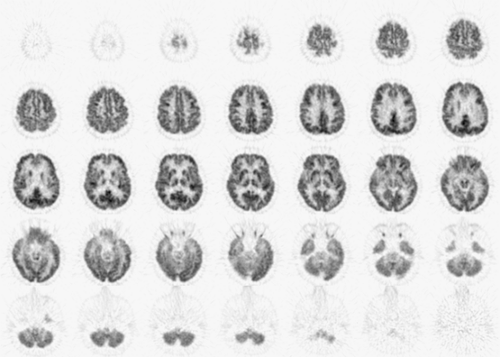 Figure 9.2.3. Normal fluorodeoxyglucose PET images. Cortical and subcortical structures are clearly depicted by the current generation of a PET scanner. |
Owing to significant advancements in PET brain activation studies and mapping technology developed in late 1980s and early 1990s (20,21,22,23,24), modern interpretations of brain PET images are often performed statistically in the standard stereotactic coordinate system (15). In these analyses, brain PET images are resliced to match with the standard coordinate system, and individual differences in regional brain shape are minimized by computer algorithms that perform nonlinear warping. Once brain image data sets are standardized, image sets from different subjects can be compared on a pixel-by-pixel basis for various statistical assessments. To objectively and quantitatively estimate regional metabolic changes in dementias, we developed a brain mapping method in which individual brain PET data sets can be compared to a normative data set (often called a normal database) that is created from scans of multiple normal control subjects (25). For each pixel, a Z score, defined as [(individual pixel value minus normal control mean)/normal control standard deviation], can be calculated and displayed for image interpretation (Fig. 9.2.5). In this analysis, areas of hypometabolism can be detected as higher Z scores. This significantly improves the diagnostic accuracy of Alzheimer’s disease using brain PET images (26). The concept of this image analysis is similar to that used in cardiac image interpretation (bull’s eye). Statistical brain mapping analyses of FDG PET and perfusion SPECT are now used extensively for research investigations of dementia (16,27,28,29,30,31,32), and similar brain mapping software is now commercially available for routine clinical applications.
Radiotracers Other than Fluorodeoxyglucose for Dementia PET and Single-photon Emission Computed Tomography Imaging
Numerous radiotracers have been developed and used for PET and SPECT investigations of dementing disorders. These include tracers for assessment of (a) oxygen metabolism ([15O]-O2); (b) blood flow ([15O]-water, 123I-IMP, 99mTc-HMPAO, 99mTc-ECD); (c) cholinergic system (carbon-11 [11C]-scopolamine, [11C]-TRB, [11C]-NMPB, [123I]-IBVM, [123I]-QNB, [11C]-PMP, [11C]-BMP); (d) dopaminergic system ([18F]-dopa, [11C]-nomifensine, [11C]-raclopride, [11C]-DTBZ, [123I]-IBZP, [123I]-IBF, [123I]-IBZM; (d) serotonergic system ([18F]-setoperone); (e) central and peripheral benzodiazepine receptors ([11C]-FMZ, [123I]-IMZ, [11C]-PK11195); and (f) amyloid ([11C]-PIB, [18F]-FDDNP, [11C]-SB-13) (abbreviations found in MEDLINE). Significant efforts have been directed toward imaging of the cholinergic system in Alzheimer’s disease (33,34,35,36,37,38,39,40,41,42) owing to the cholinergic hypothesis (43) and the widespread availability of cholinergic treatments for Alzheimer’s disease. Beyond traditional perfusion, metabolic, and neurotransmitter receptor imaging, recent PET investigations have also been directed at characterizing immune activity in Alzheimer’s brain using [11C]-PK11195 and amyloid deposition using tracers such as [11C]-PIB, [18F]-FDDNP, and [11C]-SB-13. Some of these tracers are described elsewhere in this book.
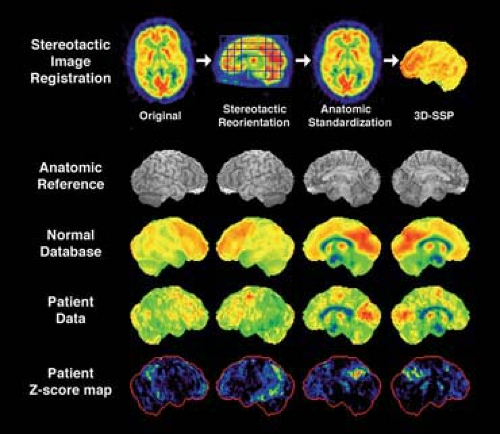 Figure 9.2.5. Statistical mapping of brain PET images for image interpretation. Original images are first standardized in the stereotactic coordinate system (stereotactic reorientation parallel to the anterior and posterior line and anatomic standardization to minimize individual anatomic variances), and gray matter activity is extracted into three dimensions (3D-stereotatic surface projections [3D-SSP]) (25). Data from multiple normal subjects constitute normal database (mean and standard deviation for each pixel). When patient data in question are processed in the same way, each pixel value of the patient data is compared to the mean value of the normal database relative to the standard deviation and generates a Z score to indicate the degree of deviation from the normal mean. This forms Z-score maps indicating areas of decreased FDG uptake in the patient in comparison to the normal database. Z-score maps significantly improve diagnostic accuracy of brain FDG PET for dementia (26).
Stay updated, free articles. Join our Telegram channel
Full access? Get Clinical Tree
 Get Clinical Tree app for offline access

|

