Fluoroscopy
Fluoroscopy systems provide real-time or near real-time x-ray imaging of patients. Fluoroscopy systems provide the temporal resolution necessary for the operator to use image guidance for the placement of medical devices (e.g., catheters, stents, etc.) or to observe temporal physiological phenomena. Common uses for fluoroscopy include upper and lower gastrointestinal studies, where the radiologist may manipulate barium or air contrast around the GI tract, in order to observe bowel obstruction, anatomical abnormalities, or polyps. The fluoroscopy imaging system is also a crucial tool in the placement of catheters and devices for vascular imaging and interventions, such as for abdominal, cerebral, or cardiac procedures. Other uses of fluoroscopy include percutaneous needle biopsy, swallowing studies, hardware placement and positioning during surgery, etc.
There are two basic modes of operation for fluoroscopic systems: (1) fluoroscopy, which provides real-time imaging for positioning, which is generally not recorded and is relatively low in radiation dose, and (2) fluorography, which essentially uses the fluoroscopic imaging chain in a pulsed radiographic mode to record and document clinically relevant temporal sequences such as blood flow through vessels (angiography), mechanical motion of joints, etc., with higher levels of radiation consistent with radiography.
Image intensifiers were the central technology enabling low-dose fluoroscopy since the early 1960s. These earlier fluoroscopy systems used continuous x-ray sources with 30 frames per second (FPS) acquisition rates, analog TV cameras for fluoroscopic viewing, and film-based devices for recording. Modern fluoroscopic systems make use of pixelated flat-panel detectors (FPDs) with large, multiple fields of view (FOVs), numerous modes of operation, a pulsed x-ray beam to reduce vascular motion, flexible frame rates, and numerous image processing techniques such as digital subtraction angiography (DSA) and road-mapping, and some systems even have cone beam CT acquisition capabilities.
The radiation dose rate for fluoroscopy has been reduced substantially with improvements in x-ray tube technology, replacing minimally filtered (Al) high tube potential (90 kV) imaging of the past with highly filtered (Cu), low x-ray tube potential (e.g., 60 kV) imaging. With these improvements in the x-ray spectra used in fluoroscopy, not only have the dose rates been reduced considerably, but image quality has improved as well. More complicated fluoroscopic suites include numerous methods for radiation safety of the staff, including ceiling-hung clear x-ray shields for protecting the upper body of the operator, along with numerous other devices deployed for reducing the scattered radiation received by staff.
The modern fluoroscopy system embraces both fluoroscopy viewing and fluorography recording and many imaging protocols designed for specific imaging applications. All modern systems embrace sophisticated computer interfaces, large ceiling-hung display monitors, and tableside controls enabling dozens of operational modes. All these features challenge the physician operator to become familiar with the increasing complexity of these systems and learn the most appropriate protocol
for optimizing the acquisition of patient information while reducing radiation dose levels to both the patient and staff.
for optimizing the acquisition of patient information while reducing radiation dose levels to both the patient and staff.
Fluoroscopic systems are flexible general-purpose devices that are configurable to meet the requirements of a wide range of clinical procedures. Most fluoroscopes have hundreds of preprogrammed imaging protocols intended to optimize many more procedures than might be obvious from the system’s “type.” Image acquisition and display controls include x-ray generator settings including automatic exposure rate control (AERC), image-receptor FOV, image processing methods, and image display adjustments. Clinically appropriate combinations are combined into “Examination Protocol Selection Buttons” (EPSB). Operators should understand these controls as well as the other aspects of the imaging system as they are a central node in the fluoroscope’s control loops (Fig. 9-1).
 ▪ FIGURE 9-1 Block diagram of an interventional fluoroscope. Key components and control loops are shown. The operator is a key control element with the ability to select and modify radiation factors, imaging geometry, image processing, etc. (© Stephen Balter.) |
9.1 FLUOROSCOPIC IMAGING CHAIN OVERVIEW
The principal feature of the imaging chain that distinguishes fluoroscopy from radiography is the fluoroscope’s ability to acquire acceptable real-time x-ray images with potentially high frame rates and lower dose per image. An up-to-date fluoroscopic imaging chain is shown in Figure 9-2. Its key component is the solid-state image receptor, commonly called a flat panel detector (FPD). This device converts the x-ray signal into a series of digital images.
Digital radiography (DR) systems use a similar image receptor. Older DR systems acquired single images, and current advanced systems can acquire low frame-rate sequences. The underlying technologies are close to convergence, and future systems with tunable gain capabilities may provide both fluoroscopy and radiography with the same hardware.
The x-ray tube in an angiography system with substantial copper beam filtration combined with low kV allows angiography systems to achieve lower patient radiation
dose compared to older systems, while still delivering high iodine image contrast for angiographic applications. A collimator changes the size of the x-ray beam in response to the operator limiting the active FOV to a clinically relevant area, to adjust for changes in the source-to-image-receptor distance (SID) or when the overall FOV of the image-receptor is changed, commonly due to the operator changing the magnification mode.
dose compared to older systems, while still delivering high iodine image contrast for angiographic applications. A collimator changes the size of the x-ray beam in response to the operator limiting the active FOV to a clinically relevant area, to adjust for changes in the source-to-image-receptor distance (SID) or when the overall FOV of the image-receptor is changed, commonly due to the operator changing the magnification mode.
 ▪ FIGURE 9-2 Diagram of a fluoroscopic system. The fluoroscopic imaging chain is illustrated, with the patient in the supine position. This figure includes a flat panel detector system. The x-ray system includes a collimator with motorized blades that automatically adjust to conform to the current field of view (FOV) and source-to-image-receptor distance (SID). |
The basic product of a fluoroscopic imaging system is a projection x-ray image similar to a radiograph; however, a 20-min “on time” interventional fluoroscopic procedure, conducted at 15 FPS, produces a total of 18,000 individual fluoroscopic images, in addition to a potentially large number of fluorographic (e.g., digital angiography [DA], DSA, cine) images. Due to the large number of images (also referred to as frames), fluoroscopic systems must produce each frame with much less dose than a comparable radiograph.
Fluoroscopes use sensitive, low noise detectors. Standard fluoroscopy typically uses a 10-100 nGy detector dose per image, the amount often dependent on frame rate. Fluorographic images use 100-1,000 nGy per image. DR systems operate at 1,000-5,000 nGy air kerma to detector per image, and computed-radiography detectors use a range from 3,000-10,000 nGy per image.
9.2 IMAGING CHAIN COMPONENTS
9.2.1 X-ray Image Intensifier
The x-ray image intensifier (II) was the key component of a fluoroscopy system from approximately 1960 to 2010. As some II based systems remain in clinical use, their characteristics will be discussed below. A diagram of an II is shown in Figure 9-3.
There are four principal components in an image intensifier: (1) an input screen that absorbs incident x-rays and converts the image to an electron pattern, (2) the electron optics, which accelerates the electrons and minifies the electron image,
(3) an output screen, which converts the accelerated electrons into a visible light image, and (4) a housing that maintains a vacuum, contains the other components, and provides an unimpeded path for the electrons that carry the image.
(3) an output screen, which converts the accelerated electrons into a visible light image, and (4) a housing that maintains a vacuum, contains the other components, and provides an unimpeded path for the electrons that carry the image.
 ▪ FIGURE 9-3 Diagram of an image intensifier. The image intensifier: x-rays pass through the input window of the vacuum element and strike the input screen, producing light that stimulates the photocathode to emit electrons, which are ejected into the electronic lens system. The electronic lens system adds energy to the image carrying electrons, while minifying the image onto a small output screen. The electron image is finally converted back to light at the output screen. These conversion steps are sketched on the bottom of the figure. The combination of energy input and minification in the electron optics yields an image 5-10 thousand times as bright as the image emerging from the input screen. |
Input Screen
The input screen includes a cesium-iodide (CsI) scintillator that converts the x-ray image into a visible light image and a photocathode that converts the light image into an electron image. The photocathode chemically degrades over time, which reduces the gain of the system. The input screen is curved to meet the needs of the II’s electron optics. This curvature results in pincushion distortion of the image.
The II’s CsI scintillator is like those found in most FPDs. Thus, the x-ray conversion properties of IIs and FPDs are similar. However, there are two differences:
The II’s input screen is inside the vacuum housing; a modest fraction of the x-ray beam is attenuated by the housing.
The FPD does not have a chemical photocathode and thus does not lose gain over time.
Electron Optics
Several electrodes in the II create an electrical field when appropriate voltages are applied to:
add energy to the electrons emitted by the photocathode under a potential difference of 25-40 kV between the photocathode and the output-screen/anode.
focus the electrons generated in the active area of the input onto the fixed size output-screen.
Multi-mode image intensifiers have additional sets of electrodes for each input field size.
Output Screen
The output screen of an image intensifier consists of a layer of silver doped zinc cadmium sulfide (ZnCdS) coated onto either a glass or fiber optic output layer. This phosphor produces green light. Its composition was initially chosen when image intensifier outputs were directly viewed by the human eye because the eye is most sensitive to green light.
The output screen produces an image of fixed phosphor dimension, typically 2.5 cm, irrespective of the size of the active input layer. Even though the ZnCdS grains are very small, they limit the spatial resolution of the image intensifier. The limiting resolution of an image intensifier is inversely proportional to the input screen’s diameter. (As discussed below, this is not true for flat-panel detectors.)
One effect of the electron optics is the concentration of all the signal intensity produced at the input screen onto the substantially smaller output screen. The gain in light intensity produced by minifying the image is proportional to the ratios of the areas of the input and output screens.
Maintaining the constant light output required by the video system requires a higher x-ray flux for magnified modes (active area of the input screen smaller than its full size) relative to the flux needed for operation at the full-size setting. For a constant output light level, the input dose level for an image intensifier is inversely proportional to the area of the input screen (also expressed as 1/d2 where d is the diameter of the active input area).
The brightness gain of an image intensifier is the ratio of the light intensity produced by fluorescence in the CsI input layer to the light intensity exiting the image intensifier. Its two components are electronic gain produced by the voltage applied between the photocathode and anode (output screen) and minification gain provided by focusing the large input area onto the small output area. A metric called the conversion factor is the light intensity exiting the II divided by the exposure rate at the input that measures overall performance and takes into account the brightness gain. The conversion factor decreases with degradation of the input phosphor/photocathode, and is one of the factors that contribute to image intensifier failure.
Vacuum Envelope
The purposes of the vacuum include providing an unimpeded path for the electrons from the photocathode to the output screen and avoiding artifacts caused by accelerating residual gas ions onto the output screen. Either or both effects will degrade image quality, eventually to the point where the tube is not clinically acceptable. The useful life of an image intensifier is prolonged by outgassing of its components during manufacturing and by active sequestration of internal gas during its service life.
The downside of the vacuum envelope is that it must be mechanically strong enough to handle atmospheric pressure without distorting. Thus, in early tubes, the input window was made of several mm of glass. X-ray absorption and scattering in the glass degraded the tube’s detective quantum efficiency (DQE—see
Chapter 4). Over time, improved glass-metal seals allowed replacement of glass with aluminum or titanium. This reduced input x-ray flux losses and improved the DQE.
Chapter 4). Over time, improved glass-metal seals allowed replacement of glass with aluminum or titanium. This reduced input x-ray flux losses and improved the DQE.
Optical Distributor
The II is coupled to a video camera either by an optical lens system or by a fiber optic plate. Analog video cameras only function within a limited range of light intensity. They rely on adjustable apertures in an optical chain to maintain an appropriate light level during different modes of operation of the fluoroscope and to compensate for deterioration of the image intensifier’s photocathode over time. Many fluoroscopes with analog video used beam splitters to deliver the higherbrightness image needed for film-based fluorography (no longer used) while permitting simultaneous video visualization.
Figure 9-4A and B illustrate distributors with digital fluorography and an analog video camera tube. Fluorographic images require more radiation to reduce quantum noise to a clinically acceptable level. The open optical aperture permits all the light to reach the camera during fluoroscopy. Closing the aperture drives the system to produce more radiation, thus decreasing quantum noise. CCD cameras have enough dynamic range to accommodate the x-ray intensities required for both digital fluoroscopy and digital fluorography. Beam splitters and lenses are not required, resulting in simpler optics (Fig. 9-4C).
Video Cameras
Charge coupled device (CCD) and complementary metal oxide semiconductor (CMOS) photosensitive cameras are solid-state electronic arrays that convert an optical image into a digital image and then into a video signal. Such a device has a rectangular array of photodiode semiconductor detector elements that convert incident light intensity into corresponding electronic charge (electrons), and locally store the charge for electronic readout. Both CCD and CMOS cameras have small dexel dimensions, on the order of 10-20 µm, incorporated into a 2.5 × 2.5 cm area. The typical matrix comprises 1,000 × 1,000 or 2,000 × 2,000 detector elements, but there is a wide selection of sizes that a manufacturer might choose to include in a system. CCD and CMOS cameras have linear responses over a very wide
brightness range. In either camera (CCD or CMOS), a digital image is produced, processed, stored in the fluoroscope, and then converted to a video signal displayed on one or more monitors in the fluoroscopy suite. For study transfer to a Picture Archiving and Communications System (PACS), the appropriate DICOM image and patient demographics metadata are attached to each of the digital image files or video sequences (see Chapter 5 for information on PACS).
brightness range. In either camera (CCD or CMOS), a digital image is produced, processed, stored in the fluoroscope, and then converted to a video signal displayed on one or more monitors in the fluoroscopy suite. For study transfer to a Picture Archiving and Communications System (PACS), the appropriate DICOM image and patient demographics metadata are attached to each of the digital image files or video sequences (see Chapter 5 for information on PACS).
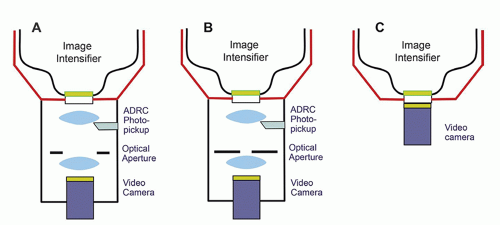 ▪ FIGURE 9-4 Optical components used to manage an Image Intensifier’s output images. A. The video pickup is used for both fluoroscopy and video-fluorography. Here the optical aperture is open to permit all the light emerging from the II to enter the camera during fluoroscopy. B. The optical aperture has been closed to restrict the amount of light reaching the video pickup during fluorography. C. A video pickup with very wide dynamic range allows operation at both fluoroscopic and fluorographic dose rates. Because there is no need to control light intensity, the pickup is directly coupled to the image intensifier. |
9.2.2 Flat-Panel Detectors
The flat panel image receptor replaces the image intensifier tube, optical system, and cameras by directly converting the x-ray images into a digital form. Because FPDs do not operate in a vacuum, they are mechanically protected by carbon fiber covers instead of the stronger metallic input surface of an image intensifier. This reduces x-ray attenuation and improves the quantum detection efficiency compared to the II. FPDs are comprised of thin film transistor (TFT) arrays of individual detector elements (dexels) that are packaged in a square or rectangular area (Fig. 9-5A). Both indirect and direct x-ray conversion modes are used with TFT panels for fluoroscopy (Fig. 9-5B). In both types of systems, each dexel has a capacitor, which accumulates and stores the signal as an electrical charge, and a transistor that serves as a switch. Indirect detection TFT systems have a phosphor layer that absorbs the x-rays and converts a fraction of their energy into light; each dexel has a transistor and a capacitor, in addition to a photodiode that converts the x-ray induced light from the phosphor into a corresponding charge (Fig. 9-5C). For direct detection fluoroscopy detectors, a semiconductor (selenium) produces x-ray induced charge directly, which is collected under an applied voltage to ensure that the signal is captured within the same dexel as the x-ray absorption event. In either detector type, while a frame (image) is being acquired, the electrical charge proportional to the x-ray flux incident on that dexel is accumulated and stored by the capacitor. Readout of the FPD is performed by electronically switching a gate line “on,” which opens all transistor gates for a given row. The charge stored in each dexel flows through its transistor’s drain line to a charge amplifier, and then the amplified signal is digitized. The gate line is then switched “off,” and readout progresses to the next gate line on the panel. Reading the array discharges the capacitors and readies them for acquiring the next frame. This is performed row by row until the entire frame is read. Even in continuous fluoroscopic acquisitions, the charge continues to be stored in each capacitor in a steady-state situation so that x-ray information is always collected as the flat-panel image receptor provides real-time fluoroscopic presentation of image data.
 ▪ FIGURE 9-5 Flat-panel detectors (FPD). A. Components in an indirect FPD. Note that the CsI layer is continuous and that there is space between individual dexels. The dexels in a direct x-ray system are also separated (not shown). B. Information flow through indirect and direct FPDs. C. The photodiode, and some of the electronics in a single indirect dexel. (© Stephen Balter.) |
 ▪ FIGURE 9-6 Pixel size and magnification mode—image intensifier and flat-panel detector. A-D. Image Intensifier—Analog and digital camera outputs. The full pixel array of the digital camera captures the output of the II at any magnification mode. E-G. Flat-panel detector with a fixed dexel array (e.g., Table 9-1 small detector). The same dexel covers the same portion of the patient irrespective of magnification mode (E,F). Resolution does not change when the image is digitally magnified. H. Flat-panel detector with unbundled dexels (e.g., Table 9-1 large detector, small FOV). Resolution is improved if the FPD can unbundle dexels when using a small FOV. (© Stephen Balter.) |
Dexel Arrays
The effects of reducing the FOV on spatial resolution are fundamentally different for an image intensifier and a flat panel. As noted above, the FOV of an image intensifier is reduced by electro-optically focusing a smaller portion of its input screen onto the fixed size output screen. This provides a fixed image size (image-matrix size) for the camera and image processor. The FOV is reduced by selecting a sub-array of dexels in a FPD. Its image processing pipeline handles larger numbers of dexels for large FOVs and smaller numbers of dexels for small FOVs. This difference is illustrated in Figure 9-6.
Processing Dexels into Pixels
Large FPDs have more dexels than the number of pixels in the image matrix. This affords a large enough dexel matrix to provide adequate spatial resolution in the detector’s smallest FOV. An image processing pipeline bins dexels to fit the active pixel matrix into the image matrix. Some processing occurs within the FPD itself, the remainder in downstream devices. Processor bandwidth limitations may require additional binning to accommodate very high frame rates. Table 9-1 provides an example of this effect. The effects of binning on spatial resolution, image noise, and radiation usage are discussed below.
Although the rectangular format, compact design, and digital output attributes of flat panel systems enhance functionality, the electron optics in the image intensifier produces images with very little added electronic noise. The cameras receive enough light at fluoroscopic dose rates to overcome video camera noise. Flat panel systems, however, have amplifier systems that work at the very limit of what digital electronics can deliver, and consequently, there is appreciably more electronic noise in most flat panel fluoroscopy systems when they are used for fluoroscopy. Thus, flat panel fluoroscopy detectors use slightly higher exposures per frame than image intensifiers. Electronic noise is far less of an issue for FPDs in fluorographic and radiographic acquisition modes, and thus, the exposure per frame is similar to that of the image intensifier.
TABLE 9-1 DEXELS, PIXELS, AND FIELD OF VIEW | ||||||||||||||||||||||||||||||||||||||||||||||||||||||||||||||||||||||||||||||||||||
|---|---|---|---|---|---|---|---|---|---|---|---|---|---|---|---|---|---|---|---|---|---|---|---|---|---|---|---|---|---|---|---|---|---|---|---|---|---|---|---|---|---|---|---|---|---|---|---|---|---|---|---|---|---|---|---|---|---|---|---|---|---|---|---|---|---|---|---|---|---|---|---|---|---|---|---|---|---|---|---|---|---|---|---|---|
| ||||||||||||||||||||||||||||||||||||||||||||||||||||||||||||||||||||||||||||||||||||
9.3 FLUOROSCOPIC X-RAY SOURCE ASSEMBLY
9.3.1 X-ray Tube
The general construction of all x-ray tubes is similar. However, due to the nature of the procedures, fluoroscopic x-ray tubes are commonly used in a more continuous manner than radiographic tubes. These tubes also operate at radiographic power levels during fluorography. Fluoroscopic tubes have higher heat-storage capacity and faster cooling rates than radiographic tubes. Traditionally, the small focal spot is used for fluoroscopy and the large focal spot for fluorography. Thus, spatial resolution is likely to decrease when going from fluoroscopy to fluorography. Some tubes also have an additional micro-focus focal spot intended for geometrically magnified procedures. Newer systems select the smallest available focal spot that can accommodate the immediate x-ray power level for all modes of operation. This will result in similar spatial resolution for thin body parts and lower resolution for fluorography of thick parts.
9.3.2 Collimator
Fluoroscopic collimators are designed to dynamically adjust the overall x-ray field size in response to a combination of inputs from both the operator and the system. The intention is to confine the x-ray beam to the smallest area within the active area of the image receptor that is consistent with immediate clinical requirements. Many systems also have additional, operator controlled, x-ray translucent elements (sometimes called wedge filters) that are used to equalize image receptor inputs when anatomical structures providing very different attenuation(e.g., lung and mediastinum) are simultaneously in the beam.
Portions of the x-ray beam that are not seen by the imaging chain do not supply any clinical information. Such irradiation unnecessarily increases both patient and staff radiation risk. Scatter from these areas also degrades image quality in the useful image.
Confinement of the beam to the active FOV is a system function. For both the image intensifier and the flat panel, the x-ray collimator automatically adjusts to limit the x-ray beam to the active FOV whenever the FOV is changed and to accommodate changes in the source-to-image-receptor-distance (SID). Ideally, the system should be set so that an unirradiated area is always seen around the edges of the image.
Collimation of the beam within the active FOV is the operator’s responsibility. Smaller beams produced by collimator adjustment by the operator reduce total
irradiation, thus improving both safety and image quality. The goal is to only irradiate the region of immediate clinical interest. Obtaining a smaller FOV by selection of a magnification mode does reduce the beam size and magnifies the displayed image; however, most fluoroscopes increase the dose-rate when the FOV is reduced by this method. Depending on programming, this increase may diminish or even negate the radiation saving effects of collimation within the FOV. Image magnification of a collimated area within a larger FOV can also be offered by the image processor through pixel replication and interpolation, or by simply viewing the image on a larger monitor. If the resulting image is clinically acceptable, this can reduce radiation dose relative to the use of magnification mode.
irradiation, thus improving both safety and image quality. The goal is to only irradiate the region of immediate clinical interest. Obtaining a smaller FOV by selection of a magnification mode does reduce the beam size and magnifies the displayed image; however, most fluoroscopes increase the dose-rate when the FOV is reduced by this method. Depending on programming, this increase may diminish or even negate the radiation saving effects of collimation within the FOV. Image magnification of a collimated area within a larger FOV can also be offered by the image processor through pixel replication and interpolation, or by simply viewing the image on a larger monitor. If the resulting image is clinically acceptable, this can reduce radiation dose relative to the use of magnification mode.
9.3.3 X-ray Spectral Shaping Filters
By 1990, the DQE of the image intensifier was near 50% and x-ray quantum noise was the major noise source in fluoroscopy. There was only a factor of two available for reducing patient irradiation by improving the efficiency of the image receptor. Radiation levels can also be reduced when the radiological conspicuity of clinically important items, such as contrast media and guidewires, is increased.
One way of improving the conspicuity of higher atomic number (Z) elements is to increase the fraction of x-ray photons in the beam with energies slightly above the K absorption edge of the material of interest (e.g., iodine at 33.2 keV). Spectral shaping can be accomplished by adding a copper filter (0.1-1.0 mm) and simultaneously restricting the x-ray tube’s operating kV (Fig. 9-7). Adding copper reduces the number of photons in the beam below the iodine edge. Reducing the kV limits the number of higher energy photons. For a given amount of electrical power consumed by the tube, such kV-filter combinations decrease the photon fluence available to form the image. Adequate fluence using spectrally shaped beams became feasible when x-ray tubes were developed with high power ratings.
Most modern fluoroscopic systems include variable thickness copper filters in the collimator assembly. The thickness of copper used at any given moment is automatically controlled by the AERC and operator selection of settings. In some systems, the acquisition selection (e.g., low-dose-rate fluoro, standard-dose-rate fluoro) determines the filter thickness. In other systems, the AERC further controls filter thickness
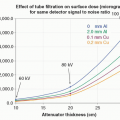
along with the usual x-ray factors. In some cases, for increasing patient thickness or acquisition mode changes, the limits of the x-ray tube power output require the filter thickness to decrease and the kV to increase. In such settings, at the same kV, the half value layer (HVL) will differ between fluoroscopy and fluorography; and the HVL may decrease with an increase in kV if there is a simultaneous decrease in copper thickness. Figure 9-8 illustrates this behavior for a typical interventional fluoroscope.
along with the usual x-ray factors. In some cases, for increasing patient thickness or acquisition mode changes, the limits of the x-ray tube power output require the filter thickness to decrease and the kV to increase. In such settings, at the same kV, the half value layer (HVL) will differ between fluoroscopy and fluorography; and the HVL may decrease with an increase in kV if there is a simultaneous decrease in copper thickness. Figure 9-8 illustrates this behavior for a typical interventional fluoroscope.
 ▪ FIGURE 9-7 Shaping the spectrum of the x-ray beam. A. The x-ray spectrum emerging from the tube is modified by a copper layer. The overall intensity of the beam is reduced, and the resultant spectrum has shifted to higher average energy. This figure shows the original spectrum, the attenuation coefficient of iodine as a function of energy, and the resultant modified spectrum with a higher fraction of photons above the iodine K edge. B. Increasing kV shifts the spectrum further, but most of the higher energy photons are far from the iodine K edge and do not contribute very much to iodine visualization. Tungsten K characteristic photons are seen here as well. C. Reducing kV moves more of the spectrum toward the iodine K edge. There are fewer low energy photons that would contribute to skin dose but not to the image. The photons, with energies above 60 kV shown in B are not produced. X-ray tubes need to have high power capabilities so that they can provide adequate x-ray flux without increasing kV. (© Stephen Balter.) |
 ▪ FIGURE 9-8 AERC controlled Cu spectral shaping filter thickness. Measured data from interventional fluoroscope installed in 2010. Layers of poly methyl methacrylate (PMMA) and lead were used to simulate different patient sizes. The AERC selected a kV and filter thickness based on the image-receptor signal. Separate algorithms were used for fluoroscopy and fluorography (cine). Note that although the kV was similar at every step, the filter used for cine declined much more rapidly than for fluoro. The removal of copper is the reason for a higher cine HVL at 80 kV than 90 kV. (© Stephen Balter.) |
9.4 CONTROLS
9.4.1 Automatic Exposure Rate Control
Fluoroscopes offer at least two fluoroscopic and one fluorographic sub-modes. Often, systems offer literally dozens to hundreds of sub-modes to accommodate a wide range of operator preferences and clinical requirements. Most of these use an AERC system. The purpose of AERC is to deliver a constant x-ray intensity to the image receptor irrespective of tissue thickness in the beam path. This results in a reasonably constant detector SNR over its working range. In a FPD, the AERC collects detected x-ray intensity information observed by a predetermined subset of dexels. Depending on clinical configuration, the subset ranges from dexels in a relatively small central area to all dexels within the collimated beam. If the average signal is too low, the AERC commands the generator to increase x-ray output. Similarly, too high a signal initiates a command to reduce radiation output. AERCs commonly further adjust outputs when the FOV or frame rate is changed. These adjustments stabilize the image noise perceived by the fluoroscopist when these factors vary.
For large patients or steep projection angles, the x-ray air kerma rate may reach the normal fluoroscopy regulatory limit (88 mGy/min). The resulting x-ray flux
reaching the image receptor (II or FP) is lower than desired, and x-ray quantum noise is higher than desired. Necessary additional electronic amplification may add additional noise. The noise in the resulting image may be too high for some clinical purposes. Some fluoroscopes have a specially activated high-level control (HLC), which enables a higher limit (176 mGy/min) to reduce noise. The high-level mode should be only used when clinically necessary.
reaching the image receptor (II or FP) is lower than desired, and x-ray quantum noise is higher than desired. Necessary additional electronic amplification may add additional noise. The noise in the resulting image may be too high for some clinical purposes. Some fluoroscopes have a specially activated high-level control (HLC), which enables a higher limit (176 mGy/min) to reduce noise. The high-level mode should be only used when clinically necessary.
Under AERC, the system changes the x-ray factors (kV, mA, pulse width), focal spot, and beam filtration in a predetermined manner that varies between systems. As noted above, the same system usually offers user-selectable options with markedly different behaviors. These selections are part of the toolkit used to select the balance between patient dose and image quality appropriate to different types of examinations, and in some cases different operator imaging requirements. The change in output, and the maximum output dose rate when changing from “low” to “normal” to “high-level” at any patient thickness is also included in the system’s configuration. Image processing parameters may also be controlled by the AERC. These changes further influence image presentation to the operator.
Figure 9-9 illustrates some possibilities with a hypothetical system equipped with three fluoroscopic modes, each with a different regulatory exposure-rate limit. In Figure 9-9A, the output is the same until the mode’s limit is exceeded. All three modes produce the same radiation output for thin to medium size patients. The “low” mode is limited to an air kerma rate (for C-arm gantries, at 30 cm from the image receptor assembly) of 44 mGy/min; in this mode all thicker patients receive the limiting dose rate while image quality decreases as patient thickness increases. Similar behavior is seen for the “normal” and “high-level” modes when their limits are reached. Figure 9-9B illustrates a system with three fluoroscopic modes. The lower two fluoroscopic modes converge near the regulatory limit. The high-dose-rate mode is higher for all patient thicknesses and has double the usual regulatory limit.
Figure 9-9C illustrates that the relationship between patient thickness and patient dose for any mode and dose rate limit is programmable. The upper curve is intended to maximize the visibility of iodinated contrast media as much as possible. The generator is programmed to keep the kV low and adjust mA and/or pulse width to provide an appropriate detector signal. The lowest curve is intended to minimize patient irradiation at the possible expense of iodine visualization. It does so by rapidly increasing kV with increasing patient thickness. One or more additional intermediate curves may be provided on a given system.
Related posts:
Stay updated, free articles. Join our Telegram channel

Full access? Get Clinical Tree


