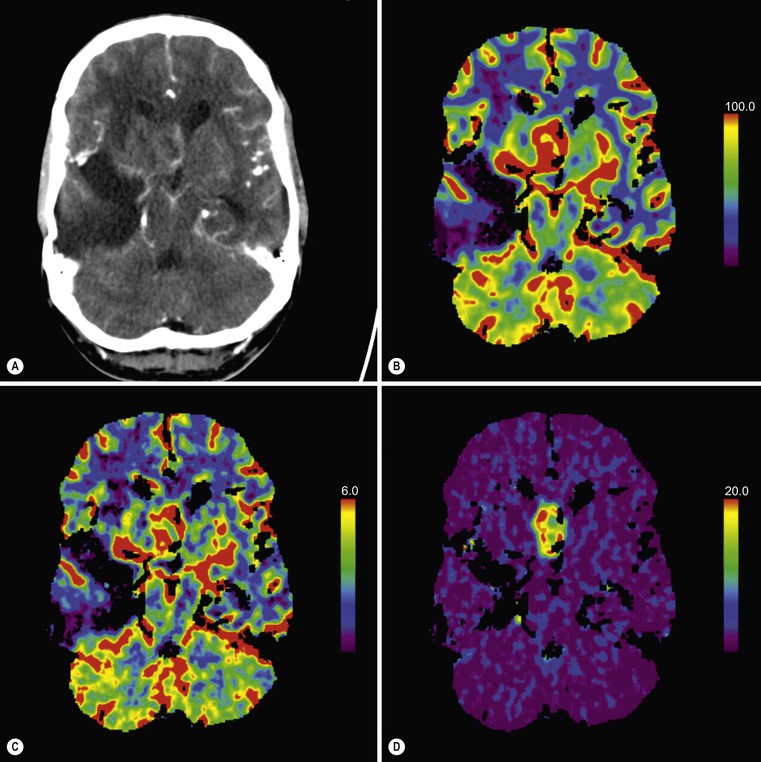
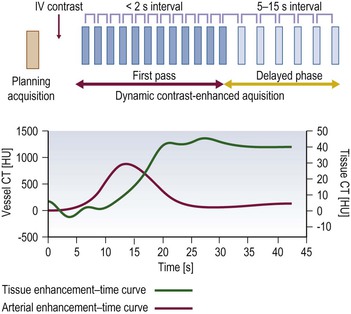
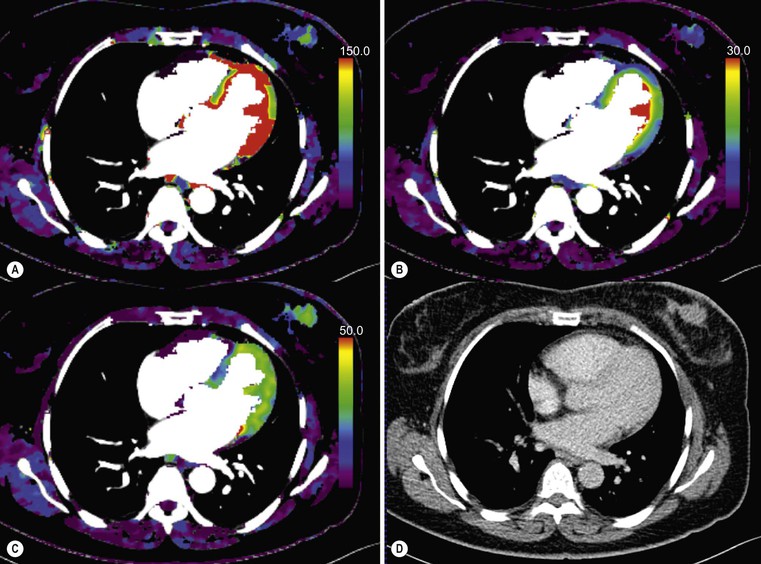
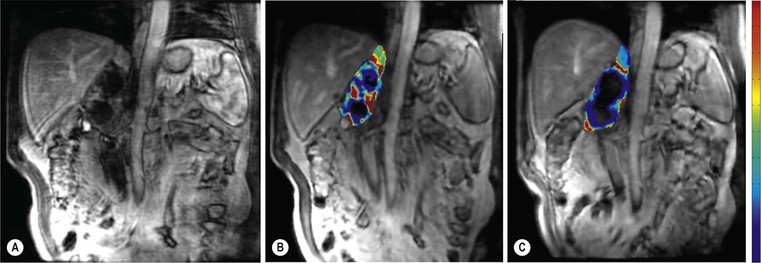
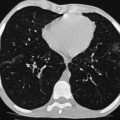
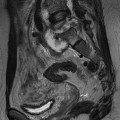
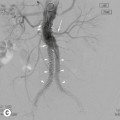
Ferdia A. Gallagher, Avnesh S. Thakor, Eva M. Serrao, Vicky Goh The essence of oncological imaging is to detect and differentiate tumour from normal tissue. It is therefore necessary to understand the fundamental changes that occur within tissues or cells when a tumour forms, and how this can be used to generate tissue contrast. On the very simplest level, the differences in X-ray attenuation and water content between cancer and its surrounding tissues can be used to distinguish cancer from normal tissue using computed tomography (CT) and magnetic resonance imaging (MRI), respectively. Biological research in the field of oncology is increasingly revealing the fundamental tissue, cellular and molecular changes that form the hallmarks of cancer and this knowledge is now being applied to the development of new imaging biomarkers which will be more specific and sensitive for cancer detection than morphological information alone.1 Examples include the use of CT and MRI contrast agents to probe angiogenesis, as well as positron emission tomography (PET) tracers to detect alterations in cellular energetics and proliferation within cancerous tissue. In addition to identifying tumours, imaging biomarkers can be used to assess the efficacy of treatment such as chemotherapy and radiotherapy. Traditionally, this has been performed by identifying changes in tumour size using criteria such as the response evaluation criteria in solid tumours (RECIST); new imaging biomarkers which are more specific and sensitive for the detection of early response to treatment by detecting early cellular or molecular changes that predict long-term successful outcome are being developed. The introduction of therapies which have specific molecular targets (such as bevacizumab and sunitinib) has been problematic for traditional imaging approaches as improved clinical outcome with these drugs is often not accompanied by a significant change in tumour size; e.g. an anti-vascular drug may induce tumour necrosis with little change in the overall tumour diameter. Consequently, alternative imaging approaches are needed to identify a successful early response to therapy in this context; the concept of combining a specific targeted drug with an imaging biomarker that directly probes the cellular pathways affected by the drug is a very attractive approach for the future management of cancer patients. These specific targeted imaging biomarkers also open up the possibility of detecting subtle differences in drug response between patients: a cellular pathway may be upregulated in one patient but downregulated in another in response to the same drug at the same dose. The old concept of a single treatment algorithm for all patients is increasingly being replaced by a personalised or patient-centred approach where drug therapy can be tailored to an individual patient. Modern medical practice is underpinned by an understanding of the molecular biology of disease processes; complementing this with new imaging techniques will be increasingly important. These molecular imaging methods can be defined as the visual representation, characterisation and quantification of biological processes at the cellular and subcellular levels within intact living organisms.2 Functional imaging is more loosely defined and includes techniques which probe physiological processes such as blood flow, metabolism and features of the tumour microenvironment. There is some overlap between the two terms and often the combination of functional and molecular imaging is used to define a range of imaging techniques that are more specific than anatomical or morphological imaging and probe processes from a tissue to a molecular level. This chapter will explore the use of these functional and molecular techniques in oncological imaging. There has been a recent resurgent interest in dynamic contrast-enhanced CT techniques for assessing the vasculature, which were first used in the early 1990s. This has been facilitated by technological advances allowing high temporal sampling acquisitions to be performed over a large volume (also known as perfusion CT ) as well as therapeutic developments in stroke and cancer which have required an assessment of the functioning vasculature on an individual patient basis (Fig. 74-1). CT contrast agents used in clinical practice are low molecular weight contrast agents (< 1 kDa) with negligible serum protein binding and therefore a distribution similar to that of extracellular fluid. These agents are typically derivatives of iodobenzoic acid with an iodine concentration of at least 300 mg/mL. After intravenous injection (typically 4 mL/s or faster), the pharmacokinetic modelling can be approximated to a two-compartment model: the injected contrast agent initially remains within the intravascular compartment before diffusing into the extravascular and extracellular space (EES). The rate of this diffusion is determined by the perfusion of the organ, the vessel surface area and its permeability or leakiness; there is negligible transfer into the intracellular compartment (< 1%). The contrast agent then passes back from the EES into the intravascular compartment before being excreted predominantly by the kidneys; up to half of the administered dose is eliminated from the blood within the first two hours of injection. By acquiring a rapid series of images following intravenous contrast agent administration, and assessing the changes in tissue and vessel attenuation during the acquisition, functional parameters can be derived (Fig. 74-2). These may be semi-quantitative (describing the ‘curve shape’ of the tissue attenuation–time graph), or quantitative parameters derived from kinetic modelling. As the change in measured CT attenuation is directly proportional to the concentration of iodine within the blood vessels or tissues, temporal changes in attenuation can be directly modelled to assess the tissue vascularity. The situation is somewhat different for MRI, where there is a complex relationship between MR signal intensity and the local tissue concentration of MR contrast medium. Acquisition is normally acquired over the 45 s of the perfusion phase and the larger the number of data acquisition points during this period, the better the data fitting. However, this has to be balanced against increasing radiation dose and the finite time required for each acquisition.3 In general, at least five time points are acquired and the quantitative parameters are derived using a number of models, e.g. the Johnson–Wilson model, the Patlak method and the maximum slope model.3–6 Further description of these techniques is given in Chapter 7. The derived parameters include: • regional tumour blood flow—blood flow per unit volume or unit mass of tissue; • regional tumour blood volume—the proportion of tissue that comprises flowing blood; • mean transit time—the average time for contrast material to traverse the tissue vasculature; The basis for the use of DCE-CT in oncology is that microvascular changes during angiogenesis are reflected in changes in the measured DCE-CT parameters; for example, permeability–surface area product is usually lower in normal tissue than in tumours (Fig. 74-3). DCE-CT measurements have been validated in a range of tumours in both animal models and human studies.7,8 Measurements have been correlated positively with histological markers of angiogenesis and negatively with histological markers of hypoxia, indicating that these may be appropriate surrogates of fundamental biological processes during cancer formation. In terms of characterisation, DCE-CT may distinguish benign from malignant lesions within the lung, pancreas and bowel though there is some overlap between malignant and inflammatory lesions, which reflects the generic nature of the vascular changes that can be probed.9–12 In general, higher perfusion parameters have been reported in patients with tumours although there is variability between different types of tumours and even within the same tumour, which underlies the complexity of tumour heterogeneity. The major application of DCE-CT in routine clinical practice is in the assessment of the anti-vascular effects of conventional chemotherapies and interventional procedures, which target the vasculature. DCE-CT is also used to provide pharmacodynamic information in early-phase clinical trials in a variety of cancers (Table 74-1).13–23 These have included anti-angiogenic and vascular disrupting agents, where DCE-CT is providing a direct imaging biomarker of the drug action and can be used to determine the appropriate drug dose. The wide availability of CT, the low cost of CT and the ease of standardisation of DCE-CT are advantages over MRI for its use in clinical practice despite the radiation burden. However, CT carries a significant radiation burden and there still remains a lack of data concerning the relationship between acute vascular reduction and long-term patient outcome. TABLE 74-1 Table of Clinical Trials Incorporating DCE-CT13–23 BF = regional blood flow; BV = regional blood volume; MTT = mean transit time. In addition to identifying treatment response, DCE-CT may have an important role in risk stratification and as a predictive biomarker of treatment. The basis for the predictive value of DCE-CT in the setting of chemotherapy is likely to relate to reduced drug delivery, while in radiotherapy this is likely to represent a marker of the hypoxic environment, which in turn correlates with resistance to radiotherapy. For example, in locally advanced squamous cell carcinoma of the head and neck treated with surgery and adjuvant chemoradiotherapy, pre-treatment primary tumour blood flow and permeability may be independent predictors of disease recurrence.24 In pancreatic cancer, a low baseline volume transfer constant (K trans) predicts for a poorer response to chemotherapy with gemcitabine and radiotherapy.25 In colorectal cancer, tumours with a lower blood flow at staging are more likely to have nodal metastases and a poorer outcome; rectal tumours with a lower blood flow are also more likely to respond poorly to chemoradiation.26,27 The cancer risk associated with the radiation dose of DCE-CT has to be balanced against potential benefits of vascular quantification and must be judged in the context of the population under investigation. Typical effective radiation doses from a first-pass volumetric perfusion CT study of the thorax, abdomen or pelvis range from 13.7 to 28.7 mSv.28 Using a risk estimate of 4.2% per Sv from the International Commission on Radiation Protection, the estimated lifetime risk of developing a cancer from a single such perfusion CT is approximately 1 in 1000.29 DCE-MRI consists of serial MRI acquisitions following injection of an intravenous contrast agent in a similar manner to that described above for DCE-CT. Clinical dynamic MRI is usually performed using low molecular weight gadolinium chelate-based contrast agents. These have paramagnetic ions that are known to interact with nearby hydrogen nuclei and lead to shortening of T1 (and T2) relaxation times, resulting in signal enhancement on T1-weighted images, thus producing positive contrast. The major advantages of MRI include the absence of ionising radiation, high contrast-to-noise ratio, high signal-to-noise ratio and the many mechanisms which can be utilised to produce tissue contrast.30 As with contrast-enhanced CT, contrast-enhanced MRI can either be used to provide a qualitative snapshot of tissue enhancement, as is used routinely in clinical practice, or more quantitatively in the form of DCE-MRI (Fig. 74-4). The latter permits a fuller depiction of contrast kinetics within lesions in much the same way as DCE-CT. DCE-MRI can be repeated over a course of treatment to monitor changes in tumour vascularity over time. Although the technique is reproducible when using a single clinical MRI system, the reproducibility of DCE-MRI studies between centres may be less robust, due to the differences in scanner hardware, contrast agent injection protocols, acquisition parameters, and kinetic models employed.31 DCE-MRI protocols most commonly involve T1-weighted image acquisition before, during and after the injection of the MR contrast agent (typically 0.1 mmol/kg with injection after 1 min and continuous data acquisition for up to 10 min); this provides an assessment of the different stages of tissue uptake and washout.32,33 The contrast agents used are either low molecular weight agents (< 1 kDa) that rapidly diffuse into the extracellular space or larger macromolecular agents (> 30 kDa) that demonstrate prolonged intravascular retention.30 Given the lack of ionising radiation in DCE-MRI, temporal data can be continuously acquired during the phases of tissue enhancement, unlike in DCE-CT. The concentration of the contrast agent in the vasculature allows an assessment of perfusion, and in the case of the low molecular weight agents, this is followed by rapid diffusion into the EES where it accumulates. As with DCE-CT, the rate at which this occurs is dependent on blood flow as well as vessel permeability and surface area.30,34 However, MR signal intensity is not directly proportional to the contrast agent concentration and therefore more complex quantitative data analysis is required to convert the MR signal intensity into biologically meaningful quantitative parameters.35–37 A simple approach is to use the initial area under the curve (IAUC), which describes the shape of the graph of contrast agent concentration over time; although this is frequently used in trials, it is difficult to interpret physiologically.38 Therefore, in clinical trials, assessment of the effect of an anti-angiogenic or vascular disrupting agent is often modelled using changes in K trans (the volume transfer coefficient of contrast between the blood plasma and the EES, as described above for CT) and the volume of the EES (ve).39 The other commonly used pharmacokinetic variables are summarised in Tables 74-2 and 74-3.32,40 TABLE 74-2 Most Common Pharmacokinetic Parameters Used in DCE-MRI Analysis32,40 Adapted from Yang et al.40 and Tofts et al.32; a.u., arbitrary units. TABLE 74-3 Model-Free Parameters Applied in DCE-MRI Analysis32,40 Adapted from Yang et al.40 and Tofts et al.32; S(t), MR signal intensity at time t; S0, precontrast signal intensity; Smax, maximum signal intensity; a.u., arbitrary units. DCE-MRI and DCE-CT exploit the fact that the onset of many diseases is associated with an alteration in vascular density, vascular permeability and blood flow. In particular, tumours develop a network of new vessels as they grow, but unlike normal vasculature, tumour angiogenesis is chaotic and inefficient with permeable vessels.41 Therefore, an increase in signal enhancement, vessel permeability, and flow is often demonstrated within tumours when compared with benign lesions or normal tissue.42–45 DCE-MRI has been used for tumour detection, characterisation, staging, and therapy monitoring. However, the meaning of an elevated K trans is still controversial in terms of prognosis, as studies have shown conflicting results;46,47 there is stronger evidence that K trans can be used to demonstrate which tumours are responding to therapy as a pharmacodynamic biomarker of drug activity, particularly in the context of anti-angiogenic drugs or vascular disrupting agents.38,48 Changes in K trans have been shown to correlate both with the administration of vascular endothelial growth factor (VEGF, a signalling molecule that stimulates the growth of new blood vessels), as well as the administration of therapeutic monoclonal antibodies that block its effect.49 Consequently, both DCE-MRI and DCE-CT can be used as a platform to understand drug and tumour interactions.50 Another emerging approach has been to use dynamic susceptibility contrast MRI (DSC-MRI), which also relies upon the serial acquisition of images after the injection of a contrast agent.51,52 However, DSC-MRI measures induced alterations in the transverse relaxation times, T2 and T2*, resulting in signal loss and hence transient darkening of the tissues (thus acting as a negative contrast unlike that seen with T1-weighted imaging).30 The degree of signal loss is dependent on the concentration of the agent as well as vessel size and density and therefore this can be used to estimate the relative blood volume (rBV) of the tissue under assessment.53 Using this technique, changes in relative cerebral blood volume (rCBV) maps have been correlated with glioma grade and this approach can be used not only to understand the nature of tumour heterogeneity better but also to target biopsies to focal areas of vascular changes within a tumour, which may help to avoid sampling error.54 The method has also been used to distinguish radiation necrosis from recurrent disease, evaluate response to therapy and as a prognostic marker.55,56 Its application to extracerebral tumours (e.g. breast and prostate) is under investigation.57,58 The role of DCE-MRI in clinical practice has been limited by the relatively small number of patients in many published trials, the use of widely varying acquisition techniques and modelled parameters between centres, as well as the use of diverse disease endpoints. Current attempts to standardise DCE-MRI will help to address these issues in the future. Although DCE-MRI has shown much promise, it has yet to be incorporated into routine clinical practice (Table 74-4).59–68 TABLE 74-4 Table of Some Clinical Studies Incorporating DCE-MRI59–68 Water molecules in the liquid phase undergo thermally driven random motions, a phenomenon known as Brownian motion or free diffusion, and it is these small motions—typically of the order of 30 µm—which can be probed and quantified using DWI.69 These small molecular movements can be measured by spin-echo T2-weighted sequences, in which two equal diffusion sensitising gradients are applied before and after a 180° radiofrequency pulse.69,70 The b-value (in s/mm2) is a commonly applied term that allows the quantification of these gradients by pooling information from a number of variables. By measuring how far a molecule moves in a fixed time interval, the diffusion constant can be calculated.
Functional and Molecular Imaging for Personalised Medicine in Oncology
Personalised Medicine in Oncology
Dynamic Contrast-Enhanced Computed Tomography (DCE-CT)
Contrast Agent Kinetics
Tumour
Therapy
Parameter
Author
Year
Solid tumours
Endostatin
BF, BV (decrease)
Thomas et al.13
2003
Rectal cancer
Bevacizumab
BF, BV (decrease)
Willett et al.14
2004
Solid tumours
SU6668
BF, BV (decrease)
Xiong et al.15
2004
Solid tumours
MEDI-522
MTT (increase)
McNeel et al.16
2005
Renal cancer
Thalidomide
BF, BV (decrease)
Faria et al.17
2007
Squamous cell carcinoma oropharynx
Cisplatin and 5FU
BF, BV (decrease in responders)
Gandhi et al.18
2006
Solid tumours
AZD2171 and gefitinib
BF (decrease)
Meijerink et al.19
2007
Non-small cell lung cancer
Combretastatin and radiotherapy
BV (decrease)
Ng et al.20
2007
Solid tumours
Nitric oxide synthase inhibitor
BV (decrease)
Ng et al.21
2007
Renal cell carcinoma
Tyrosine kinase inhibitors
BF, BV (decrease)
Fournier et al.22
2010
Non-small cell lung cancer
Erlotinib/sorafenib
BF (decrease)
Lind et al.23
2010

Magnetic Resonance Imaging (MRI)
Dynamic Contrast-Enhanced MRI (DCE-MRI)
Parameter (units)
Alternative Nomenclature
Definition
K trans (min−1)
EF, K PS
Volume transfer constant between blood plasma and EES
ve (a.u.)
Interstitial space
EES volume per unit tissue volume
vp (a.u.)
Blood plasma volume per unit tissue volume
kep (min−1)
k21
Rate constant from EES to blood plasma
kep = K trans / ve
kpe (min−1)
k12
Rate constant from blood plasma to EES
kel (min−1)
Elimination rate constant
Amp (a.u.)
A
Amplitude of the normalised dynamic curve
Parameter (Units)
Alternative Nomenclature
Definition
Area under the curve (min or mmol⋅min/L)
IAUC, AUC, AUGC, IAUGC
Area under the signal intensity or gadolinium dynamic curve
Relative signal intensity (a.u.)
RSI = S(t)/S0
Relative signal intensity at time (t)
Initial slope (min−1)
Enhancement slope, upslope, enhancement rate
Maximum or average slope in the initial enhancement
Washout slope (min−1)
Downslope, washout rate
Maximum or average slope in the washout phase
Peak enhancement ratio (a.u.)
Maximum signal enhancement ratio (SERmax)
PER = (Smax − S0)/S0
Tmax (s)
Time-to-peak (TTP)
Time to peak enhancement
Maximum intensity-time ratio (s−1)
MITR = PER/Tmax
Tumour
Therapy
Parameter
Author
Year
Solid tumours
AG-013736
K trans, IAUC
Lui et al.59
2005
Solid tumours
AZD2171
IAUC
Drevs et al.60
2007
Renal cell carcinoma
Sorafenib
K trans
Flaherty et al.61
2008
Breast cancer
Neoadjuvant 5-fluorouracil, epirubicin and cyclophosphamide
K trans, kep, ve, rBV, rBF, MTT
Ah-See et al.62
2008
Primary liver tumours
Floxuridine and dexamethasone
K trans, kep, AUC
Jarnagin et al.63
2009
Glioblastoma
Bevacizumab
K trans, ve
Ferl et al.64
2010
Breast cancer
Neoadjuvant therapy: 5-fluorouracil, epirubicin and cyclophosphamide
K trans, ve
Jensen et al.65
2011
Prostate cancer
Androgen deprivation therapy
K trans, kep, vp, IAUGC
Barrett et al.66
2012
Cervical cancer
Radiotherapy & cisplatin and 5-fluorouracil plus cisplatin
K trans, kep, ve
Kim et al.67
2012
Rectal cancer
FOLFOX and bevacizumab
K trans, kep, ve, AUC
Gollub et al.68
2012

Diffusion-Weighted Imaging (DWI)
![]()
Stay updated, free articles. Join our Telegram channel

Full access? Get Clinical Tree


Functional and Molecular Imaging for Personalised Medicine in Oncology
Chapter 74

