Functional Imaging of the Airways
Advances in thoracic imaging, until recently, have been focused primarily on improved depiction of structural changes. The introduction of high-resolution computed tomography (HRCT) scanning of the lungs and, more recently, multidetector helical scanners, together with newer volumetric image analysis tools, has greatly advanced anatomic imaging of the airways and the lung parenchyma.
Static structural images, however, do not begin to reflect the highly physiologic nature of the lungs: the cyclic flow of inspired gas from the upper airway into the distal airspaces, the changing caliber and wall thickness of airways during the respiratory cycle, the ongoing exchange of oxygen and carbon dioxide across the alveolar-capillary wall, the auto-regulation and matching of regional ventilation and perfusion, the flow of expired gas from the alveoli back to the upper airway, and the rhythmic motions of the heart, diaphragms, and chest wall. Although we marvel at what we have been able to image, these important functions have been largely invisible to the eyes of the radiologist, as dark matter and dark energy are to the astronomer and cosmologist.
Functional imaging of the lungs has largely been indirect, relegated to correlating the structural changes depicted on these scans with conventional pulmonary function tests (PFTs). For example, CT-based grading of emphysema has been correlated with spirometric measures of airflow obstruction and decreased diffusion capacity, and likewise grading of interstitial lung disease with PFT measures of restrictive physiology.
Direct functional imaging of the lungs until recently has been largely limited to nuclear medicine techniques, including standard ventilation and perfusion scintigraphy and, to a lesser extent, single-photon emission tomography (SPECT) and positron emission tomography (PET). The introduction of both static inspiratory-expiratory CT scanning and dynamic imaging with electron beam CT (EBCT), as well as with multirow detectors for helical CT, enabled evaluation of abnormal tracheobronchial collapse and/or gas trapping. HRCT has been used to measure the caliber and wall thickness of bronchi in response to pharmacologic agents such as methacholine and bronchodilators in studies of airway reactivity in asthma. These techniques represent important initial steps in using CT to evaluate airway function.
We are witnessing the emergence of a number of exciting, new approaches to direct imaging of pulmonary ventilation, principally using magnetic resonance (MR) and CT techniques (Tables 6-1 and 6-2). The introduction of new MR contrast agents, including the hyperpolarized noble gases 3helium and 129xenon among others, along with more rapid pulse sequences, have enabled direct imaging of gas wash-in, distribution in the lungs, and washout with unprecedented spatial and temporal resolution. Likewise, dynamic, high-resolution, contrast-enhanced CT ventilation scanning using stable nonradioactive xenon gas recently has been shown to be feasible.
These new techniques offer a number of substantial advantages over traditional methods of assessing pulmonary function. Although conventional PFTs have become an indispensable tool in pulmonary medicine, and have revealed a wealth of information about lung physiology in normal and diseased states, they are limited to global measurements of total lung function. The image-based methods, on the other hand, can provide quantitative displays of regional lung function, not only of individual lungs but also of lobes, segments, and even smaller regions. This represents a major step forward, since the physiology of both the normal lung and virtually all lung
disorders is heterogeneous to some degree (Fig. 6-1). Common examples include centrilobular emphysema, which is commonly upper zone predominant; usual interstitial pneumonia, a typically basilar disease with temporal and spatial heterogeneity in its pathologic evolution (Fig. 6-2); asthma and small airway disease, in which the airway abnormalities are heterogeneously distributed both spatially and temporally; pulmonary embolism, which involves select pulmonary vascular distributions; and adult respiratory distress syndrome (ARDS), in which the lung involvement and resulting mechanical impairment are typically heterogeneously distributed.
disorders is heterogeneous to some degree (Fig. 6-1). Common examples include centrilobular emphysema, which is commonly upper zone predominant; usual interstitial pneumonia, a typically basilar disease with temporal and spatial heterogeneity in its pathologic evolution (Fig. 6-2); asthma and small airway disease, in which the airway abnormalities are heterogeneously distributed both spatially and temporally; pulmonary embolism, which involves select pulmonary vascular distributions; and adult respiratory distress syndrome (ARDS), in which the lung involvement and resulting mechanical impairment are typically heterogeneously distributed.
TABLE 6-1 MR VENTILATION AGENTS | ||||||
|---|---|---|---|---|---|---|
|
Moreover, these new methods are able to image other physiologic parameters that were previously unavailable on a region-by-region basis, such as alveolar oxygen partial pressures, airway gas diffusion rates, alveolar-capillary gas diffusion, direct ventilation-perfusion matching, and regional lung biomechanics. In addition, these multiparametric functional maps can be coregistered and overlaid on the high-resolution anatomic displays, providing exciting new ways to visualize structure-function relationships in the lung. Furthermore, this new functional information can be used to determine morphometric features of alveolar microstructure, such as alveolar size, shape, and wall thickness, which are beyond the anatomic resolution capability of current clinical scanners. Thus, with these new imaging developments we have moved from extrapolating function from structure to revealing lung microstructure from function.
Although many of these new methods are investigational and/or in an early stage of clinical application, they offer the potential not only to localize sites of disease for therapy but also possibly to detect the onset of disease before the onset of visible structural changes or detection by less sensitive global PFT measurements. These evolving functional imaging techniques also hold promise as a means to monitor new therapies, such as surgical and mechanical approaches to advanced emphysema, new medical treatments for asthma and chronic interstitial disease, or tailoring of mechanical ventilatory parameters in ARDS.
TABLE 6-2 CT VENTILATION AGENTS | |||||
|---|---|---|---|---|---|
|
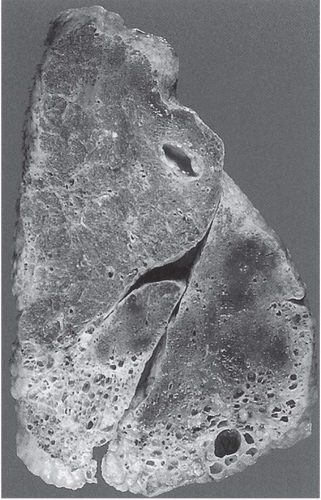 Figure 6-1 Heterogeneous spatial distribution of disease in the lung. Sagittal slice of the right lung with usual interstitial pneumonia shows severe fibrosis and honeycomb change in the basal aspects of the lower and middle lobes. Less marked disease can be seen in the subpleural region of the anterior portion of the upper lobe and posterior portion of the lower. (From Muller NL, Fraser RS, Lee KS, Johkoh T. Diseases of the lung. Radiologic and pathologic correlations. Philadelphia: Lippincott Williams & Wilkins, 2003, with permission.) |
In this chapter, we describe and illustrate these new functional imaging techniques and their applications to the evaluation of normal and diseased airways. Although clearly molecular imaging technologies, including PET and optical methods, which are currently in their infancy, represent another major future direction in the functional
imaging of lung disease, we focus here on physiologic imaging primarily using CT and MR.
imaging of lung disease, we focus here on physiologic imaging primarily using CT and MR.
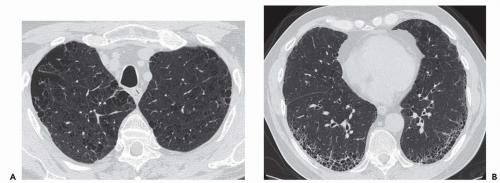 Figure 6-2 A and B: Regional distribution of pathology is illustrated in this patient with centrilobular emphysema in the upper lung zones (A), and pulmonary fibrosis with honeycombing resulting from idiopathic pulmonary fibrosis (IPF) in the lower lung zones (B). Conventional PFTs may indicate mixed obstructive and restrictive physiologies but, unlike CT, cannot spatially separate these processes. |
THE UPPER AIRWAY
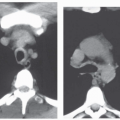
The upper airway is an important, albeit underemphasized component of the respiratory tract. Not only is the upper airway the portal of entry for ventilation, but also the entire tidal volume during each breath must traverse a rather small aperture along the small-diameter segments of the retropharyngeal and retroglossal airway (Fig. 6-3). Interestingly, the upper airway must be rigid enough to withstand collapse by the negative intraluminal pressure generated during inspiration, and yet it must be sufficiently compliant to allow for the marked shape changes that are needed for swallowing and phonation. Thus, the upper airway is a finely controlled apparatus in which the caliber of the airway lumen is maintained by active dilator muscle activity counterbalancing the inspiratory negative intraluminal pressure.
Upper airway imaging studies using both ultrafast MR and EBCT, in conjunction with physiologic monitoring of respiration, are providing new insights into the biomechanical functioning of the normal upper airway, as well as clues to the pathophysiology of obstructive sleep apnea (OSA), a common respiratory disorder (1). Furthermore, these upper airway imaging techniques are helping to elucidate the mechanisms underlying the efficacy of various therapeutic interventions for this disorder. Dynamic imaging during both wakefulness and sleep has provided the opportunity to analyze the behavior of upper airway structures during respiration as well as airway closure associated with apneic events. Although upper airway imaging currently serves primarily as a powerful research tool, clinical indications for upper airway imaging in OSA are emerging. For example, MR imaging may be considered for preoperative evaluation of patients undergoing surgical treatment (uvulopalatopharyngoplasty) or CT scanning with volumetric reconstructions in patients undergoing maxillomandibular advancement (1).
Respiratory-related dynamic upper airway imaging has been performed with CT, MR, and nasopharyngoscopy. EBCT studies in normal persons and in patients with OSA during wakefulness have revealed that (Fig. 6-4): (a) at the onset of inspiration, there is a small increase in upper airway area, presumably reflecting increased activity of the upper airway dilator muscles; (b) during most of inspiration, the airway area remains relatively constant, suggesting a balance between upper airway dilator muscle action and the negative intraluminal pressure; (c) in early expiration, upper airway caliber increases owing to positive airway pressure expanding the passive airway; this expansion is relatively larger in patients with OSA, reflecting a more distensible airway; and (d) at end-expiration, airway caliber rapidly decreases because neither the expiratory positive intraluminal pressure nor the phasic inspiratory active dilator muscle activity is available to distend the airway. This end-expiratory collapse is particularly evident in OSA patients, suggesting greater collapsibility of the apneic airway. These transluminal cross-sectional changes are greater in the lateral dimension, reflecting the behavior of the lateral pharyngeal muscular walls, compared with the anteroposterior dimension which relates to the position of the soft palate and the tongue (2,3).
These data, obtained via imaging, suggest that the upper airway may be particularly susceptible to collapse at the end of expiration. Shephard et al. (4) using EBCT also found that airway caliber was smallest at the end of expiration in apneics. Of note, these data suggest that airway closure is occurring at end-expiration, before the generation of negative
pressure during inspiration. Imaging studies obtained during sleep have also supported these findings. Studies of airway closure during sleep with nasopharyngoscopy (5) revealed that airway narrowing occurred during expiration, again indicating the importance of end-expiration in the genesis of obstructive apneas. Application of positive airway pressure near the end of expiration to prevent this narrowing of the airway may thus be beneficial in OSA.
pressure during inspiration. Imaging studies obtained during sleep have also supported these findings. Studies of airway closure during sleep with nasopharyngoscopy (5) revealed that airway narrowing occurred during expiration, again indicating the importance of end-expiration in the genesis of obstructive apneas. Application of positive airway pressure near the end of expiration to prevent this narrowing of the airway may thus be beneficial in OSA.
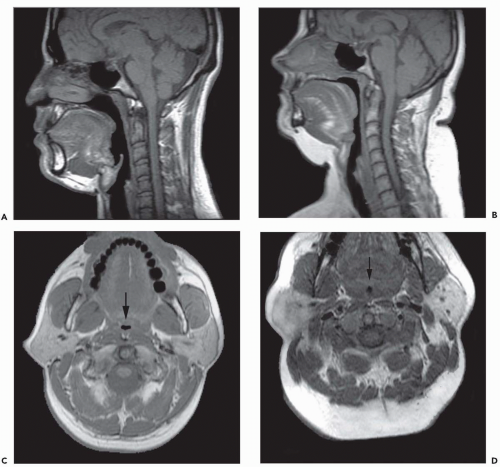 Figure 6-3 A: Midsagittal MR image of the upper airway in a normal subject. B: Midsagittal MR image of the upper airway in a patient with obstructive sleep apnea (OSA), demonstrating airway narrowing. Note increased submental and posterior subcutaneous fat. Comparison of an axial MR image in the retropalatal region of a normal subject (C) and a patient with sleep apnea (D). The patient with sleep apnea has a smaller airway area and width and a larger lateral pharyngeal wall. |
CT studies have revealed that the respiratory-related changes in upper airway caliber are predominantly in the lateral rather than the anteroposterior dimension, implying that the lateral walls play an important role in modulating airway caliber (2,3). Cine MRI has also confirmed these CT findings, demonstrating an inverse relationship between airway caliber and the size of the lateral pharyngeal walls (6). The latter were relatively constant in inspiration,
thinned in early expiration, and thickened toward the end of expiration. Contrary to expectations, these data indicated that the lateral pharyngeal airway muscles are more important than the tongue and soft palate in mediating respiratory cycle-related dynamic changes in upper airway cross-sectional areas.
thinned in early expiration, and thickened toward the end of expiration. Contrary to expectations, these data indicated that the lateral pharyngeal airway muscles are more important than the tongue and soft palate in mediating respiratory cycle-related dynamic changes in upper airway cross-sectional areas.
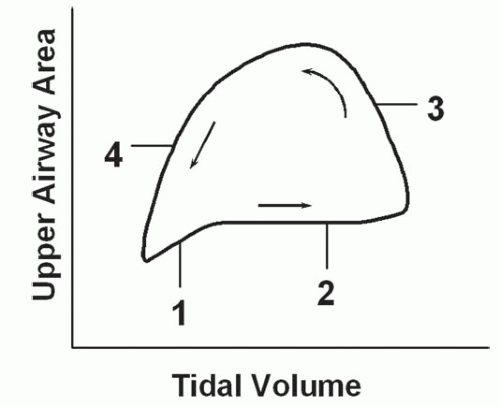 Figure 6-4 Diagram of the changes in upper airway area as a function of tidal volume during the respiratory cycle in an apneic patient. Airway narrowing is maximal at end-expiration. (See text for description of each phase.) |
MR studies using magnetic tagging stripes can be performed to track the motion of the soft tissues surrounding the airway, providing a more detailed visualization of the biomechanical effects of upper airway muscles in modulating airway caliber and shape. Furthermore, MR imaging can now be performed during electrode stimulation of specific muscles to further elucidate the role of various upper airway muscles in controlling the configuration of the airway (7).
The majority of CT and MR imaging studies, although not all, have shown a smaller upper airway in apneics compared with normals (Fig 6-3) (1). Airway narrowing is greatest in the retropalatal region in normals and OSA patients. CT and MR studies have shown that the upper airway in normals has a horizontal orientation (elliptical with the major axis in the coronal plane) in contrast to the apneic airway, which has an anteroposterior orientation (elliptical with lateral narrowing) (Fig. 6-3) (2,8). This lateral narrowing of the apneic airway is associated with increased thickness of the lateral pharyngeal walls. The basis for this increased thickness is unclear. Possible factors include fatty infiltration of the tissues, edema, muscle hypertrophy, or contracted muscles associated with radial and longitudinal airway collapse.
Furthermore, the total volume of parapharyngeal fat is greater in obese patients with apnea, contributing to the lateral narrowing (9, 10, 11, 12). The mechanism whereby obesity predisposes to sleep apnea remains controversial, however. Craniofacial bony abnormalities as well as increased soft palate and tongue volume have also been observed in OSA, further compromising upper airway size.
Continuous positive airway pressure (CPAP) is a highly effective noninvasive therapy for OSA, presumably by acting as a pneumatic splint. CT (13) and MR (14) imaging studies in normals and in patients with OSA during the application of varying levels of nasal CPAP, together with compliance modeling, have demonstrated maximum effective compliance along the lateral walls of the retropalatal segment of the airway (Fig. 6-5). Such studies again indicate that the lateral wall muscles play an important role in modulating upper airway caliber and appear most susceptible to collapse.
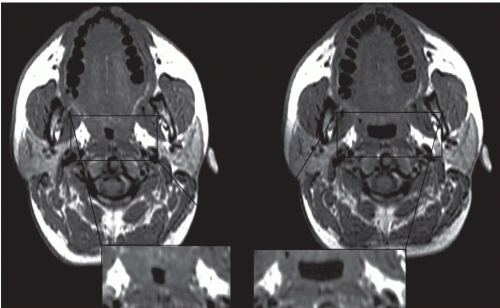 Figure 6-5 Effect of CPAP on the upper airway. Axial MR image at the retropalatal region in a normal subject with 0 cm H2O of CPAP (left) and CPAP of 15 cm H2O (right). Airway enlargement is demonstrated predominantly in the lateral dimension with the application of 15 cm H2O of CPAP. The anterior-posterior dimension is not significantly changed. |
The abnormal configuration of the upper airway in OSA patients may adversely affect the upper airway muscle activity and predispose the apneic to airway closure during sleep. In addition to dynamic upper airway imaging, studies performed during both wakefulness and sleep have led to further advancements in our understanding of the pathogenesis of sleep apnea. Imaging studies during sleep are particularly relevant because sites of upper airway narrowing during wakefulness do not exactly correlate with the site of obstruction during sleep. Several studies using conventional CT and/or EBCT have evaluated airway caliber in apneic patients during sleep. Horner et al. (15) demonstrated that airway obstruction during sleep was the result of posterior displacement of the soft palate and tongue as well as lateral displacement of the pharyngeal walls. Investigations using EBCT have demonstrated multiple sites of airway occlusion in the retropalatal and retroglossal regions during apneic events (16) Suto et al. (17) also demonstrated retropalatal airway closure in both normals and apneics during sleep using sagittal ultrafast MRI. State-dependent changes in airway caliber and surrounding soft tissue structures in normal subjects have been studied using MRI. The volume of the retropalatal airway was found to be reduced by 19% in normals during sleep (Fig. 6-6) (18). The narrowest portion of the airway was in the retropalatal region.
THE TRACHEA
From the upper airway, inspired gas is conducted via the trachea into the bronchial tree. The tracheal cartilages protect the anterior and lateral walls of the intrathoracic
trachea from collapse during expiration, although the posterior membranous portion is susceptible to the intraluminal tracheal pressure changes occurring with respiration. Using EBCT in normal subjects, Stern et al. (19) found that the tracheal airway surface decreased 35% from full inspiration to expiration (280 mm2 to 178 mm2). Normal bowing of the posterior membranous trachea is thus observed in expiration.
trachea from collapse during expiration, although the posterior membranous portion is susceptible to the intraluminal tracheal pressure changes occurring with respiration. Using EBCT in normal subjects, Stern et al. (19) found that the tracheal airway surface decreased 35% from full inspiration to expiration (280 mm2 to 178 mm2). Normal bowing of the posterior membranous trachea is thus observed in expiration.
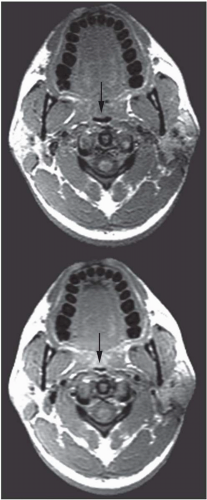 Figure 6-6 Retropalatal region of the upper airway in a normal subject during wakefulness (top) and sleep (bottom). Anterior-posterior and lateral airway narrowing is demonstrated during sleep. Thickening of the lateral pharyngeal walls occurs during sleep, reducing airway cross-sectional area. |
In tracheobronchomalacia, damage to the tracheal cartilage with resultant loss of the normal structural integrity of the airway wall leads to an increase in tracheal compliance and increased flaccidity. The latter is most evident during coughing or forced expiration. The coronal diameter of the trachea substantially exceeds the sagittal diameter, resulting in a so-called lunate configuration (Fig. 6-7).
Dynamic expiratory multislice CT scanning has now become a feasible alternative to bronchoscopy for the diagnosis of suspected tracheobronchomalacia (20). Such dynamic expiratory CT may demonstrate collapse of greater than 75% of the airway lumen. Some patients may even show complete collapse of the trachea. The marked bowing of the posterior tracheal wall, which may be focal or diffuse, gives rise to an oval or crescent shape (21).
In patients with chronic obstructive pulmonary disease (COPD), the high downstream resistance can result in excessive dynamic tracheal transmural pressure gradients. These may cause tracheal caliber changes of greater than 50% with expiration, despite normal intrinsic tracheal compliance. Thus, a decrease of greater than 70% in the cross-sectional area of the tracheal lumen in expiration should be used in diagnosing tracheomalacia (19).
Patients with COPD may also show a decrease in the amount of bronchial cartilage (22, 23, 24). This has been found to be most severe in segmental and subsegmental bronchi and more prevalent in the lower than the upper lobes. CT may thus demonstrate an exaggerated expiratory bronchial collapse in patients with COPD.
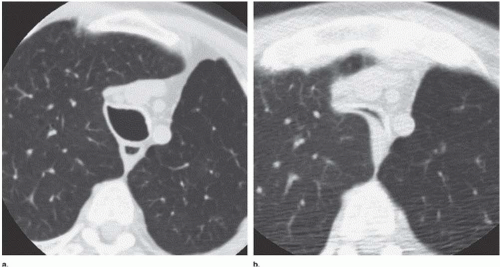 Figure 6-7 Tracheobronchomalacia. A 62-year-old man with chronic cough and progressive dyspnea. Left: CT scan of upper thoracic trachea shows an accentuated coronal diameter, also referred to as a “lunate” configuration. Right: Low-dose (40 mA) dynamic expiratory CT scan at a similar level shows excessive narrowing of the tracheal lumen, consistent with tracheobronchomalacia. (From Zheng J, Hasegawa I, Feller-Kopman D, Boiselle PM. Dynamic expiratory volumetric CT imaging of the central airways: comparison of standard dose and low-dose techniques. 2003 AUR Memorial Award. Acad Radiol 2003;10:719-724, with permission.) |
THE PROXIMAL BRONCHI
CT has clearly revolutionized our ability to image structural changes in the central airways. Using careful CT acquisition, display, and quantitative analysis methods, HRCT and multislice CT can now be used to image structural changes in the airways in response to variations in lung volumes as well as their responses to pharmacologic stimuli such as methacholine and β agonists (Fig. 6-8). Unlike conventional PFT measurements, which are limited to a global assessment of all the airways in aggregate, new imaging methods using CT can localize the relative contributions of various generations of the airways to the overall pulmonary physiology. Conventional spirometric lung function tests (e.g., forced expiratory volume in 1 second [FEV1] and forced vital capacity [FVC]) reflect only a gross average function of the airways and cannot evaluate regional or individual airway changes (25). The latter are likely important in understanding and treating disorders with impairment of airflow.
The ability to directly visualize airway responses to various stimuli and treatments as well as to changes in lung volume would be a great contribution to our understanding of airway pathophysiology. HRCT has become a most important diagnostic and investigational radiologic tool for the evaluation of airway function (Fig. 6-8). It has been used to measure dynamic changes in airway caliber in vivo that are not detectable by conventional global lung measurements such as airway and lung resistance (26,27). HRCT is uniquely capable of addressing questions regarding airway responsiveness in vivo that cannot be answered by other techniques (28, 29, 30, 31, 32, 33). However, the ability to study bronchial function with imaging is challenging. These imaging methods rely on accurate and reproducible measurements of airway luminal areas and wall thickness to be able to compare the airways before and after acute interventions (e.g., bronchoprovocation, bronchodilatation, response to changes in lung volumes) and to carry out longitudinal studies, such as in chronic airway remodeling in asthma.
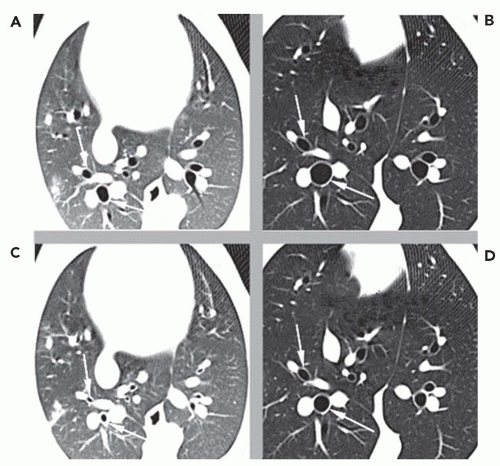 Figure 6-8 Airway reactivity. Matched HRCT scans from one dog at baseline (A and B) and after challenge with aerosolized methacholine (C and D). Images were acquired at low lung volume (FRC). (A and C) and at high lung volume (TLC) (B and D). The arrows show the same airways matched under all conditions. (From Brown RH, Mitzner W, Wagner E, et al. Airway distention with lung inflation measured by HRCT. Acad Radiol 2003;10:1097-1103, with permission.) |
Such measurements include airway luminal cross-sectional area and bronchial wall thickness. Obtaining such measurements accurately has been problematic for four principal reasons: (1) the measurements vary with the obliquity of the CT slice through airways; thus, images that are truly perpendicular to the local long axis of the airway throughout the entire branching central airways are required (Fig. 6-9); (2) normal physiologic changes in airway caliber occur during the respiratory cycle, so that imaging of the airways at select, reproducible lung volumes is necessary; (3) an accurate and reproducible means to define the inner
and outer edges of the airway walls is required; this can be challenging for the smaller, more peripheral airways at the limits of spatial resolution and even in the more central airways because of inherent blurring in the image reconstruction; and (4) the precise location (segment, generation) along the airway tree at which measurements are made must be specified, so that serial measurements of precisely the same airway are obtained repeatedly. Recent advances in CT scanner technology as well as dedicated image analysis tools have begun to address these issues.
and outer edges of the airway walls is required; this can be challenging for the smaller, more peripheral airways at the limits of spatial resolution and even in the more central airways because of inherent blurring in the image reconstruction; and (4) the precise location (segment, generation) along the airway tree at which measurements are made must be specified, so that serial measurements of precisely the same airway are obtained repeatedly. Recent advances in CT scanner technology as well as dedicated image analysis tools have begun to address these issues.
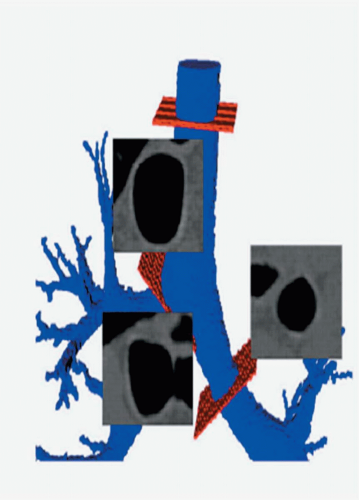 Figure 6-9 Regional airway geometric parameters are calculated from 3D images along planes selected to be perpendicular to the regional airway long axis. (From Hoffman EA, Reinhardt JM, Sonka M, et al. Characterization of the interstitial lung diseases via density-based and texture-based analysis of computed tomography images of lung structure and function. Acad Radiol 2003;10:1104-1118, with permission.) |
Initial airway reactivity studies with HRCT used 2D slices, analyzing those airways that by chance were felt to be imaged in true cross section (34). However, the in-plane resolution with a 2D-based analysis is insufficient to visualize airways with diameters smaller than 1 mm and to quantify changes in airway dimensions in airways smaller than 1.5 mm. Nonetheless, valuable results have been obtained (34, 35, 36) despite methodologic limitations that likely introduced errors in the measurements.
Current multislice helical scanners with increasing numbers of detector rows can now rapidly acquire image volumes through the entire lungs in less than 10 seconds. These datasets allow for subcentimeter image reformations along any plane as well as 3D rendering. With the submillimeter thick slices, image data can be converted to isotropic voxels, and the bronchial lumens segmented and reconstructed as a 3D volume. The latter allows the central axis through the airways to be determined, from which cross-sectional images that are truly perpendicular to the airway can be reformatted for measurements of the airway lumen and wall (Fig. 6-9) (20).
Multiple factors can influence the accuracy of CT airway measurements, including slice thickness, window level and width, field-of-view, and the reconstruction algorithm and the CT image reconstruction algorithm used. The current limit on spatial resolution is dependent on achievable pixel size and the intrinsic point spread function of the scanner. The wall thickness, measured morphometrically, of normal 1.5-mm diameter airways is 0.15 to 0.20 mm, just below the lower limit of current clinical CT scanners, which generally achieve a pixel size of 0.25 × 0.25 mm (37). This resolution will continue to improve with new multislice CT detector technology, and certainly spatial resolution more than 10 times this can be achieved with new micro-CT scanners. The smallest visible normal airways on which reasonably accurate measurements of lumen diameter can be made is in the range of 1.5 to 2.0 mm diameter, which is the upper size limit of small airways.
Several different image analysis approaches to obtaining airway cross-sectional measurements have been used. The method described by Wood et al. (38) showed a 20% overestimation of diameters for airways larger than 2 mm in diameter. The method of Amirav et al. (35), using the “full width at half maximum” principle, is relatively operator independent and achieved a coefficient of variation (SD/mean) of 4.4% for airways of 6.3-mm diameter and 16.6% for 1.3-mm diameter airways. Small airways have very thin walls, typically on the order of 10% to 15% of inner diameter (39). The full width at half maximum method can yield inaccurate measurements for these very small, thinwalled airways.
More recently, sophisticated model-based methods for accurate and automated edge detection and measurements of the airway walls have been developed (40, 41, 42, 43). Reinhardt et al. developed an improved, more accurate edge detection program that takes into account the point spread function of the particular scanner as well as the slice selection and reconstruction algorithm used and applies a model-based deconvolution to account for blur in the scanning process (41,42). The method is accurate for a wide range of relevant airway sizes down to 1 to 15 mm inner diameter. Inner and outer airway wall borders can be detected to subvoxel resolution (41).
An airway analysis algorithm capable of fully automated segmentation of the first five to six airway generations has been described (39). After segmentation, the program executes skeletonization and branch point localization to automatically identify the 3D center line of individual branches (Fig. 6-10). The program can match two airway
trees with 150 to 200 branch points in less than 2 seconds. It has been validated with phantom and in vivo scans with a high degree of agreement between the automated computer method and human experts.
trees with 150 to 200 branch points in less than 2 seconds. It has been validated with phantom and in vivo scans with a high degree of agreement between the automated computer method and human experts.
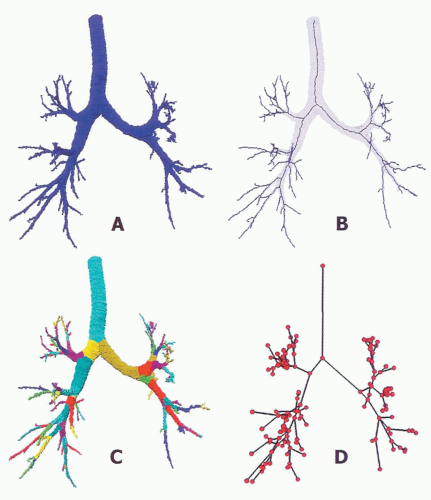 Figure 6-10 A to D: 3D airway analysis algorithm. A: Adaptive region growing-based airway segmentation. B: Extraction of center lines, topologically and geometrically correct thinning. C: Partitioning segmented tree via isotropic label propagation. D: Mathematical graph representation of the individual tree. The tree shown in D is stored in an XML file, which provides associated measures for each part of the tree. These measures include segment length, branch angles, regional luminal area, wall thickness, segment luminal volume, segment surface area, regional minimum diameter, and the diameter of the orthogonal as well as regional maximum diameter. (From Hoffman EA, Reinhardt JM, Sonka M, et al. Characterization of the interstitial lung diseases via density-based and texture-based analysis of computed tomography images of lung structure and function. Acad Radiol 2003;10:1104-1118, with permission.) |
Furthermore, a method to automatically label the various portions of the airway tree has been established (Fig. 6-10). The algorithm can be applied to multiple scans of the same subject to track changes in airway dimensions along an airway path, in addition to changes in airway dimensions with varying lung volumes.
Scanning at controlled, specified lung volumes is critical to match and compare exactly the same airways on serial studies of an individual and to eliminate lung-volume dependent changes in airway lumen and wall caliber. Such spirometric control of the scans has not been widely used. Intrascan inconsistencies may contribute to the apparent “heterogeneity” in airway lumen and wall measurements made throughout an individual bronchial tree.
Recently, a pneumotachometer-based CT lung volume controller has been developed (Fig. 6-11) (44). The device monitors the volume of expired gas and can trigger a highfrequency balloon valve to occlude the airway and hold the subject’s lung volume at a fixed percent of the vital capacity, or the subject can relax against various levels of positive endexpiratory pressure (PEEP) and scanning can be performed during prolonged expiratory pauses (42). The pneumotachometer signal then also initiates the CT scan acquisition (45,46). Other approaches to monitoring lung volumes in connection with CT gating have included mouth-based air flow methods using an ultrasound probe, turbine, and a chest wall-based inductance plethysmograph (39).
Moreover, respiration is a dynamic process, and many pathophysiologic disorders in lungs manifest themselves only during active breathing. Examples are dynamic compression of the airways and frequency dependence of compliance. Furthermore, many dyspneic patients have difficulty breath holding. Ideally for physiologic studies of the airways, full 3D helical imaging through the lungs at multiple phases of the respiratory cycle is desirable, analogous to CT cardiac imaging with retrospective gating. The latter uses the speed and reproducibility of the cardiac cycle to build up images at multiple phases from portions of successive heart beats. This is not yet possible for respiration, however, given the much greater length of the respiratory cycle, the greater cycle-to-cycle variations in respiration compared with cardiac motion, and radiation dose considerations. Nonetheless, new strategies for multiphasic helical scanning to capture several phases of the respiratory cycle have recently been demonstrated (Fig. 6-11). Specifically, Hoffman et al. (39) have described a scheme using a four-slice multidetector CT scanner in which the lungs are scanned at two points in the respiratory cycle while moving the table location by a combined thickness of two of the four slices between each gated scan acquisition. The process is then repeated for the two volume locations with sequential respiratory cycles until the entire lungs are imaged.
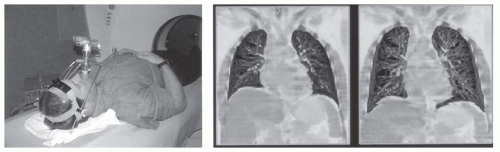 Figure 6-11 By use of a pneumotachometer or other lung volume-tracking device (left image) to follow respiration, axial scans can be gated to specific points within the respiratory cycle. Using multislice CT, a set of axial sections are obtained at multiple points within a respiratory cycle and then the table is advanced to acquire the adjacent set of slices at the same lung volumes of the next respiratory cycle. Two images at right show a volume rendering of the 3D lung and a coronal section sampled from the center of the stacked image data set. Note that every four slices used to produce these 3D images were from a different respiratory cycle than the adjacent four slices, and yet anatomy is depicted as being continuous from apex to base of lungs. (From Hoffman EA, Reinhardt JM, Sonka M, et al. Characterization of the interstitial lung diseases via density-based and texture-based analysis of computed tomography images of lung structure and function. Acad Radiol 2003;10:1104-1118, with permission.) |
Despite these technical advancements, most CT studies of airway reactivity to date have relied on more traditional 2D HRCT methods (33,35,37,47, 48, 49). These CT studies of airway reactivity are providing new information regarding the pathophysiology of asthma, including the sites of bronchoconstriction during acute episodes as well as the structural and functional changes associated with airway remodeling resulting from the inflammatory changes of chronic asthma.
Asthma is characterized by reversible obstruction of airways owing to bronchial hyperresponsiveness associated with airway inflammation involving both proximal and distal airways (50). It is a chronic inflammatory condition associated with widespread but variable airflow obstruction that is often reversible (20). Airway reactivity, the hallmark of asthma, refers to the ability of the airways to reversibly change their diameter in response to stimuli (20).
HRCT findings involving the airways in asthmatics are variable and frequently subtle but include airway wall thickening, bronchial narrowing, bronchiectasis, centrilobular opacities, and mucoid impaction (50). In addition, mosaic perfusion and air trapping are commonly present (51, 52, 53, 54, 55, 56, 57, 58, 59). The majority of patients with chronic asthma have bronchial wall thickening (51,52,57,60,61). Airway wall remodeling, which occurs in chronic asthma and likely is the result of chronic inflammation, is associated with structural changes in the airway walls. These include subepithelial fibrosis, mucous gland hyperplasia, and smooth muscle hypertrophy and hyperplasia (20,61,62).
Okazawa et al. (63) measured bronchial wall thickness and the site of methacholine-induced bronchoconstriction in asthmatics versus controls using HRCT. The asthmatics showed wall thickening. Following methacholine, there was significant heterogeneous bronchoconstriction found in all size airways, with the greatest change observed in airways
2 to 4 mm in diameter. The bronchial wall area normally decreases on bronchoconstriction; however, this decrease in wall thickness is not seen in the airways of asthmatics. Similar findings were also observed by Kee et al. (64).
2 to 4 mm in diameter. The bronchial wall area normally decreases on bronchoconstriction; however, this decrease in wall thickness is not seen in the airways of asthmatics. Similar findings were also observed by Kee et al. (64).
CT studies of dynamic changes of airway narrowing and hyperresponsiveness have demonstrated spatial heterogeneity in response, with maximum narrowing in intermediate-sized airways in animal models (2- to 6-mm diameter in dogs) and human subjects (2- to 4-mm diameter) following carbachol challenge and lung deflation. In addition, airway wall area decreased with narrowing in response to pharmacologically induced airway smooth muscle contraction (37).
Airway reactivity studies in pigs have demonstrated that HRCT can detect changes in peripheral (<2 mm) airways challenged with methacholine before such changes are reflected in more conventional PFTs (35). HRCT airway reactivity studies in human asthmatic subjects have shown that the central airways have a greater response to methacholine than do the peripheral airways (Fig. 6-12); conversely, the peripheral airways of asthmatics show greater response to β agonists (34,36,64a). These results are consistent with a higher density of cholinergic receptors in the central airways than in the peripheral airways and a greater prevalence of β receptors peripherally. The data, when compared with previous studies showing heterogeneity in response throughout various locations in the bronchial tree of asthmatics, emphasize the need for careful, objective computer-based quantification of airways together with carefully developed imaging protocols controlling for lung volumes during scan acquisition to ensure that the same airways are compared preintervention and postintervention (34,41,65).
A study by Beigelman-Aubry et al. (49) using spirometrically controlled CT at 65% total lung capacity (TLC) showed that patients with mild intermittent asthma have baseline bronchoconstriction compared with normal subjects. Furthermore, inhalation of salbutamol following a methacholine challenge resulted in bronchial cross-sectional areas comparable to those of controls as well as above their own baseline values. This baseline bronchoconstriction may be the result of increased muscle tone or impaired stretching.
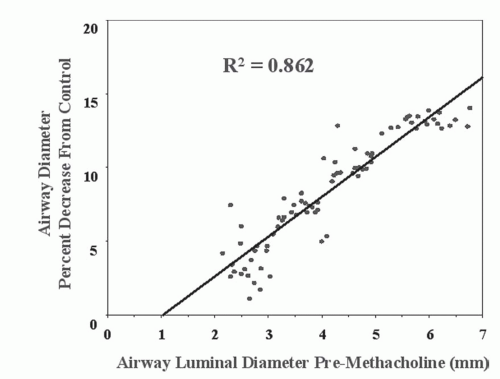 Figure 6-12 Airway reactivity using quantitative HRCT. Graph of airway narrowing in response to methacholine challenge as a function of baseline airway cross-sectional diameter in asthmatic subjects. Note linear relationship between the percent decrease in airway diameter with methacholine and the baseline airway diameter, indicating greater bronchoconstriction in the larger (central) airways. (Courtesy of Eric A. Hoffman, PhD, University of Iowa.) |
Asthma may be related to the inability to sufficiently distend airways with lung inflation. This inability may be secondary to increased stiffness of smooth muscle preventing distension, airway remodeling with collagen deposition (66), or decreased distensibility resulting from air trapping and leading to increased lung volume at functional residual capacity (FRC). Airways normally dilate with inspiration and constrict in response to inhaled stimuli such as methacholine and histamine. In healthy subjects, deep inspirations to TLC have been shown to have both a bronchoprotective effect (prevention of subsequent spasmogen-induced bronchoconstriction) and a bronchodilator effect (25,67, 68, 69). These effects of deep inspiration, however, are impaired in asthmatic patients compared with healthy subjects.
HRCT studies have shown that after constriction induced by methacholine, a deep inspiration resulted in bronchodilation in normals but further bronchoconstriction in asthmatics (27). In asthmatics with severe airflow obstruction, the ability to distend the airways on HRCT with deep inspiration is significantly decreased.
These studies suggest that HRCT measurements of airway distensibility in human subjects may provide insights into the pathophysiology, progression of disease, and response to therapy in asthmatic patients (25).
THE PERIPHERAL AIRWAYS
Despite dramatic developments in HRCT and helical CT for anatomic imaging of the lungs, radiologic techniques including CT cannot directly resolve the individual distal airways and airspaces at the gas exchange level in the lung parenchyma. However, functional imaging techniques are available to visualize ventilation and gas exchange in the lung parenchyma. This has traditionally been performed with nuclear medicine techniques. More recently, however, MR- and CT-based methods have been developed that have greatly expanded our ability to image a variety of functional parameters related to ventilation. These exciting methods, many of which are still under development, provide quantitative imaging of regional lung function with high temporal and spatial resolution.
NUCLEAR MEDICINE
Scintigraphy has been the traditional functional imaging study to evaluate perfusion and ventilation and V/Q. It is sensitive, although nonspecific, with low spatial and
temporal resolution. Inhaled radionuclide gases, including 133Xe, 127Xe, and 81Kr, are distributed through the smaller airways. Aerosols such as technetium 99m diethylenetriamine pentacetic acid (DTPA) have particle sizes of 0.1 to 3 μ (70) but suffer from deposition in the larger central airways (71). An ultrafine dispersion of Tc-99m-labeled carbon particles (Technegas), with particle sizes of approximately 0.005 μ (72), has deeper penetration but low anatomic resolution for the distal airways.
temporal resolution. Inhaled radionuclide gases, including 133Xe, 127Xe, and 81Kr, are distributed through the smaller airways. Aerosols such as technetium 99m diethylenetriamine pentacetic acid (DTPA) have particle sizes of 0.1 to 3 μ (70) but suffer from deposition in the larger central airways (71). An ultrafine dispersion of Tc-99m-labeled carbon particles (Technegas), with particle sizes of approximately 0.005 μ (72), has deeper penetration but low anatomic resolution for the distal airways.
The resolution of the nuclear medicine studies has been improved with SPECT, which can provide cross-sectional images as well as quantification of ventilation, perfusion, and V/Q (73,74). Using a three-headed SPECT camera with a continuous repetitive rotating mode, tomographic images at equilibrium and during wash-out at 30-second intervals for 5 minutes can be acquired using 133Xe gas. The regional wash-out is quantified by calculating the half-time (T1/2) and mean transit time (MTT) (75). The SPECT data are reconstructed into a 3D image with a color surface-rendering technique. A 3D fusion image of the 3-minute wash-out image is embedded within the equilibrium image, the latter delineating the lung contours, to display the size, extent, and distribution of areas of abnormal gas trapping. These can be further quantified using the T1/2 and MTT kinetic parameters. This technique has been applied to evaluate the lungs of patients with emphysema before and after lung volume reduction surgery (LVRS) (76,77), as well as in asthmatic patients pretherapy and posttherapy for asthma and correlated with FEV1 (77).
Three-dimensional surface displays of dynamic 133Xe ventilation and Tc-99m MAA SPECT perfusion have also been performed in patients pre-LVRS and post-LVRS (78). Furthermore, respiratory-gated Tc-99m Technegas SPECT ventilation and SPECT perfusion functional scans have been reliably coregistered with CT images. These coregistered SPECT-CT images have allowed accurate identification of the location and extent of V/Q deficits related to the underlying CT anatomy, thus coupling the functional and structural abnormalities (79).
Further refinements in V/Q imaging have been made possible with PET, with a resolution of 5 to 10 mm, although temporally slow (approximately 30 seconds) relative to the respiratory cycle (80,81). After intravenous bolus injection during a breath hold and subsequent wash-out from the lungs on resumption of breathing, 13N2 PET has been able to show the topographic distribution of regional perfusion as well as regional-specific alveolar ventilation (ventilation per unit alveolar gas volume) and alveolar V/Q ratios (82,83). When these V/Q measurements are combined into a whole-lung distribution, they have been validated against global arterial blood gases (ABGs). Three-dimensional PET data in sheep before and after methacholine bronchoconstriction and pulmonary embolism have shown excellent correlation with ABGs and demonstrate V/Q heterogeneity in the lungs at length scales smaller than the spatial resolution of the imaging method (83). The PET V/Q work has been largely limited to investigational studies.
With regard to other airway applications of nuclear medicine techniques, [18F]-fluorodeoxyglucose-PET (18FDG-PET) has been used in imaging of disease activity in patients with pneumoconiosis, sarcoid, asthma, and infection (84). Pharmaceutical compounds can be labeled with radioisotopes to study their distribution of deposition and pharmacokinetics. New compounds can also be mixed with Tc-99m-DTPA aerosols, assuming they have similar particle deposition (85,86). PET (11C) labeling of inhalational pharmaceuticals, such as for the treatment of asthma, also has been used to show the distribution of the inhaled agents in connection with the design and use of these drugs (87,88). The agents have also been labeled with 18FDG PET (89).
PET has also been used to label the β-adrenoceptors in the lung to quantify the receptors and correlate their density with the bronchodilator response to β-agonist therapy (90,91).
Beyond the classical ventilation and perfusion agents, a wide range of radiopharmaceutical agents can be traced in the lungs. These have the potential to label the basic components involved in inflammation as well as in the development of pulmonary fibrosis (92). 18FDG PET has also been used on a limited basis to image allergen-invoked airway inflammation in atopic asthma (93). PET imaging using a fluorinated analog of proline amino acid (cis-4-[(18)F] fluoro-L-proline) has been used as a label of active pulmonary fibrosis in a rabbit model of experimental silicosis (94).
Molecular Imaging
The most exciting new imaging applications for the study of the airways are those of so-called molecular imaging. A new generation of imaging devices now makes it possible to obtain structural and functional images of the lungs in small animals, including mouse and rat models. These include micro-PET; micro x-ray CT; high-field, small-bore MR scanners; highly sensitive cooled charge-coupled device (CCD) cameras for bioluminescence and fluorescence optical imaging, as well as advances in ultrasound (95). These can be used to study not only ventilation and perfusion but also lung inflammation and even gene transfer. Fusion of images such as PET and CT allow for structure-function and function-function relationships to be studied on a regional basis. These emerging techniques have tremendous potential for studying lung biologic structure and function from the macroscopic down to the molecular level.
Recently developed micro-PET instruments enable PET imaging in mouse models and small animals with spatial resolution to 2 mm. The technique provides a uniquely powerful means to monitor activity of the inflammatory process in the lung. A promising new approach to imaging airway diseases such as asthma is the integration of the functional-metabolic data obtained from PET with the anatomic airway data acquired from CT. Micro-CT units
can now scan the lungs at resolutions down to the 10 μ range. Such combined PET-CT imaging studies could be used to spatially map the distribution of active inflammation along the airway.
can now scan the lungs at resolutions down to the 10 μ range. Such combined PET-CT imaging studies could be used to spatially map the distribution of active inflammation along the airway.
An example of this emerging molecular imaging of the airways is the imaging of reporter gene expression in the lungs with PET. Pulmonary gene transfer has been carried out in rats via the intratracheal instillation of an adenoviral vector containing a fusion gene that encodes for mutant Herpes simplex virus type-1 thymidine kinase and an enhanced green fluorescent protein. A PET-labeled substrate for the mutant kinase is used (96). PET is able to image the magnitude and spatial distribution of the transgene expression and can thus provide useful information about the efficacy of various gene transfer delivery strategies within the lung (97,98).
CT IMAGING: AIR AS A CONTRAST AGENT
CT has a unique characteristic whereby changes in air content in the lung due to ventilation result in a corresponding change in regional CT density as well as lung volume. Thus air itself can be used in CT as a contrast agent for indirect measurements of ventilation.
Regional air content can be quantified using CT attenuation values (34,99). The lung can be regarded as comprising structures equal in density to only air or water (the density of lung tissue and blood, at 1.055, being very close to that of water). Simplistically, if a voxel with 100% air measures -1,000 HU, then a voxel measuring -600 HU would be considered to contain 60% air (40% tissue). More precisely, the following equation can be used to calibrate lung density values to quantify the regional content of air in the lung:
Voxel % air content = ([1 − CTx − CTair]/[CTwater − CTair]) × 100
where CTx = original grayscale of lung voxel to be converted; CTair = grayscale value to voxels with a region of known 100% air content (lumen of trachea or proximal bronchi); CTwater = region of known 100% “water” (chamber of heart or lumen of great vessels).
With the additional use of a bolus injection of a radiopaque contrast agent together with rapid scanning, it is also possible to determine the percentage of blood and tissue within the “water” compartment in the region of interest.
Using the previous equation without contrast injection, a voxel in the lung periphery can be assigned a percent air content value, with the remainder of the voxel comprising lung tissue and blood.
The majority of CT studies have used the changes in regional lung density at various phases of inspiration to infer regional ventilation and density changes in expiration to evaluate gas trapping.
CT Volumetry
Perhaps the most direct application of using air as a contrast agent for CT is CT-based measurement of lung volumes, or so-called CT volumetry. Lung volumes have traditionally been measured by spirometry with body plethysmography and helium dilution. None of these conventional global methods, however, can provide volume information for specific sub-lung regions. CT volumetry is based on the current ability to scan the entire lungs at a specified state of lung inflation monitored by spirometry (92). Dedicated lung extraction software using automated segmentation can now be used to accurately and reproducibly derive lung volumes, and these measurements compare well with plethysmographic measurements (100,101). However, in one study inspiratory helical CT consistently underestimated TLC by 15% (100), and expiratory helical CT overestimated residual volume (RV) by almost 1 L. This may be related to supine positioning for CT versus sitting erect for PFTs. Further refinements using 3D reconstructions have been able to reduce errors to approximately 3% (102). Unlike conventional PFTs, CT can provide volume measurements of individual lungs and even lung regions (103).
Determination of changes in small areas of the lung with varying degrees of inflation is more challenging, however, and relies on the ability to track accurately the motion of individual points in the lung. This is now becoming possible using new nonrigid image registration analysis software programs, which are discussed further in the section on pulmonary mechanics. Volumetry of ventilated airspaces can also be obtained via MR hyperpolarized gas imaging, also discussed later.
Inspiratory-Expiratory HRCT
The use of lung density changes in different phases of respiration has had its primary application in inspiratory-expiratory HRCT scans, which have become the most commonly used CT functional imaging study in clinical practice. Expiratory HRCT is discussed elsewhere in this text, particularly as it relates to small airway disease.
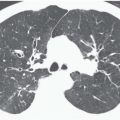
Expiratory HRCT is a highly useful and relatively simple method to detect air trapping, a hallmark of small airway obstruction (104). (Gas trapping can also be caused by regional abnormality in pulmonary compliance.) On expiration the attenuation of normal lung increases as a consequence of decreased gas volume, whereas regions of air trapping remain essentially unchanged in density (Figs. 6-13 and 6-14). Likewise, the area (or volume) of normal lung decreases on expiration, while those regions with air trapping remain unchanged in size (56,105, 106, 107, 108). Normally, the dependent lung regions show the greatest expiratory increase in density (109).
Constriction of pulmonary vessels can also be seen within the areas of decreased lung density. Bronchiolar obstruction causes hypoxic vasoconstriction, which results in areas of decreased lung attenuation. These low-attenuation regions
can be patchy or diffuse and are generally poorly marginated but can have well-demarcated geographic outlines (50). Redistribution of blood flow leads to increased attenuation in the normal adjacent areas of lung. The appearance of this patchwork variation in CT density is referred to as a “mosaic attenuation” pattern (110); corresponding regional differences in vessel size constitute a “regional perfusion” pattern. Expiratory CT often can differentiate bronchiolar from infiltrative or vascular causes of a mosaic attenuation pattern (e.g., chronic thromboembolic disease) (111), because the mosaic attenuation is accentuated on expiration in cases of bronchiolar (small airway) disease. The findings of air trapping may be confused with emphysema in patients with severe obstructive airway disease, because the hypoxic vasoconstriction leads to decreased lung attenuation on both inspiratory and expiratory HRCT scans (53,57).
However, unlike in emphysema, the decreased vessels in hypoxic vasoconstriction are not distorted (50).
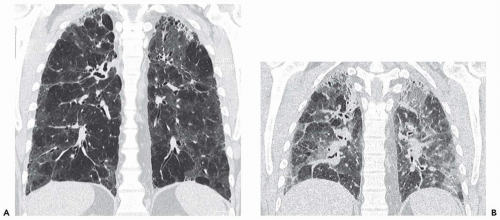 Figure 6-13 A: Coronal inspiratory HRCT image acquired during a breath hold using a 16-row detector multislice CT scanner. Mosaic attenuation pattern is present, in addition to upper lobe scarring in this patient with sarcoidosis. B: Coronal expiratory HRCT scan demonstrates multiple regions of gas trapping. The full volume and distribution of gas trapping can be determined. |
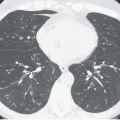
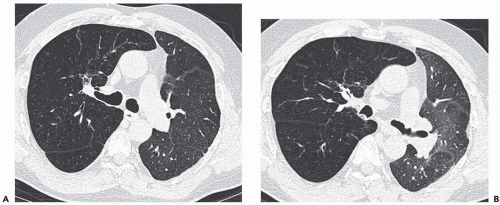 Figure 6-14 A and B: Two expiratory HRCT images acquired dynamically during a forced exhalation. The patient is post-left lung transplant for emphysema. Serial images were acquired at the same location in the midlungs, (A) at the start and (B) at the end of expiration. Gas trapping is evident in the transplanted left lung, a manifestation of bronchiolitis obliterans resulting from chronic rejection. Marked diffuse air trapping is also present in the emphysematous native right lung. There is resulting expiratory shift of the mediastinum to the left. |
In 50% to 80% of normal subjects with normal PFTs, expiratory HRCT may show one or more areas of air trapping, often limited to one or a few adjacent secondary pulmonary lobules (107,112). These occur predominantly in the dependent parts of the lower lobes (113) and are seen more frequently with increasing age and smoking (107,113). Air trapping is generally considered abnormal when it affects a volume of lung equal to or greater than a pulmonary segment (114) and particularly when it involves nondependent areas of the lung.
Related posts:
Stay updated, free articles. Join our Telegram channel

Full access? Get Clinical Tree


