Small Airway Diseases


Small Airway Diseases


Small airway disease is defined as a pathologic condition in which the small conducting airways are affected either primarily or in addition to alveolar or interstitial lung changes. For the pathologist, small airway disease has the same meaning as bronchiolitis, a nonspecific term used to describe inflammation of the membranous and respiratory bronchioles. Bronchiolitis can be classified according to its proved or its presumed etiology, the pulmonary or systemic diseases with which it is often associated, or its histologic features. The diagnosis of small airway disease is challenging for the clinician, because it has no pathognomonic clinical or functional features. The chest radiograph is normal or may show nonspecific findings. The highly variable radiographic abnormalities include hyperinflation and peripheral attenuation of vascular markings, peribronchial wall thickness, perihilar linear opacities, atelectasis, and airspace consolidation. However, there is considerable interobserver and intraobserver variability in interpretation of the radiographs and there is no real correlation between the clinical severity of the disease and the degree of radiographic changes. Thin-section computed tomography (CT) has become the best imaging technique for the assessment of the small airways and is clearly the radiologic method of choice for investigating a patient suspected on clinical, functional, or radiographic features of having bronchiolitis. CT findings are frequently suggestive of the diagnosis of small airway disease and are frequently the first indication of the presence of small airway pathology. In addition, CT provides the most reliable assessment of both the extent and the severity of disease. It is a reliable and easily repeatable technique for assessing response to therapy, avoiding the need for successive histologic evaluations. Nowadays the use of multidetector CT technique allows one to combine volumetric acquisition over the entire length during a single breath hold with the use of thin collimation. In addition, postprocessing techniques may contribute to improving the visualization of the characteristic findings of small airway disease and to assessing the extent of the lesions.


ANATOMY OF THE SMALL AIRWAYS

Small airways are those that do not contain cartilage and glands. They are called bronchioles (1). The bronchioles include two categories, membranous (lobular and terminal) bronchioles and respiratory bronchioles. The secondary pulmonary lobule, described by Miller (2) as the smallest portion of the lung that is surrounded by connective tissue septa (interlobular septa), is ventilated by a lobular bronchiole measuring approximately 1 mm in diameter and 0.15 mm in wall thickness (Fig. 5-1). The lobular bronchiole enters the core of the lobule accompanied by its homologous pulmonary artery and divides into 3 to 12 terminal bronchioles, according to the size of the lobule, at approximately 2-mm intervals (Fig. 5-2). The terminal bronchioles are found between the sixth and twenty-third generations of branching (3) and have an internal diameter of approximately 0.6 mm; their length varies from 0.8 to 2.5 mm (Fig. 5-3) (4,5). The walls of membranous bronchioles contain three compartments: (1) an inner wall consisting of epithelium, basement membrane, lamina propria, and submucosa, (2) a smooth muscle layer, and (3) an outer wall consisting of the connective tissue between the muscle layer and the surrounding parenchyma (6). The wall thickness varies between 0.05 and 0.1 mm. This is below the ability of CT to image, and as a result, normal airways with a diameter of less than approximately 1.5 mm cannot be identified on thin-section CT.

The terminal bronchioles and their accompanying homologous centrilobular pulmonary arterial branches and lymphatic vessels are “core structures,” being clustered near
the center of the secondary pulmonary lobule. Between these core structures and the interlobular septa, numerous alveolar spaces, capillaries, and respiratory bronchioles are present. This accounts for the characteristic centrilobular distribution of bronchiolar abnormalities detected on thin-section CT scans (7, 8, 9).


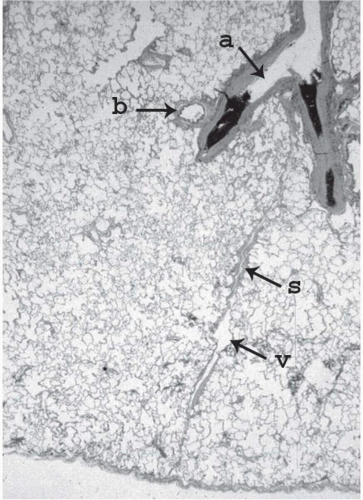
Figure 5-1 Histologic appearance of a secondary pulmonary lobule. The lobular bronchiole (b) is accompanied by its homologous pulmonary artery filled with a clot (a). The interlobular septum (s) contains the interlobular vein (v).


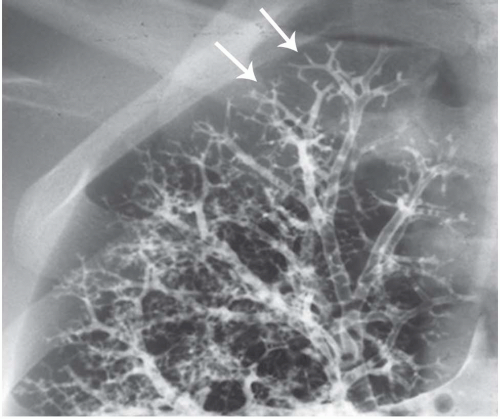
Figure 5-2 Normal bronchogram of the right bronchial tree targeted on the right upper lobe. The arrows show the normal appearance of lobular and terminal bronchioles.


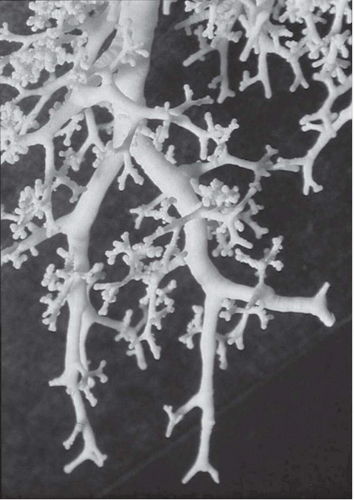
Figure 5-3 Bronchial cast from a human lung specimen showing the origin and divisions of several terminal bronchioles. (Courtesy of Ewald Weibel.)

The terminal bronchioles are purely conducting airways, and no alveoli arise directly from them. Each of the terminal bronchioles divides into several generations of respiratory bronchioles. Conversely, respiratory bronchioles have gas-exchanging alveoli arising from their walls. They communicate through alveolar ducts within numerous alveolar sacs (Fig. 5-4) (3).


PATHOLOGY

Initially bronchiolitis is an inflammatory disorder involving the bronchiolar wall, occurring as a reaction to an injury (10). The injury can be focal or multifocal or may affect all the bronchioles in both lungs. The injury can have a known cause or may be the result of an unknown trigger. The different causes of bronchiolitis are listed in Table 5-1. Although an etiologic classification may be useful when bronchiolitis is suspected, the simplest scheme for classifying bronchiolar disease is based on the histologic pattern, which shows a better
correlation with the clinical and radiologic manifestations of disease. The histologic classification also shows better correlation with the natural history of the disease and its response to therapy.


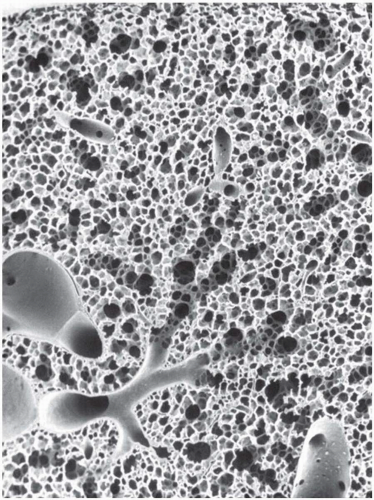
Figure 5-4 Low-power scanning electron microscopy of a normal lung specimen showing the origin and the divisions of terminal and respiratory bronchioles down to the alveolar ducts and sacs. (Courtesy of Ewald Weibel.)


TABLE 5-1 ETIOLOGIES AND CLINICAL CONDITIONS ASSOCIATED WITH BRONCHIOLITIS


Inhalation of gases, fumes, and dusts


Infection (e.g., viruses, Mycoplasma pneumoniae, Chlamydia species, Aspergillus fumigatus)


Irradiation


Aspiration


Drugs and chemicals


Organ transplantation


Bone marrow


Heart-lung


Lung


Connective tissue disease


Rheumatoid disease


Sjögren’s syndrome


Systemic lupus erythematosus


Dermatomyosis


Progressive systemic sclerosis


Others


Hypersensitivity pneumonitis


Autoimmune diseases


Chronic eosinophilic pneumonia


Neoplasia (carcinoid tumor, neuroendocrine cell hyperplasia)


Bronchiolitis can be subdivided into acute and chronic forms. Acute bronchiolitis usually results from processes that cause bronchiolar injury over a short period of time, such as viral infection or the inhalation of toxic gases. The lesions involve mainly the epithelium; necrosis and desquamation are followed by exudation, fibrin, inflammatory cell infiltration, and granuloma formation and subsequently by resorption and scarring. Chronic bronchiolitis is typically associated with prolonged injury and is characterized by bronchiolar infiltration by mononuclear cells typically followed by the development of a fibrotic process.

The current pathologic classification of bronchiolitis is based on three main histologic patterns: cellular bronchiolitis, bronchiolitis obliterans with intraluminal polyps, and obliterative bronchiolitis (10, 11, 12, 13, 14). Although two or three types of bronchiolitis may coexist in an individual, one pattern usually predominates in a given condition.

Besides bronchiolitis, the small airways may be involved indirectly. Changes adjacent to the bronchioles, such as lung fibrosis, and abnormalities in the bronchiolar wall, such as granulomas, can also cause distortion of the bronchiole and narrowing of the lumen (15). This phenomenon is particularly well illustrated in sarcoidosis.


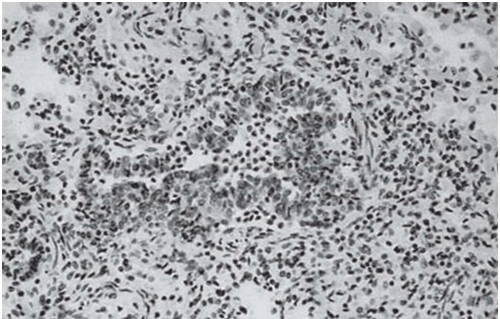
Figure 5-5 Cellular bronchiolitis. Surgical biopsy (×20) with immunohistochemical labeling. Inflammatory bronchiolitis caused by respiratory syncytial virus infection.


Cellular Bronchiolitis

The histologic pattern of cellular bronchiolitis is characterized by inflammatory cellular infiltrates involving both the bronchiolar lumen and walls with some degree of fibrosis. According to the predominant cell type and the clinical presentation, acute or chronic, the classification most commonly includes infectious bronchiolitis (Fig. 5-5), respiratory bronchiolitis, follicular bronchiolitis, panbronchiolitis, aspiration bronchiolitis, bronchiolitis associated with hypersensitivity pneumonitis, and asthma. The pattern of cellular bronchiolitis may regress under specific or antiinflammatory treatment or may be followed by bronchiolitis obliterans or obliterative brochiolitis. (16).


Bronchiolitis Obliterans with Intraluminal Polyps

The histologic pattern of bronchiolitis obliterans with intraluminal polyps is characterized by the presence of granulation tissue polyps or plugs of fibroblastic tissue extending from the areas of epithelium damage into the lumens of respiratory bronchioles, resulting in partial, or occasionally complete, obstruction. Although the pattern may be the only abnormality present in the lungs, in most patients it is associated with similar epithelial injury and fibroblastic reaction in the more distal airspaces (Fig. 5-6). Mild interstitial chronic inflammation may be present and lung architecture is preserved. In such cases, bronchiolitis occurs in association with pneumonitis, and as a result the term bronchiolitis obliterans with organizing pneumonia (BOOP) is frequently used (17). Idiopathic BOOP is currently classified among the idiopathic interstitial pneumonias and is called cryptogenic organizing pneumonia (COP). Secondary BOOP is still regarded as an airway disease related to different types of injury (infection, drug toxicity, aspiration, irradiation, toxic fume inhalation) or associated with different conditions (collagen tissue disease, Wegener’s granulomatosis, Behçet’s disease, hypersensitivity pneumonitis, organ transplantation, tumors, infarction) (18, 19, 20, 21, 22, 23, 24, 25, 26, 27, 28, 29, 30, 31, 32). BOOP is responsive to steroids, with regression of the abnormalities in most patients.


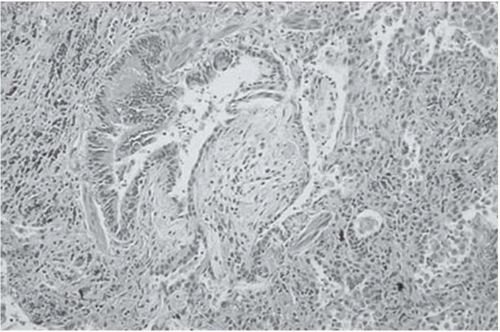
Figure 5-6 Bronchiolitis obliterans with intraluminal polyps. Surgical biopsy (×20, hematoxylin and eosin) obliteration of the lumen of a respiratory bronchiole by a fibroblastic plug floating in the lumen. The same type of fibroblastic reaction is also present in more distal airspaces (organizing pneumonia).


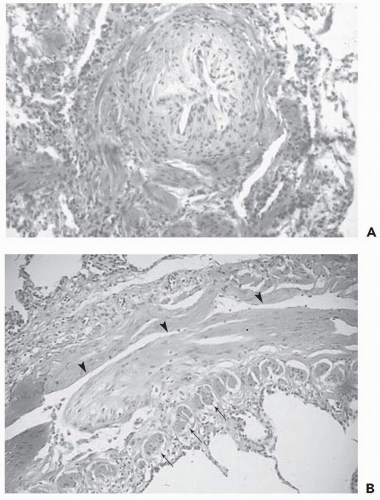
Figure 5-7 Obliterative (constrictive) bronchiolitis. Surgical biopsy (×20, HE). A: Section perpendicular to a terminal bronchiole showing a concentric narrowing of the bronchiolar lumen by subepithelial fibrosis. B: Section along the long axis of another terminal bronchiole showing the longitudinal extent of the subepithelial fibrosis. Arrows show the section of the smooth muscle fibers in the bronchiolar wall. Arrowheads show the narrowed bronchiolar lumen.


TABLE 5-2 CONDITIONS ASSOCIATED WITH OBLITERATIVE BRONCHIOLITIS


Infection (Table 5-3)


Childhood viral infection (e.g., adenovirus, respiratory syncytial virus)


Infection in adults and children (e.g., Mycoplasma pneumoniae, Pneumocystis carinii in AIDS patients, endobronchial spread of tuberculosis, bacterial bronchiolar infection)


Toxic fume inhalation (e.g., nitrogen dioxide, sulfur dioxide) (Table 5-4)


Connective tissue disease, particularly rheumatoid disease, and Sjögren’s syndrome


Drug therapy (e.g., penicillamine, gold salts)


Chronic rejection following lung and heart-lung transplantation


Chronic graft-versus-host disease following bone marrow transplantation


Neuroendocrine cell hyperplasia


Inflammatory bowel disease


Idiopathic


Obliterative (or Constrictive) Bronchiolitis

The pattern of obliterative bronchiolitis is characterized by the development of an irreversible circumferential submucosal fibrosis, resulting in bronchiolar narrowing or obliteration of bronchioles in the absence of intraluminal granulation tissue polyps or surrounding parenchymal inflammation (Fig. 5-7) (10,33). Proliferation of fibrosis extends predominantly between the epithelium and the muscular mucosae and along the long axis of the airway, impairing collateral ventilation, and leading to airflow obstruction (Fig. 5-7B). The epithelium overlying the abnormal fibrosis tissue may be flattened or metaplastic and is usually intact without any ulceration. In some instances, the accompanying pulmonary artery is also obliterated by the same fibrotic process.

Although the histologic characterization of bronchiolitis clearly depends on the availability of tissue, the clinical and radiologic features associated with specific histologic patterns are often sufficiently characteristic to permit a strong, presumptive diagnosis. The various causes of obliterative bronchiolitis are shown in Table 5-2.


CT FINDINGS

Although the visualization of normal bronchioles is impaired by the spatial resolution limits of the thin-section CT, these airways may become directly visible when inflammation of the bronchiolar wall and accompanying exudate develop. On the other hand, bronchiolar changes can be too small to be visible directly but can cause indirect signs that suggest small airway involvement. Obstruction of the bronchioles may induce regional underventilation, leading to reflex vasoconstriction and expiratory air trapping, both of which may be visible on CT images. Five different CT patterns can express small airway pathology. The first two are direct signs, and the other three represent indirect manifestations.


Tree-in-Bud Sign

The tree-in-bud pattern comprises focal or multifocal areas of small centrilobular nodular and branching linear opacities. It reflects the abnormal bronchiolar wall thickening and dilatation of the bronchiolar lumen filled with liquid, mucus, or pus that is often associated with peribronchiolar inflammation (7). The branching pattern of dilated bronchioles and peribronchiolar inflammation give the appearance of a budding tree (Fig. 5-8). Some variants have the same diagnostic value. They include clusters of centrilobular nodules linked together by fine linear opacities or branching tubular or Y-shaped opacities without nodules (Figs. 5-9 and 5-10). When the bronchiole is sectioned across its axis the filled dilated lumen may appear as a single well-defined
centrilobular nodule a few millimeters in diameter. In every case, the key feature is the centrilobular location of these opacities, at least 3 mm from the pleura.


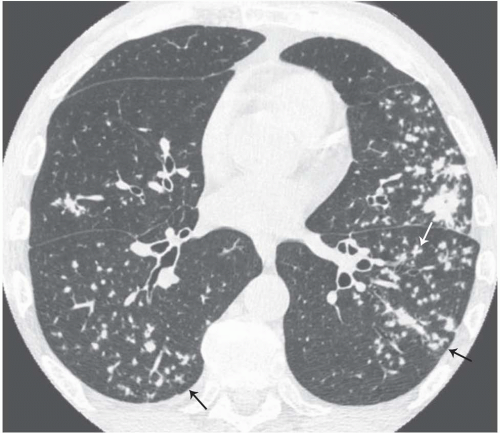
Figure 5-8 Tree-in-bud sign. Endobronchial spread of tuberculosis. Bilateral patchy areas of small centrilobular, nodular, and/or linear branching opacities. Note also the presence of larger nodules and an airspace consolidation in the left upper lobe.


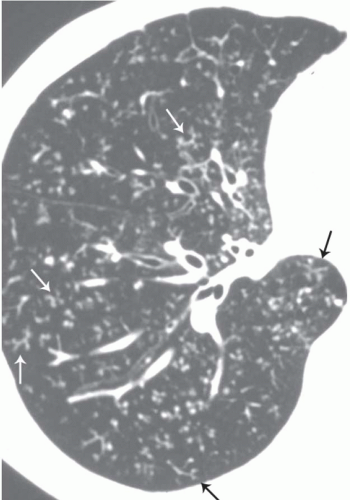
Figure 5-9 Tree-in-bud sign. Thin-section CT targeted on the right lung in a patient with diffuse aspiration bronchiolitis secondary to esophagobronchial fistula seen as a complication of cancer of esophagus. There are multiple small centrilobular nodular and/or branching linear opacities. Some arrows show typical tree-in-bud sign.

The tree-in-bud sign is characteristic of acute or chronic infectious bronchiolitis (34). It can also be seen in diffuse panbronchiolitis, diffuse aspiration bronchiolitis, and bronchiolitis obliterans with intraluminal polyps featuring bronchiolar filling with granulation tissue (35).

The tree-in-bud sign is distinguished from abnormal centrilobular perivascular interstitial thickening by its more irregular appearance, a lack of tapering, and the bulbous or knobby appearance of the tips of small branches. Some difficulties in interpretation may occur. Bronchiolar filling with tumor cells, observed in bronchioloalveolar cell carcinoma or tumor emboli within small centrilobular arteries, can produce centrilobular nodules and branching lines (36, 37, 38, 39). In the same way, peribronchiolar nodules resulting from sarcoidosis that occur in relation to the centrilobular arteries occasionally may mimic the appearance of the tree-in-bud sign (7,35). Hopefully, other typical features of sarcoidosis usually also are present.


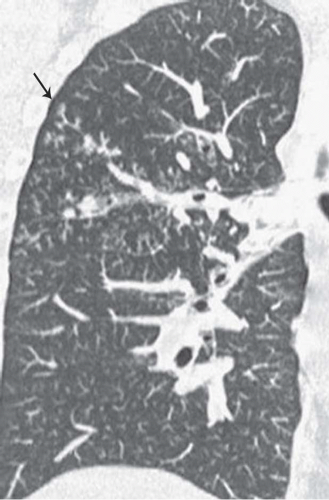
Figure 5-10 Tree-in-bud sign. A 5-mm-thick coronal slab using the multiplanar volume reformation combined with maximum intensity projection technique after thin-collimation multidetector CT acquisition. Multiple areas of small centrilobular, nodular, and/or linear branching opacity become apparent in the posterior segment of the right upper lobe (arrow). This helped the endoscopist perform a selective bronchial aspiration, which permitted the diagnosis of tuberculosis.

The frequent association of tree-in-bud sign with other findings of airway disease facilitates the diagnosis of small airway disease. They include areas of air-filled bronchiolar dilatation; ill-defined centrilobular nodules, reflecting areas of inflammation; bronchiolar wall thickening; and bronchiectasis.


Poorly Defined Centrilobular Nodules

The presence of ill-defined centrilobular nodules in patients who have bronchiolar disease usually reflects the presence of peribronchiolar inflammation in the absence of airway filling with secretion (40) (Fig. 5-11). Unfortunately this pattern is not specific to small airway disease and may also suggest a vascular or interstitial disease (41). When the finding is patchy in distribution, the list of entities potentially responsible is wide, including inflammatory/infectious bronchiolitis, asbestosis, silicosis, Langerhans cell histiocytosis,
vasculitis, pulmonary hypertension, sarcoidosis, or, rarely, BOOP. When the distribution of nodules is diffuse and homogeneous, the pattern is suggestive of bronchiolar disease or vascular entities, including pulmonary edema, pulmonary hemorrhage, and capillary hemangiomatosis. Differential diagnosis with bronchiolar disease is based on associated findings, such as pleural effusion in edema and enlargement of proximal pulmonary arteries. Bronchiolar possibilities include respiratory bronchiolitis, bronchiolitis associated with hypersensitivity pneumonitis, and follicular bronchiolitis (7,40). Despite the large number of diseases potentially responsible for this pattern, in most cases the differential diagnosis is simplified by detailed clinical information, including occupational and environmental histories.


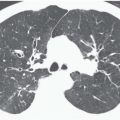
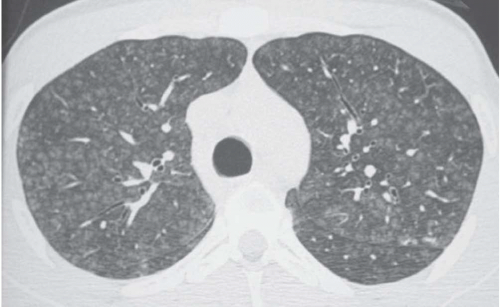
Figure 5-11 Poorly defined centrilobular nodules. Subacute hypersensitivity pneumonitis (bird fancier’s lung). Thin-section CT scan shows diffuse and homogeneous distribution throughout the lungs of the small centrilobular opacities expressing the inflammation in the bronchial and peribronchial areas.


Focal Ground-Glass Opacities, Airspace Consolidation, or Both

Unilateral or bilateral patchy areas of airspace consolidation containing air bronchogram are a nonspecific radiologic pattern. In the clinical context of small airway disease, they are suggestive of BOOP, reflecting the filling of the distal airspaces with granulation tissue. Consolidation affects mainly the peribronchial or subpleural lung regions (Fig. 5-12) (42, 43). Small centrilobular nodular opacities may be associated, reflecting the presence of intrabronchiolar granulation tissue or peribronchiolar consolidation. In case of infectious bronchiolitis, focal areas of consolidation, reflecting areas of bronchopneumonia, can be seen in association with small centrilobular and linear opacities (Fig. 5-8) (15,44).

Ground-glass opacity can be seen in association with respiratory bronchiolitis (15,45,46), respiratory bronchiolitis associated with interstitial lung disease (Fig. 5-13) (15,47,48), and BOOP (42,43). In respiratory bronchiolitis, the abnormality is bilateral, may be diffuse or patchy, and tends to involve predominantly or exclusively the upper lung zones. Ground-glass opacity is also often seen in association with airspace consolidation in BOOP. In immunocompromised patients who have BOOP, ground-glass opacity is occasionally the only abnormality on thin-section CT scans (42). Extensive bilateral areas of ground-glass
attenuation, more or less associated with poorly defined centrilobular nodular opacities, is a CT pattern frequently observed in acute or subacute hypersensitivity pneumonitis (Fig. 5-14) (49).


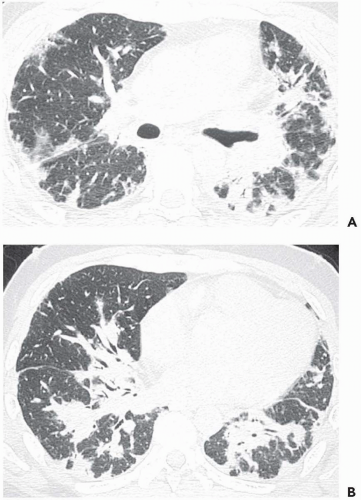
Figure 5-12 Airspace consolidation. Cryptogenic organizing pneumonia. Bilateral areas of airspace consolidation having both peripheral and peribronchovascular predominant distribution. A: Thin-section CT at the level of upper lobes and superior segments of lower lobes. B: Thin-section CT scan at the level of lower lobes.


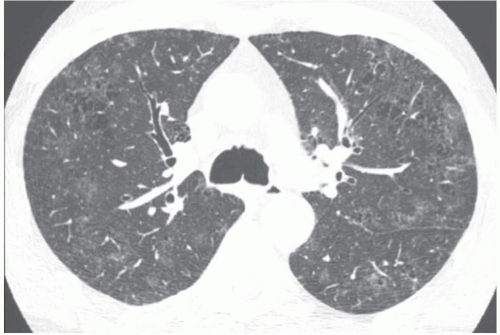
Figure 5-13 Ground-glass opacity. RB-ILD. Thin-section CT at the level of the main bronchi in a heavy smoker suffering from chronic dyspnea and cough. Patchy areas of ground-glass attenuation are present within the peripheral part of the lungs. Multiple spaces of centrilobular emphysema and bronchial wall thickening are also present. The abnormalities are related to RB-ILD.


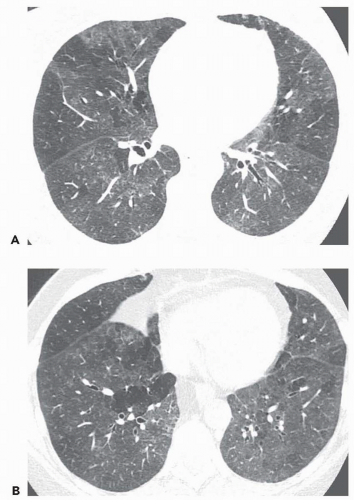
Figure 5-14 Ground-glass opacity and mosaic attenuation pattern. Subacute hypersensitivity pneumonitis (bird fancier’s lung). A and B: Two thin-section CT scans through the mid (A) and lower (B) parts of the lung. Multiple patchy areas of ground-glass attenuation are associated with small, poorly defined centrilobular nodules. Notice also the presence of some secondary pulmonary nodules appearing hypoattenuated and free of nodules, reflecting the presence of air trapping.


Decreased Lung Attenuation and Mosaic Perfusion

Areas of decreased lung attenuation associated with vessels of decreased caliber observed in bronchiolar disease reflect bronchiolar obstruction resulting in a decrease of perfusion (50). In acute bronchiolar obstruction, this decrease of perfusion represents a physiologic reflex of hypoxic vasoconstriction (51), but in the chronic state vascular remodeling takes place and the reduced caliber becomes irreversible. Although the vessels within areas of decreased attenuation on thin-section CT may be of markedly reduced caliber, they are not distorted as in emphysema. The lung areas of decreased attenuation related to decreased perfusion can be patchy or widespread. They are poorly defined or sharply demarcated, giving a geographical outline, representing a collection of affected secondary pulmonary lobules. Redistribution of blood flow to the normally ventilated areas causes increased attenuation of lung parenchyma in these areas. The patchwork of abnormal areas of low attenuation and normal lung or less diseased areas, appearing normal in attenuation or hyperattenuated, gives the appearance of mosaic attenuation (Fig. 5-15). The vessels in the abnormal hypoattenuated areas are reduced in caliber, whereas the vessels in normal areas are increased in size, and the resulting pattern is called “mosaic perfusion.” The difference in vessel size between low- and high-attenuation areas allows one to distinguish the mosaic perfusion pattern from mosaic attenuation due to an infiltrative lung disease with patchy distribution, in which the vessels have the same caliber in both high-attenuation and normal-attenuation areas (52,53). However, the decreased vessel size may be subtle and difficult to observe in some patients with mosaic perfusion (Fig. 5-16) (54).

Mosaic perfusion pattern is not always the result of bronchiolar disease and can also be caused by direct vascular obstruction (52). The obstructed pulmonary arteries are responsible for the low-attenuation areas, whereas redistribution of blood to surrounding normal lung areas results in increased attenuation. Vascular diseases leading to mosaic perfusion pattern seen on CT images include mainly chronic thromboembolic disease
(55,56) and, less often, primary pulmonary hypertension (57), pulmonary capillary hemangiomatosis (58), pulmonary venoocclusive disease (59), polyarteritis nodosa (52), scleroderma (57), and intimal sarcoma of the pulmonary arteries (60). The differential diagnosis between a bronchiolar and a vascular cause can be based on the presence or absence of air trapping on expiratory CT, respectively (54,61). When caused by bronchiolar obstruction, mosaic perfusion is accentuated on expiratory CT because the low-attenuation areas show air trapping (Fig. 5-17). In chronic vascular occlusive disease, air trapping theoretically does not occur. However, in a study by Worthy et al. (52) applying the previously mentioned criteria to distinguish diseases that may cause mosaic pattern of lung attenuation on CT scans, two observers made a correct diagnosis in 90% of infiltrative lung disease cases, 91% of airway disease, and only 32% of vascular disease. The difficulty in the diagnosis of vascular disease was the result of the presence of expiratory air trapping in a certain number of cases (52). This phenomenon was
confirmed recently by Arakawa et al. (62), who found expiratory air trapping in six of nine patients with chronic embolism. Air trapping was associated with the presence of proximal arterial stenosis (p <.01), and the area showed less contrast enhancement than did the adjacent lung (p <.05).


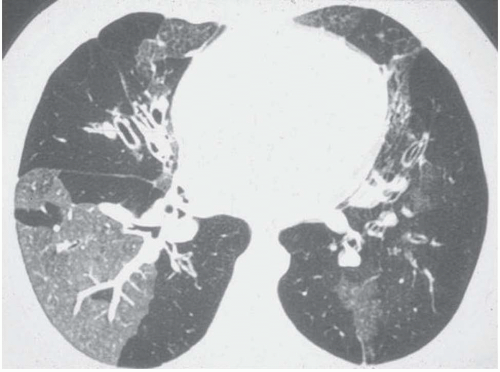
Figure 5-15 Mosaic perfusion pattern. Postinfectious obliterative bronchiolitis. Thin-section CT scan in a 14-year-old boy suffering from shortness of breath at exercise. The hyperattenuated area contains enlarged vessels, reflecting the pulmonary blood flow distribution toward the normal ventilated areas. Hypoattenuated areas are extended in both lungs and contain few and small pulmonary vessels. Bronchiectasis is also present in the right middle lobe and the left lower lobe. The demarcation between normal and abnormal areas is well defined, reflecting the limits between segments and lobules. (Courtesy of Christopher Flower.)


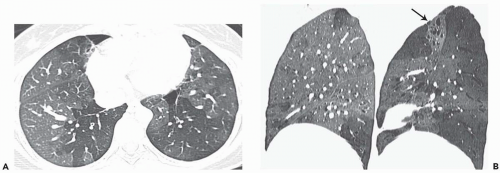
Figure 5-16 Mosaic perfusion pattern at MDCT. Postinfectious bronchiolitis. Thin-collimation MDCT acquisition. A: Thin-section CT at the level of the lower part of the lungs showing patchy areas of hypoattenuation in the lower lobes and the right middle lobe. B: Lateral reformation after thin-collimation multidetector row CT acquisition using the multiplanar volume reformation and minimum-intensity projection techniques in combination. Left (sagittal reformation of the right lung) and right (sagittal reformation of the left lung) images show well-demarcated areas of hypoattenuation and decreased perfusion, reflecting the territories where the lesions of obliterative bronchiolitis are situated. Notice the presence of bronchiectasis in the apicoposterior segment of the left upper lobe (arrow).


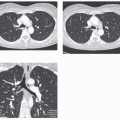
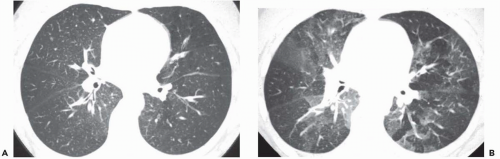
Figure 5-17 Mosaic perfusion and expiratory air trapping. Postinfectious obliterative bronchiolitis. Thin-section CT scan performed at full inspiration (A) and full expiration (B) of the middle parts of the lungs. On inspiratory scan, mosaic perfusion pattern is difficult to perceive. There is only mild hypoattenuation in the periphery of the left lung and the peripheral part of the right upper and lower lobes. At expiration, the contrast in attenuation between normal and abnormal areas is accentuated. The normally ventilated areas increase in attenuation at expiration as normally expected, whereas the abnormal areas do not, because of air trapping.


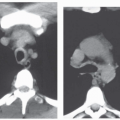
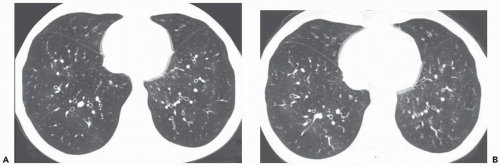
Figure 5-18 Decreased lung attenuation and expiratory air trapping. Thin-section CT scans obtained at full inspiration (A) and full expiration (B) in a patient presenting with post-bone marrow transplantation obliterative bronchiolitis. A: On inspiratory scan, there is a diffuse decrease in attenuation throughout the lungs with a paucity of pulmonary vessels in the periphery, expressing a severe and diffuse distribution of the bronchiolar obstructive lesions. Notice also the presence of bronchial wall thickening and slight dilatation of the bronchial lumen within the lower lobes. B: On expiratory scans, there is no significant increase in attenuation of the lung parenchyma. The cross-sectional areas of the lungs are not very different from those at inspiration, expressing the presence of bilateral and diffuse expiratory air trapping.

Air trapping at expiratory CT is defined as “retention of excess gas (air) in all or part of the lung, especially during expiration, either as a result of complete or partial airway obstruction or as a result of local abnormalities in pulmonary compliance,” according to the Nomenclature Committee of the Fleischner Society (63). The air is trapped and the cross-sectional area of the affected parts of the lung does not decrease in size on expiratory CT. Usually the regional inhomogeneity of the lung density seen at end-inspiration on thin-section CT scans is accentuated on sections obtained at end, or during, expiration because the high-attenuation areas increase in density and the low-attenuation areas remain unchanged (Fig. 5-17). In the case of more global involvement of the small airways, the lack of regional homogeneity of the lung attenuation is difficult to perceive on inspiratory scans, and as a result, mosaic perfusion becomes visible only on expiratory scans. In patients with particularly severe and widespread involvement of the small airways, the patchy distribution of hypoattenuation and mosaic pattern is lost. Inspiratory scans appear with an apparent uniformity of decreased attenuation in the lungs, and scans taken at endexpiration may appear unremarkable. In these patients, the most striking features are paucity of pulmonary vessels and lack of change of the cross-sectional areas of the lung at comparable levels on inspiratory and expiratory scans (Fig. 5-18).

Mosaic perfusion pattern associated with expiratory air trapping is seen on thin-section CT scans in patients who have obliterative bronchiolitis, regardless of etiology (15,64,65); bronchiolitis associated with hypersensitivity pneumonitis (49,66); and asthma (67,68).


Lobular Areas of Expiratory Air Trapping

Focal areas of low attenuation may appear on expiratory CT scans, whereas no lung attenuation abnormality is depicted on inspiratory CT scans (Fig. 5-19). This
phenomenon reflects the presence of air trapping in areas where partial airway obstruction is present (69, 70, 71, 72). These areas are commonly well demarcated, reflecting the geometry of individual or joined lobules. This pattern is frequently observed in smokers and in patients with asthma (Fig. 5-20), obliterative bronchiolitis, bronchiolitis associated with hypersensitivity pneumonitis (Fig. 5-21), or sarcoidosis (Fig. 5-19). In addition, this pattern may also be seen in patients with acute pulmonary embolism (73). Arakawa et al. (73) found in a series of 41 patients with acute pulmonary embolism one or more areas of air trapping in 72% of the patients. This air trapping was seen not only in areas with pulmonary embolism but also in areas without embolism. The proposed mechanism of bronchoconstriction in acute pulmonary embolism includes bronchoactive amines released from platelet aggregations in the thrombus or a change in parasympathetic nervous system tension, which centralizes the bronchial smooth muscle tension.


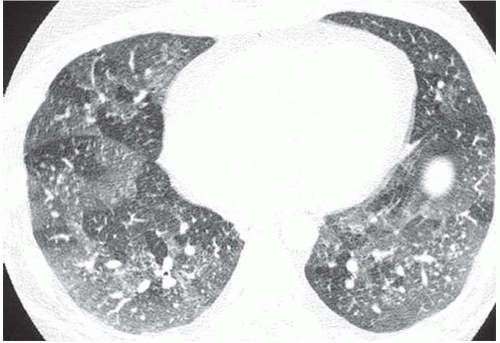
Figure 5-19 Lobular areas of expiratory air trapping. Early stage of sarcoidosis. Thin-section CT obtained at full expiration. Several lobular areas in both lungs did not increase in attenuation as normally expected. There was no abnormality depictable on inspiratory scans performed at the same anatomic level.


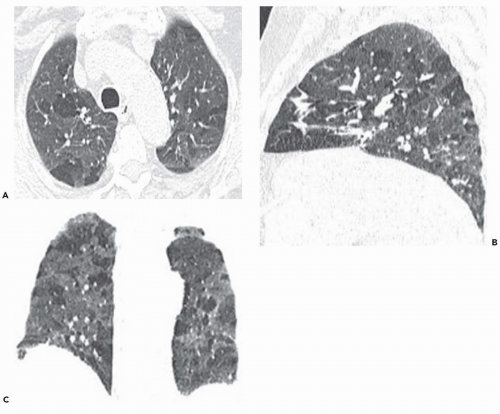
Figure 5-20 Lobular areas of air trapping at MDCT. Mild persistent asthma. Low-dose thin-collimation MDCT acquisition performed at maximum expiration. A: Axial thin-section CT shows lobular areas of air trapping in the upper lobe. B: Sagittal reformation of the right lung displays the upper and posterior distribution of lobular areas of air trapping. C: Coronal reformation with minimal intensity projection technique displays the extent of air trapping in both lungs.

The diagnostic value of the pattern of lobular areas of air trapping on expiratory CT scans depends on the extent and location of air-trapping areas. In approximately 50% of asymptomatic subjects, lobular areas of air trapping may be depicted on expiratory CT scans in dependent portions of the lungs irrespective of the patient’s position (70,72,74, 75, 76). Lee et al. (74) showed that the frequency of air trapping observed on expiratory CT scans of asymptomatic subjects increases with age (p < .05), and the degree of air trapping has a significant correlation with age (r = 0.523, p <.001).

The physiologic presence of focal areas of low attenuation on expiratory CT must be taken into account in the interpretation of air trapping (64,75). Usually, dependent lung regions show a greater increase in lung density during expiration than do nondependent lung regions. As a result, the anteroposterior attenuation gradients normally seen on inspiratory scans are significantly greater on expiratory scans. The anteroposterior lung attenuation
gradient can have a lobar component on expiratory scan; the posterior aspect of the upper lobe, anterior to the major fissure, often appears denser than the anterior aspect of the lower lobe, behind the major fissure. Some focal areas of low attenuation may also be seen near the tip of the lingula. All these physiologic low-attenuation areas involve less than 25% of the cross-sectional area of one lung at one scan level. As a result, air trapping can be considered abnormal when it affects nondependent areas or dependent lung areas greater than 25% of the lung cross-sectional area or a lung volume equal to or greater than a pulmonary segment and is not limited to the superior segment of the lower lobe.


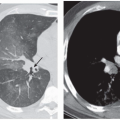
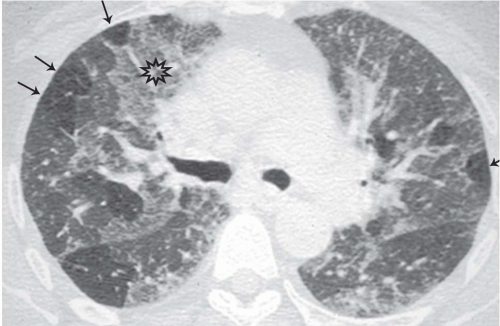
Figure 5-21 Ground-glass, mosaic perfusion, and lobular areas of air trapping (“head cheese” pattern). Subacute hypersensitivity pneumonitis. Expiratory thin-section CT at the level of the upper part of the lungs, showing patchy areas of ground-glass attenuation (star), combined with normal areas and some lobules appearing hypoattenuated because of air trapping (arrows).

The combination of ground-glass attenuation areas, mosaic perfusion pattern, and lobular areas of expiratory air trapping in a given patient expresses the association of interstitial and airway disease and has been called “head cheese pattern” (40). This pattern is suggestive of hypersensitivity pneumonitis, respiratory bronchiolitis-associated intersitial lung disease (RB-ILD), and sarcoidosis.


CT TECHNIQUE

So far we have based the recommended CT technique for assessing the small airways on high-resolution CT scans performed at full-suspended inspiration and full-suspended expiration. The inspiratory and expiratory thin-section CT scans are sampled at 10-mm and 30-mm intervals, respectively, from the apex of the lung to the diaphragm. A current alternative, multidetector computed tomography (MDCT) volumetric acquisitions during a single breath hold using thin collimation (1.25 mm), is performed over the entire lungs with the following parameters: 100 to 120 kVp and 100 to 150 mAs at full inspiration, and 100 to 120 kVp and 40 to 80 mAs at full expiration. Reconstruction of axial images is performed with 0.6-mm overlap if multiplanar reformations are requested (64,77).


Multiplanar Volume Reconstruction and Maximum- and Minimum-Intensity Projection Techniques

Multiplanar reformations are the easiest reconstruction to generate and can be interactively performed in real time at the console or workstation. Whereas the thickness of the displayed planar image is 0.6 to 0.8 mm, depending on the dimension of the field of view, multiplanar volume reconstruction (MPVR) consists of a slab with a thickness of several pixels and is a less noisy reformation. MPVRs may also form the basis of intensity projection techniques. With minimum-intensity projection (MinIP) technique, pixels encode the minimum voxel value encountered by each ray (Fig. 5-16B). Airways are visualized because air contained within the bronchial tree is lower in attenuation than surrounding pulmonary parenchyma. MPVR-MinIP technique may be used in the detection of air bronchograms in focal areas of airspace consolidation or of ground-glass opacification (77). Increasing the contrast between areas of normal lung attenuation and areas of lung hypoattenuation may facilitate the depiction of mosaic perfusion pattern (Fig. 5-22) (77). Its application on expiratory CT scans can facilitate assessment of the presence and extent of expiratory air trapping (Fig. 5-22). Several studies have shown that MinIP images improve the detection of air trapping and are associated with increased observer confidence and agreement as compared with thin sections alone (78,79).

In maximum intensity projection (MIP) technique, pixels encode the maximum voxel value encountered by each ray. The thickness of the slab is selected interactively at the console or workstation. This is beneficial in the display of small centrilobular nodular and/or linear opacities (tree-in-bud sign) or poorly defined centrilobular nodules. The technique consists of increasing the profusion of nodules in the volume of interest by increasing the thickness of the slab and simultaneously keeping the same spatial resolution as that of a thin-section CT scan (Figs. 5-10 and 5-23). The use of MPVR-MIP has been proved to increase the number of bronchiolar centrilobular opacities compared with single thin-section CT scans in patients with infectious or inflammatory bronchiolitis (80).


Texture Analysis

Although thin-section CT is an accurate imaging technique for the detection of constrictive bronchiolitis, features on thin-section CT images can be subtle, particularly in the early stages of disease, and diagnosis is subject to interobserver variability. To refine the differential diagnosis of obstructive lung disease, it is necessary to take into account the textural appearance of lung parenchyma with abnormally low attenuation. Chabat et al. (81) developed an automated method for the differentiation of centrilobular
emphysema, panlobular emphysema, constrictive bronchiolitis, and normal lung on the basis of texture features. The proposed technique discriminates well among patterns of obstructive lung disease on the basis of parenchymal texture alone, with good sensitivity and good specificity (Fig. 5-24).


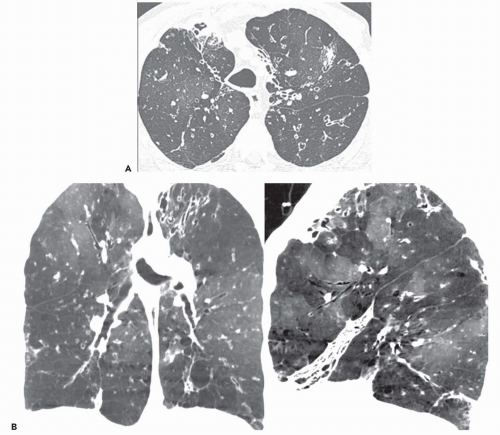
Figure 5-22 Minimum-intensity projection and mosaic perfusion pattern. Postinfectious bronchiectasis and obliterative bronchiolitis. A: Thin-section axial CT scan at the level of the upper part of the lungs. Distortion and enlargement of the lumen of the trachea with bilateral cylindrical bronchiectasis in the upper lobes and the superior segment of the left lower lobe. Slight heterogeneity in lung attenuation. B: Multiplanar volume reformation combined with minimum intensity projection technique after thin-collimation MDCT acquisition. The coronal (left) and sagittal (right) reformations reinforce the detection of mosaic perfusion pattern and help assess the extent of decreased attenuation areas in both lungs. Notice the presence of a nonaerated collapse of the right middle lobe associated with bronchiectasis (right).


Expiratory CT

The most commonly used technique for the assessment of air trapping at CT is based on postexpiratory thin-section CT scans obtained during suspended respiration following a forced exhalation. Each of the postexpiratory scans is compared with the inspiratory scan that most closely duplicates its level to detect air trapping. Dynamic CT acquisition during continuous expiration, which can be used to collect data at a fixed level during expiration, is a second technique. Electron beam CT initially was performed with a scanning time of 100 msecond per image, to assess the dynamic changes in lung attenuation and in architecture during expiration with minimal motion artifacts (82). More recently a dynamic expiratory maneuver performed during helical CT acquisition was described in a small number of
patients with good results despite a longer scanning time per image (83,84). Motion artifacts, which increase as temporal resolution decreases, represent the major limitations of continuous expiratory CT. The use of 180-degree linear interpolation algorithms with a 0.5-second rotation time provides images representing scanning periods of about 250 msecond. Motion artifacts are at maximum during the early phase of expiration and at a minimum during its late phase, which allows good visualization of lobular air trapping with helical CT.


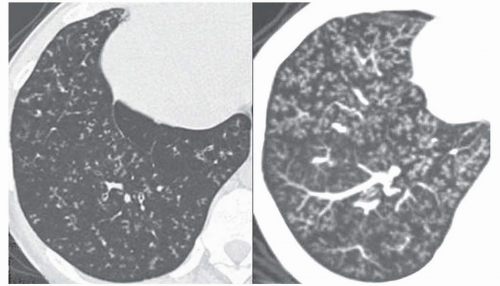
Figure 5-23 Tree-in-bud sign. Infectious bronchiolitis in a patient with ciliary dyskinesia. Left: Thin-section CT targeted on the right lower lobe showing multiple small centrilobular, nodular and linear branching opacities in many lobules of the right lower lobe. Right: A 7-mm-thick axial slab using the multiplanar volume reformation and maximum-intensity projection technique, increasing the profusion of the small centrilobular opacities and keeping the same spatial resolution of thin-section CT scan in infectious bronchiolitis.


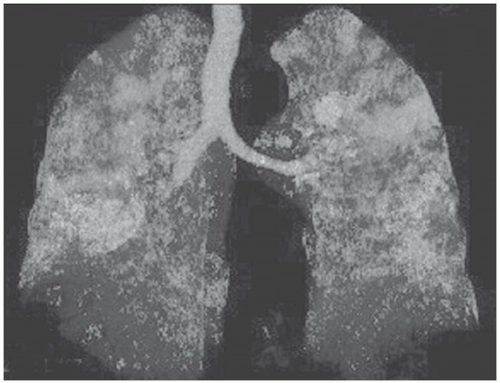
Figure 5-24 Three-dimensional (3D) display of expiratory air trapping. Same patient as in Figure 5-20. The areas of hypoattenuation resulting from expiratory air trapping are automatically segmented and highlighted and taken into account in the 3D reconstruction.

Only gold members can continue reading. Log In or Register to continue

Stay updated, free articles. Join our Telegram channel

Jul 8, 2016 | Posted by in GENERAL RADIOLOGY | Comments Off on Small Airway Diseases

Full access? Get Clinical Tree

Get Clinical Tree app for offline access