Martin JK. Blomley †, Kenneth A. Miles, David O. Cosgrove
Functional, Physiological and Molecular Imaging
Historically, radiological methods have been seen as tools for anatomical rather than functional imaging. The exception to this has been in nuclear medicine, where a huge array of radio-pharmaceuticals with different pharmacokinetic and imaging properties are used to image many aspects of physiology and pathophysiology. Of late, however, the traditional division has become blurred in some areas, notably perfusion and blood volume imaging. The cross-sectional techniques, in particular, have increasingly come to be seen as important tools for functional and physiological imaging. Nuclear medicine has shown that functional and physiological imaging offers two advantages over a purely structural approach: (A) the potential for earlier diagnosis before anatomical changes have developed; and (B) a closer correlation between the functional status of disease and clinical outcome which translates to improved clinical decision-making. Many of the methods developed for nuclear medicine can be applied to magnet resonance (MR), computed tomography (CT) and ultrasound (US) to produce techniques that combine the benefits of functional imaging with the high spatial resolution achieved with modern equipment.
In recent years, research initiatives in the biological sciences, such as the ‘human genome project’, have focused the understanding of medicine to the level of molecular biology. Diagnostic imaging has by no means been immune to this change, and increasingly imaging is not only understood in terms of molecular processes but also is used to demonstrate these processes in vivo. Although the resolution of diagnostic imaging techniques is clearly insufficient to depict individual molecules, a range of functional and physiological imaging characteristics can act as correlates for the activity of particular molecular and genetic processes. This approach has been dubbed ‘molecular imaging’.
It is important, however, to realise that functional imaging in its widest sense has always been an inextricable part of radiology. Many everyday imaging methods, such as Doppler ultrasound, intravenous urography, or an expiratory chest CT, are as much ‘functional’ as ‘anatomical’ techniques. To describe all such applications would require coverage of a significant part of the whole subject of radiology, and is beyond the scope of this chapter, which instead focuses on two areas: the first—physiological imaging with contrast media—describes how tracer kinetic methods in general, developed for nuclear medicine and in turn derived from classic physiological principles, can be applied to a variety of imaging applications; the second—principles of molecular imaging—outlines, with examples, the general approaches by which imaging can be used to study molecular and genetic processes. Only limited coverage will be given to the hugely important subject of physiological and molecular imaging with nuclear medicine and positron emission tomography (PET), as this is discussed in more detail elsewhere. For simplicity also, many other extremely important applications of MR to functional imaging—including functional brain MR using intrinsic contrast methods, notably blood oxygenation level-dependent (BOLD) studies, magnetic resonance spectroscopy and diffusion/perfusion-weighted sequences—are omitted as they are also described in detail elsewhere.
Physiological Imaging with Contrast Media
Why Use Kinetic Modelling?
In diagnostic imaging, contrast agents are generally used to highlight anatomical structures or pathological features that are otherwise difficult or impossible to see (e.g. blood vessels, kidneys, liver metastases). Such structures are often said to ‘enhance’ following the administration of contrast agent. Frequently, basic information about the functional status of these structures can be inferred from visual inspection of contrast-enhanced images. For example, a kidney that does not opacify after administration of standard X-ray contrast agent may be deduced to be non-functioning. Similarly, structures that are judged to opacify to a greater or lesser degree, or at an earlier or later time than normal, may be considered to exhibit altered function. The degree of functional change can be assessed by visual grading or measurement of the amount of enhancement. Although readily obtainable, these semiquantitative approaches have significant constraints, most notably a poor or indirect relationship between the amount of enhancement and the physiological process assessed. For instance, reduced enhancement in a kidney may be due to a general reduction in cardiac output rather than impaired renal function. To overcome such constraints, it is possible to create models that describe how enhancement changes over time, encompassing a range of physiological factors and weighting each factor appropriately. By representing these models as mathematical formulae, it is possible to derive more precise measurements of individual physiological processes. This mathematical analysis is known as ‘kinetic modelling’. Because the pattern of contrast enhancement is determined by particular physiological processes, contrast agent can be considered to be a ‘tracer’.
In order to use tracer kinetic methods in a meaningful manner, several requirements need to be met. Firstly, it is important to be able to model the pharmacokinetics of the contrast agent, or tracer, being used. Secondly, it must be possible to measure contrast agent concentration, or at least to be able to compare it in different areas. Appropriate mathematical methods can then be used to calculate a variety of physiological indices of clinical value. These functional indices can then be calculated directly or displayed as a parametric ‘functional image’ co-registered with an anatomical image.
Contrast Agent Pharmacokinetics
Although all types of contrast agent can be used as tools for functional imaging, it is crucial to understand their different kinetics. For example, the conventional iodinated X-ray and gadolinium chelate MR contrast media are relatively small molecules (about 1000 Da), which pass rapidly from plasma into the interstitial fluid in most tissues of the body, with subsequent excretion into the urine. However, transfer into the extracellular space does not occur in the brain where the blood–brain barrier prevents these molecules leaving the intravascular space. Thus these agents can, in principle, be used for measuring various indices of vascularity, such as fractional vascular volume (FVV) and perfusion (i.e. flow per unit volume or mass of tissue). They are also well suited for estimating the rate of efflux into interstitial compartments (loosely speaking, vascular ‘leakiness’). These applications are discussed in more detail below.
Some types of contrast agent, such as microbubbles (ultrasound contrast agents), remain intravascular and therefore act as blood pool markers similar to technetium (99mTc)-labelled red blood cells. These agents are highly suitable for measuring indices of the blood volume and perfusion in all organs and show great promise as a tool for measuring transit times through the vessels of various organ beds. Some contrast agents are selectively taken up into the reticuloendothelial system of the liver and spleen. Colloidal agents have these properties and have long been available in nuclear medicine; similar kinetics apply to the superparamagnetic iron oxide (SPIO) contrast agents in MR and to some liver-specific microbubbles. Additional contrast agents are available with selectivity for other tissues such as the biliary system (gadolinium ethoxybenzyl diethylenetriaminepentaacetic acid, or Gd-EOB-DTPA; 99mTc-dimethyl-iminodiacetic acid, or HIDA) or pancreas (manganese dipyridoxyl diphosphate, or Mn-DPDP). In principle, uptake rates into these different types of tissue can be measured. A number of freely diffusible gases can also be used for functional imaging studies, such as xenon for CT and MR, and hyperpolarised helium in MR. These gases potentially lend themselves to the measurement of blood flow indices.
Measurement of Tracer Concentration
In some aspects, the measurement of the in vivo concentration of contrast agents is simpler than measurement of signals from radionuclides. For example, there is less need to make corrections for factors such as tissue attenuation. The higher spatial resolution of CT, MR and US means that regions of interest can be placed more accurately over specific structures in which the tracer concentration is to be measured. Difficulty of obtaining data with a sufficiently high temporal resolution in a particular scan plane is another limitation of conventional nuclear medicine techniques. On the other hand, the sensitivity of radionuclide imaging means that lower concentrations of tracer are measurable using nuclear medicine techniques other than CT, MR or US.
The concentration of X-ray contrast agents can be measured with particular ease using CT. There is a linear relationship between the increase in attenuation and iodine concentration1 in the absence of artefacts such as significant beam hardening. The precise relationship depends upon X-ray tube voltage, the age of the X-ray tube and the design of the CT system; however, in general, an increase in iodine density of 1 mg/mL will increase attenuation in a voxel by 25–30 HU. For practical purposes, therefore, a baseline-subtracted time–attenuation curve on CT after a bolus injection of contrast agent can be treated as a scaled time–concentration curve. This linearity is a particular advantage of CT.
Recent developments in CT technology have established dynamic contrast-enhanced (DCE) CT as a clinical functional imaging technique. Validated software that calculates a range of perfusion parameters with parametric mapping is available commercially and consensus guidelines for the optimal performance of DCE-CT have been published for applications in cerebrovascular disease and oncology.2,3 Dynamic imaging of greater tissue volumes (e.g. whole brain) is now possible through the use of wider detector tracks and/or table toggling techniques. Software that corrects for movement of the patient in transverse and craniocaudal directions has improved the reliability of DCE-CT in the thorax and abdomen. Reductions in the radiation exposure associated with DCE-CT can be achieved through optimisation of imaging acquisition and utilisation of novel image reconstruction techniques. Further benefits can potentially be achieved through use of dual-energy CT systems which can facilitate estimation of tissue iodine concentrations following injection of contrast material.
MR systems are more sensitive to contrast agents than CT but measurement of the concentration of MR contrast agents is much more difficult. The interested reader is referred elsewhere for a fuller discussion, as there is a large literature on this subject.4,5 In general, the alterations in T2* relaxation time by susceptibility effects (e.g. with SPIO agents imaged using gradient-echo sequences) can be quantified in the vascular system with good results.6 However, most interest has focused on analysis of the T1 shortening effects of the gadolinium chelates,7 typically using T1-weighted spin-echo sequences for which it is assumed that changes in T2* effects are small compared to T1 changes. The relative signal change in a region on a T1-weighted sequence can be considered approximately proportional to the local gadolinium concentration when the concentration is low. Unfortunately, this somewhat simplistic analysis often breaks down at higher concentrations when T2* shortening cannot be neglected. The T2* effects may start to counteract the positive contrast effects of the T1 shortening. In addition, flow effects may be important in vessels. For both these reasons, quantitative measurements of vascular as well as parenchymal signal concentration are rarely successful. In general, quantification is possible using this approach, but only within certain concentration ranges, and ‘input function’ data from vessels are hard to obtain.
Quantification of the enhancement effects of microbubble contrast agents in ultrasound is both helped and hindered by the fragility of microbubbles. Microbubbles are unique amongst contrast agents in that they can be destroyed by the very act of imaging them, even at low acoustic power settings.8 This consideration leads to two opposing approaches to quantification.9
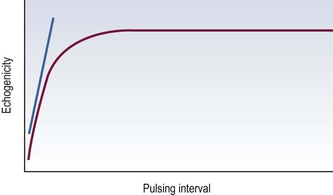
The first approach is to use ultrasound with low acoustic powers and passively observe the enhancement effects produced. A particularly promising method is to quantify the intensity changes in spectral Doppler or power Doppler signals. It has been shown that regional microbubble concentrations can indeed be measured by quantifying the intensity of these signals.10 Grey-scale signals can also be quantified, although usually newer harmonic imaging modes are needed to observe useful changes. The second approach is actively to seek to destroy microbubbles with a single pulse of high acoustic power and then scan using very low power settings, observing microbubble refilling rates into an area of interest during an infusion.11 One method is repeatedly to pulse ultrasound at varying triggering intervals, waiting for a steady state and to study the relationship between steady-state enhancement levels and triggering delay settings.12
In principle, both methods can measure microcirculatory flow speeds and the FVV of a tissue. Quantification can be performed offline from the external video and audio output signals produced by the machines, or in some cases using proprietary software provided by the manufacturers. In all cases, corrections need to be made for non-linear machine processing, notably the log compression widely employed in the display of ultrasound data.
Modelling and Mathematical Approaches
By using a variety of approaches, many functional indices of vascularity can be measured, including fractional vascular and extravascular volumes, perfusion, transit times and indices of permeability or contrast clearance. As elsewhere in this chapter, only an overview of this subject can be given, and the reader is referred to several more detailed texts on these subjects for a fuller account.13–15
Perfusion
Probably the most important single index that can be measured is perfusion, which is defined as flow either per unit volume or per unit mass of tissue. (Since the specific gravity of body tissues is close to 1, there is little difference between these two.) It is generally simpler to calculate perfusion in units of flow per unit volume and this convention will be followed here. Although tissue perfusion can, in principle, be measured using MR without exogenous tracers, the most successful approaches involve the kinetics of external tracer wash-in, wash-out and bolus passage.
Wash-in Studies
In wash-in studies, an agent which does not pass through a tissue bed is given, and accumulates progressively in the organ of interest. The classic example of this is the intra-arterial administration of microspheres deliberately engineered to be too large to pass through capillaries and which therefore mechanically embolise in a tissue bed (in the absence of shunts). Although such use of microspheres is confined to invasive animal studies, other tracers available for use in patients behave in a similar fashion, including ultrasonic contrast agents based on specialised large microbubbles with a diameter greater than that of capillaries (i.e. ≥ 8 µm).16 The concept of a ‘chemical microsphere’ pertains to tracers, typically radiopharmaceuticals, that can be administered intravenously but are extracted by the tissue of interest with an efficiency approaching 100%, and therefore accumulate in the tissue in a manner comparable to intra-arterial microspheres.
As with all such agents, perfusion can be calculated as the ratio of tissue concentration at equilibrium with the integral of arterial tracer concentration (although corrections need to be made for an incompletely extracted tracer). Arterial concentration is classically determined from arterial blood samples drawn at a known rate (Appendix 1), although less invasive methods can be used.
Wash-out Studies
In wash-out studies, the principle is to observe the time–concentration curve for an agent during its passage out of a tissue bed. With appropriate corrections, perfusion can be calculated from the slope of a semilogarithmic plot of the time–concentration curve (Appendix 2). Although one (invasive) way of performing such a study is to give a very short, fast arterial injection of a tracer, such as an intracarotid xenon injection for brain perfusion studies, it is far more practical to give a freely diffusible tracer for a relatively long period to achieve a steady state and then abruptly discontinue it. The tracer will then be eliminated by pulmonary passage very rapidly. Examples include inhaled inert xenon in CT.
Bolus Passage
The pharmacokinetics of many agents used for perfusion measurements (especially conventional CT and MR tracers) are rarely ideal for perfusion imaging. Problems such as the partial extraction of an agent into the extracellular space during vascular passage may confound calculations, and recirculation must be accounted for. A number of approaches to deal with these difficulties have been developed, involving analyses of the effects of a bolus of contrast medium (Appendix 3). Two are particularly useful in measuring perfusion. One method is to calculate perfusion as the ratio of peak parenchymal enhancement to the area under the arterial time–enhancement curve. This method has been applied to functional CT of the myocardium, spleen and other organs. Whilst useful, errors will arise if significant venous outflow occurs before peak tissue enhancement takes place.17–21 A more robust method, developed by Miles for functional CT, is less subject to this problem of error from venous wash-out because perfusion is calculated from the ratio of the peak gradient of the tissue time–concentration curve to the peak height of the arterial curve.22–24
An alternative approach is based on measurements of mean transit time (MTT) for a tracer to pass from inflow to outflow25 (Appendix 4). Strictly speaking, MTT should be measured by calculating the MTT values for a feeding artery and a draining vein and taking the difference. However, the simultaneous determination of arterial and venous concentrations can be difficult in practice, and MTT values are often determined from tissue time–concentration curves or ‘residue functions’ which can be determined by mathematical analysis known as deconvolution.26,27 The peak gradient approach and deconvolution methods can both be extended to tissues with ‘portal’ circulations (i.e. more than one type of input vessel), such as the liver.28,29
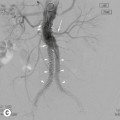
Microbubbles may offer a particularly appealing and elegant method of measuring true vascular transit times through organ beds, for two main reasons: they generally behave as pure blood pool enhancers and it is often possible to study single vessels or groups of vessels. For example, a spectral Doppler gate can be placed over the pedicle of a kidney so that the signal from one stereo channel shows arterial flow (towards the transducer) and that from the other channel shows venous flow (away from the transducer). Time–intensity profiles from each vessel can be analysed and the transit time through the kidney (about 4 s) easily calculated.30 Other types of temporal index can be calculated using microbubbles: this is discussed below.
Fractional Vascular Volume
The fraction of tissue occupied by blood is, in itself, an important physiological measurement of the microcirculation, corresponding to the ‘vascularity’ of the tissue. As can be seen above, it is also needed as part of some algorithms for calculating perfusion. In theory, this index should be obtainable directly using the widely available method of power Doppler ultrasound (PD). PD may be seen as a machine-processed, log-compressed map of the number of moving red cells, principally detected as rouleaux. Compensation for non-linear machine processing effects can be applied and estimates of FVV obtained.31,32 Unfortunately, the detection of a vascular signal in smaller vessels (i.e. ≤ 100 µm) with Doppler without microbubble enhancement is difficult for both practical and theoretical reasons, and the measurements obtained can probably only be regarded as relative yardsticks.
Tracer kinetics can be applied relatively simply to the measurement of blood volume. The simplest approach is to administer a blood pool tracer, wait until steady state and then calculate the ratio between tissue and blood pool concentration. Alternatively, fractional volume can be calculated dynamically. For example, the ratio of the area under a tissue time–concentration curve to that of the arterial time–concentration curve will calculate FVV, although this simple relationship may be complicated by recirculation and passage of tracer into the extravascular space.
Direct and Indirect Indices of Permeability
Many agents, such as conventional X-ray and MR contrast agents, diffuse rapidly into the interstitial spaces outside the brain. Compartmental and other types of analysis can be applied to their kinetics (Appendix 5) and indices of these processes calculated.33–35 Such indices can provide a useful tool for characterising malignancy, as vascular hyperpermeability is known to be a feature of tumour neoangiogenesis. Changes in permeability can be used, for example, to demonstrate acute radiation injury.36
Other Functional Indices
A large variety of other functional indices can be measured. These include global renal function (i.e. GFR), which can be determined using serial assays of iodinated contrast agents, which, being renally filtered, are analogous to Tc-DTPA.37–39 Using CT, the concentration of iodinated agents can be conveniently measured without the need for blood sampling. It can be shown that the slope of a semilogarithmic plot of their concentration against time measures GFR per unit volume of extracellular space.40,41
Another promising class of functional indices is the large number of temporal indices that can be measured using microbubble enhancement. For example, the time–intensity profile of the Doppler signal from a hepatic vein after bolus injection of a microbubble gives much useful information about transit through the liver. Patients with cirrhosis and liver malignancy, who have portovenous and other shunts, and arterialisation of their liver blood supply, show much earlier transit, with enhancement beginning at 24 s or less after injection, whereas normal subjects enhance later, typically over 30 s. This phenomenon shows great promise as a tool in the assessment of diffuse liver disease and also in the detection of early metastatic disease.42,43
The ease with which microbubbles can be destroyed, referred to earlier, opens up other functional imaging methods. For example, if a microbubble is infused and pulses of ultrasound are sent at varying trigger intervals, a steady state will be reached at each trigger setting in which the amount of microbubbles destroyed equals the amount flowing into the imaging plane. A plot of echogenicity against triggering interval will be asymptotic (Fig. 7-1): the initial upslope measures microcirculatory flow speed whilst the asymptote measure is proportional to FVV.9 Alternatively, if all the microbubbles in an area are destroyed and then imaged while they refill a tissue, the initial upslope of the time–concentration curve should also estimate microcirculatory flow speed.