Fundamentals of CT in PET/CT
Mahadevappa Mahesh
Imaging modalities are commonly differentiated as functional or anatomical in nature. However, both categories of information are complementary and when combined allow integration of data for the diagnosis, planning, and evaluation of cancer therapy. The explosive growth of positron emission tomography (PET) and computed tomography (CT) imaging in the past several years, with an estimated 1.5 million scans per year performed in 2007, attests to the value of fusing form and function into anatometabolic or anatomolecular images (1,2,3). At the time of the first edition of this textbook, PET/CT had only recently been introduced, and most PET scans were being performed using PET only devices. Now, most clinical PET studies are performed as PET/CT scans for cancer imaging, and nearly all PET scanners sold currently are PET/CT scanners, not dedicated PET devices.
The advantages of combining a CT scanner with a PET scanner are multiple. Both the PET and the CT scans are fully registered, if performed with correct technique without patient motion, which allows online fusion of two sets of volumetric images of different types. PET provides functional images of radiopharmaceutical distribution. CT provides anatomical images used for localizing radiopharmaceutical update and also supply attenuation maps that allow for attenuation correction to be performed and for more quantitatively accurate PET reconstructions (4). CT also provides intrinsically useful anatomical information that is of clear diagnostic value, even if the CT is not performed at the conventional highest diagnostic performance level (5,6).
The advantages of using a CT scanner with a PET scanner in the so-called hybrid imaging systems are that the CT data improve anatomical landmarks for localization of radiotracer uptake. This is due to high photon flux, which improves accuracy and reduced noise levels of attenuation measurements and much higher quality images than those from radionuclide sources. CT also provides high spatial resolution images that can generate highly accurate localization maps and accurate attenuation correction maps. Since the average CT energy is less than 100 keV and the PET energy is in the range of 511 keV, there is little cross talk between the transmission and emission images. Of course, with all current PET systems, these images are obtained sequentially and not simultaneously. PET/CT scanners are designed so that the hybrid scanner is neither PET only nor CT only; it is truly a new imaging tool. It combines two major medical imaging technologies: x-ray CT for anatomical imaging and attenuation corrections, with PET for functional imaging. The PET/CT scanner can operate as a single or a dual modality system, which can be used to acquire only CT scans, only PET scans, or PET/CT scans. Fig. 4.1 shows a schematic drawing of a typical PET/CT scanner. The CT gantry is positioned parallel to the PET gantry. Both the CT gantry and the PET gantry are assembled such that they are positioned in line, so the two components, PET scanner and CT scanner, can relatively easily be separated to allow for repairs or maintenance services on individual scanners, and in line so that the scanners image the same portion of each patient if the table is properly incremented between the devices. The fact that the devices are next to each other, albeit closely integrated, means that each component, the CT and the PET, can advance at its own rate in terms of improvements in technology. In practice, many manufacturers offer several choices of CT scanner performance (slice number, rotational speed, number of x-ray tubes, etc.) that can be paired with the same (or varying) PET scanner performance characteristics (7,8,9). Thus, very high slice number scanners for CT scanning may be most appropriate for the CT component of PET/CT scanners used in the management of cardiovascular disease, where assessment of the coronary arteries may be a part of the PET/CT, while lower CT slice numbers and slower rotational speeds may be quite adequate for most oncological applications.
Since the PET and the CT scanners adjoin each other closely, but do not perform the PET scan and the CT scan at the same time (or at exactly the same place) on the patient, it is critical that they be aligned carefully. Further, to have the patient imaged at the same exact point with both modalities in all current systems, the imaging table must be advanced between the PET and the CT a distance equal to the separation between the gantries in order to image the same region of the patient. Thus, the table must be “in line” and the PET and CT components of the scanner must be aligned properly in multiple dimensions.
An initial challenge in the development of clinical PET/CT scanners was the stability of the patient table. When the table was extended such that the head of the table is positioned all the way inside the PET gantry, even a minimal flexion or bending of the
table could result in a significant error in the image fusion processes as the patient would be more posterior on the table that has been flexed posteriorly. Hence, the stability of the patient table when positioned with maximum extension was an initial challenge in the design of these systems. In some early designs, if the table was cantilevered over varying distances, especially with heavy patients, the patient’s weight would force the table downward if extended further. Thus, there could be a misregistration with the patient more posterior on the PET image than the CT. Manufacturers avoid this in a variety of ways in current models. However, installation of a PET/CT scanner requires very careful attention to the floor position, so that the floor is flat where the scanner and bed are installed, so the table moves seamlessly and without deviation through the gantry.
table could result in a significant error in the image fusion processes as the patient would be more posterior on the table that has been flexed posteriorly. Hence, the stability of the patient table when positioned with maximum extension was an initial challenge in the design of these systems. In some early designs, if the table was cantilevered over varying distances, especially with heavy patients, the patient’s weight would force the table downward if extended further. Thus, there could be a misregistration with the patient more posterior on the PET image than the CT. Manufacturers avoid this in a variety of ways in current models. However, installation of a PET/CT scanner requires very careful attention to the floor position, so that the floor is flat where the scanner and bed are installed, so the table moves seamlessly and without deviation through the gantry.
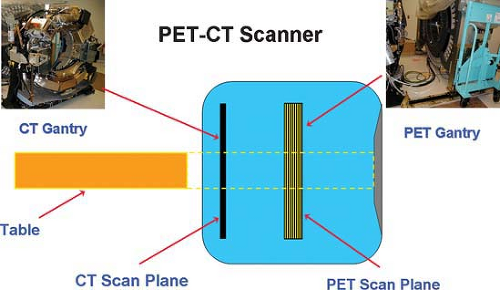 Figure 4.1. Schematic diagram of CT (left) and PET gantry (right) in a PET/CT scanner. |
A typical PET/CT protocol includes moving the patient first into the CT gantry to perform a CT scan of the region of interest (often much of the body) and then moving the patient further into the PET gantry to acquire the PET scan of a similar region. For example, in one approach to PET scanning, during a whole-body PET/CT scan, the patient is scanned with CT scanner from midear to midthigh, and then the patient is positioned at different location/fields under PET gantry to acquire PET images. The distance of separation is equal to the separation between the CT and the PET image. With such an approach, high-quality, but not perfect, registration of the CT and PET images can be obtained, typically with well less than 1 cm of difference between the lesion location on the CT versus its location on the PET (10,11). Perfect registration is difficult to achieve as the PET images are acquired over a longer period of time than the CT images, meaning that respiratory motion is an intrinsic component of the PET image, which can lead to blurring. Further, the CT may be obtained at a different position than the PET, as the CT is a “snapshot” image. This can be managed, but minor misregistrations between PET and CT are still not uncommon on PET/CT studies.
In this chapter, the fundamentals of CT as applied to PET/CT scanners are discussed. Also discussed are the radiation doses for typical PET/CT scans, particularly from the CT scan portion of the study. The other topics discussed include the scan parameters for typical PET/CT protocols, pitch, and image artifacts. Given that CT scanner technology is changing rapidly and CT protocols of a diagnostic quality with full intravenous and oral contrast are increasingly being applied, a full discussion of all clinical CT protocols is clearly beyond the scope of this review and frankly is in flux. The reader is referred to any of several full textbooks dealing with CT imaging for such guidance but should be aware of potential artifacts induced in quantitation of PET images in the presence of intravenous contrast, although they are often only modest if only relatively low concentrations of intravenous contrast are used, but can be substantial if high Hounsfield Units are present during the CT scan used for attenuation correction (12).
Fundamentals of CT
CT is a method of acquiring and reconstructing an image of thin cross sections of the body on the basis of measurements of attenuation of x-ray photons projected from multiple angles. In comparison with conventional radiographs, CT images are substantially free of superimposed tissues and are capable of much higher contrast due to elimination, or at least a major reduction, of scatter. Fundamentally, a CT scanner makes many measurements of attenuation through the plane of a finite thickness of a cross section of the body. The system uses these data to reconstruct a digital image of the cross section, with each pixel in the image representing a measurement of the mean attenuation of a boxlike element called voxel (three-dimensional pixel element) that extends through the thickness of the section. A CT image is based on the measurement of the x-ray attenuation through the section plane using many different positions. This is achieved by rotating both the x-ray tube and the
detectors around the patient. An attenuation measurement quantifies the fraction of radiation removed in passing through a given amount of specific material of thickness. Attenuation is expressed as shown in Equation 4.1, where It is the x-ray intensity measured with the material of thickness Δx in the x-ray beam, Io is the x-ray intensity measured without the material in the x-ray beam tag, and the μ is the linear attenuation coefficient of the specific material.
detectors around the patient. An attenuation measurement quantifies the fraction of radiation removed in passing through a given amount of specific material of thickness. Attenuation is expressed as shown in Equation 4.1, where It is the x-ray intensity measured with the material of thickness Δx in the x-ray beam, Io is the x-ray intensity measured without the material in the x-ray beam tag, and the μ is the linear attenuation coefficient of the specific material.
Characteristics of an unknown material can be determined, and given its physical thickness Δx, one can then measure Io and It and derive the characteristic of the material by using the above equation. The image reconstruction is basically a process of determining the attenuation values for each voxel by using many x-ray projections obtained by scanning from different angles. The CT signal is basically acquired because of the tissue discrimination, which is due to attenuation of radiation between voxels, which depends on differences in tissue density, atomic number of elements presented in the voxel, and the detected mean photon energy.
The other fundamental of CT imaging is that the attenuation values are scaled to a more convenient scale and are normalized to voxels containing water and are expressed as CT numbers in Hounsfield units. The CT number of a material is defined as in Equation 4.2, where μw is the attenuation coefficient of water, μm is the attenuation coefficient of material of interest and k is a scaling factor.
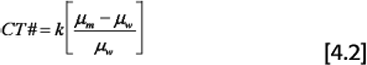
With the scaling factor of 1,000, the CT number of water is always 0, and the CT number of air is 1,000. Tissues denser than water have positive CT numbers, and tissues less dense than water have negative CT numbers. The CT numbers are represented or mapped onto a grayscale that is visible as a CT image.
The other fundamental in CT is the CT gantry. Although the CT gantry has a physical aperture of approximately 60 to 70 cm in diameter, the actual sampling area where the attenuation measurements are made is smaller than the physical opening; the actual sampling area is usually 50 to 55 cm in diameter (although sometimes larger in scanners designed for the obese). Because the sampling area is smaller than the physical gantry opening, the CT image can be degraded, resulting in failure to image appropriately part of patient’s shoulder or hip that lies outside the sampling area (truncation artifact). The plane of the gantry opening is called the transaxial plane (x-y plane) and the longitudinal direction that is in and out of the gantry is noted as z-direction.
CT Scanners
PET/CT became practical with helical CT and more recently with multiple-row detector CT (MDCT). The principle behind helical CT or spiral CT is that the patient is transported continuously through the gantry while data are acquired continuously during the several 360-degree rotations. Helical CT was made possible because of three major technological advances: (a) rhe development of the slip-ring gantry, which allowed the x-ray tube to rotate around the patient without having to stop to unwind the wires; (b) the development of interpolation algorithms, which allowed interpolation of data from adjacent helix during helical scan; and (c) development of high-powered x-ray tubes, which allowed continuous data acquisition.
In the 1990s, the introduction of helical CT revolutionized the field of CT diagnosis because it allowed for continuous volumetric data acquisition. In the late 1990s the introduction of MDCT revolutionized the field even further. With the introduction of MDCT the single row of detectors were replaced by multiple rows of detectors. This automatically increased scan volume per rotation. Also, it enabled such scanners to acquire multiple thin sections providing higher z-axis resolution.
The key differences between a single-row detector CT (SDCT) and a MDCT are the number of multiple-row detectors in the longitudinal direction. Also, the x-ray beam width is larger with the MDCT than in SDCT. For the same scan time of the gantry rotation one could acquire four times the scan volume with the MDCT compared to the SDCT. The evolution of MDCT introduced many new clinical applications and is increasing at a rapid pace. The early commercial PET/CT scanners installed in 2001 consisted of an MDCT scanner assembled next to a PET gantry. It is important to examine the multiple-row detector array design in order to understand the various scan acquisition approaches possible for PET/CT.
Multiple-Row Detector Design Arrays
PET/CT became practical with helical CT and more recently with MDCT. Although the first PET/CT scanners included the possibility of single-slice scanning devices, this approach was not used for long. By late 1998 all major CT manufacturers launched MDCT scanners capable of yielding at least four-transaxial slices per x-ray tube rotation. The key difference between the MDCT and SDCT is in the number of row detectors in the longitudinal or z direction, which enabled for increased scan volume per tube rotation and improved z-axis resolution, both of which are key to improving the three-dimentional reconstructed image. The number of transaxial slices that can be obtained per gantry rotation is determined by the data acquisition system (DAS) channels and not by the available number of physical detectors present in the system. When the number of DAS channels is less than the number of physical detector elements, the output of the elements is summed prior to sampling by the DAS channels. For example, as shown in Fig. 4.2A, on a four DAS channel scanner (mistakenly called a four detector scanner), employing a detector with 16 equal detector elements, sampling the inner four elements results in the acquisition of 4 × 1.25 mm slices per rotation. Summing the elements in groups of two, three, or four prior to sampling, results in 4 × 2.5 mm slices (Fig. 4.2B), 4 × 3.75 mm slices, or 4 × 5.0 mm slices respectfully. The number of detectors or the number of slices obtained per rotation has dramatically increased from 4 slices to 16 slices per rotation to 64 slices and beyond per gantry rotation. Fig. 4.3A shows the detector element design in a four-slice MDCT scanner. The detector array design is often categorized as uniform, nonuniform, or hybrid. In a hybrid design, thin detectors are present in the center, and thick detectors are adjacent to them. Four-slice MDCT scanners are still in use, but they have been increasingly replaced by scanners capable of obtaining 16 slices per gantry rotation. As shown in Fig. 4.3B, the detector elements in a 16-section MDCT scanner all have thin sections in the center and thick detectors in the adjacent scanner, each enabling 16 simultaneous slices per gantry rotation. Fig. 4.3C shows the detector array design of 64-slice MDCT scanners capable
of yielding 64 thin slices per gantry rotation. At present, 64-slice MDCT systems integrated with PET scanners have been installed in a variety of clinical sites by several manufacturers (13). Larger slice numbers also have been developed, and this technology continues to evolve rapidly. Such devices often have rapid rotation speeds and are well suited to demanding tasks such as noninvasive assessments of the coronary arteries, which can now be integrated with PET in the form of PET/CT.
of yielding 64 thin slices per gantry rotation. At present, 64-slice MDCT systems integrated with PET scanners have been installed in a variety of clinical sites by several manufacturers (13). Larger slice numbers also have been developed, and this technology continues to evolve rapidly. Such devices often have rapid rotation speeds and are well suited to demanding tasks such as noninvasive assessments of the coronary arteries, which can now be integrated with PET in the form of PET/CT.
Related posts:
Stay updated, free articles. Join our Telegram channel

Full access? Get Clinical Tree


