Genitourinary Cancers
Lei Dong
Jeff M. Michalski
INTERFRACTIONAL ANATOMIC VARIATIONS
INTRODUCTION
Genitourinary cancers encompass malignancies arising in the kidney, ureter, bladder, prostate, urethra, and testes. For some of these sites, radiation therapy plays a small role. On the other hand, prostate and bladder cancers account for the majority of genitourinary (GU) cancers treated by radiation oncologists. Although testicular cancer may be treated with definitive radiation therapy, the doses required to attain a very high cure rate do not require the use of image-guided radiation therapy (IGRT). Because of its high incidence and the integral role that radiation therapy holds in its management, IGRT for prostate cancer will be emphasized. The role of IGRT for a highly deformable organ such as the bladder, while important, has not been studied as extensively as it has been in prostate cancer.
Prostate cancer treatment with radiotherapy has dramatically changed over the last 15 years with the implementation of conformal1, 2, 3, 4, 5, 6, 7, 8, 9 and, more recently, intensity-modulated radiation therapy (IMRT) techniques.10, 11, 12, 13, 14 Dose escalation is commonly being performed with the advent of conformal radiotherapy (CRT). There is outcome evidence that the freedom from biochemical failure is improved in patients treated to a higher dose level.4,8,15, 16, 17 However, this increase in disease control comes at a price. The late rectal toxicity is also increased when treating the prostate to a high dose level.6,18,19 To safely achieve prostate doses >75 Gy, there is a greater demand to use tighter margins, especially posteriorly around the rectum, to reduce complications.6,19,20 Previous experience showed that a large margin in the posterior direction resulted in significant rectal bleeding when delivering prostate doses >70 Gy.21
In the current practice, wide treatment margins, derived from population-based studies, are used to ensure coverage of the disease, exposing considerable volumes of normal tissues to unwanted radiation.22,23 The use of large margins limits our ability to deliver higher tumor doses for fear of increased normal tissue toxicity. Furthermore, even with such large margins, there is a likelihood of marginal misses for outliers. The use of highly conformal modalities, such as three-dimensional (3D) CRT, IMRT, and proton therapy, may have increased the risk of marginal misses. It has been argued that IMRT, for example, is more susceptible to anatomic changes than 3D CRT.24, 25, 26 Therefore, IGRT is important in combination with highly conformal treatment techniques. With technologic improvements in in-room imaging and other more accurate target position surrogates, it is now possible to further reduce target localization uncertainties. The primary goal of this chapter is to review some of the advances and discoveries related to the management of organ motion and setup errors in prostate radiotherapy.
Although less common, bladder cancer poses unique target localization challenges for the radiation oncologist. By its nature, the bladder is a variably shaped, distensible structure that has less predictable position than surrounding organs. The amount of bladder filling is dependent on patient kidney function, baseline hydration, fluid intake, concomitant medications (such as diuretics), time since micturition, and bladder inflammation. Many of these factors, especially bladder inflammation, change over a course of radiation therapy. In a series of 90 patients receiving definitive radiation therapy for bladder cancer, 20% showed significant movement of a bladder tumor that could have affected dosimetric coverage.27
DIRECT TARGET LOCALIZATION VERSUS TARGET SURROGATES
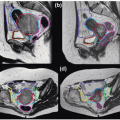
Prostate cancer radiotherapy is an ideal clinical site to examine the role of guidance technologies for radiation therapy. It is important to introduce the concept of direct target localization versus other techniques that use a surrogate to indirectly represent target position. Figure 15.1 shows a cross-section of a computed tomography (CT) image to illustrate three common prostate alignment methods. Figure 15.1A is the reference planning CT, and a treatment plan is designed to treat this anatomy. Figure 15.1B is the result of alignment using the patient’s skin marks. This is the method traditionally used to set up the patient during routine treatment because skin tattoos marked during treatment simulation are the easiest method to position the patient. Unfortunately, external skin marks are poor target surrogates for prostate. Figure 15.1B shows that both pelvic bone (blue) and prostate (red) do not match accurately with the daily CT captured during a treatment session.
An alternative target surrogate is to use pelvic bone alignment to position the patient for treatment, as shown in Figure 15.1C. This method is equivalent to using portal films or megavoltage (MV) electronic portal imaging to set up the patient.28, 29, 30, 31, 32, 33 Technology is available to use orthogonal
kilovoltage (kV) x-rays to set up patients in the treatment room. Although the quality of x-ray images is much improved over MV portal x-rays, the principles of treatment localization are the same.34,35 All of these projection x-ray techniques can detect bony structures, but soft tissue targets, such as the prostate, are invisible in these x-ray projection (two-dimensional [2D]) images. Therefore, bony landmark-based portal images or projection x-rays are not a direct target localization method, and they do not provide the positional information for soft tissue targets, such as prostate.
kilovoltage (kV) x-rays to set up patients in the treatment room. Although the quality of x-ray images is much improved over MV portal x-rays, the principles of treatment localization are the same.34,35 All of these projection x-ray techniques can detect bony structures, but soft tissue targets, such as the prostate, are invisible in these x-ray projection (two-dimensional [2D]) images. Therefore, bony landmark-based portal images or projection x-rays are not a direct target localization method, and they do not provide the positional information for soft tissue targets, such as prostate.
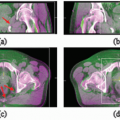
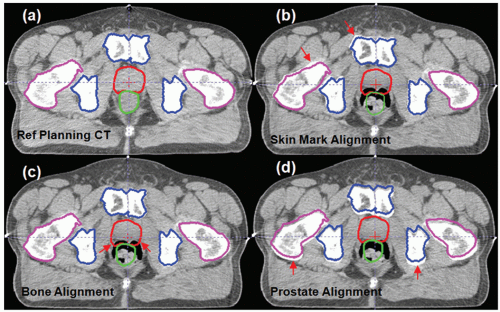 Figure 15.1. Illustration of different target or target surrogate alignment methods between the reference planning computed tomography (CT) (a) and a daily CT capturing a patient’s anatomy before treatment. In all cases, the original target contour (red: prostate) and critical structures (green: rectum; blue: pelvic bone; purple: femoral heads) are overlaid on the daily CT image based on different alignment methods: (b) the skin mark alignment method; (c) the bone alignment method; and (d) the prostate alignment method. A 3-mm posterior shift of the couch from the skin mark-aligned position is necessary to align the bony structures; however, a further 5-mm posterior shift is necessary to align the prostate. |
Due to soft tissue organ motion, the prostate position does not necessarily coincide with the bone-aligned position.36, 37, 38 The most desirable setup for prostate treatment is a direct prostate localization method based on the position of the visible prostate volume in (a) ultrasound images,39, 40, 41 (b) in-room CT images,42, 43, 44, 45, 46, 47, 48 (c) cone beam CT (CBCT) images,49, 50, 51, 52, 53 or (d) MV onboard CT images.54, 55, 56, 57 Alternatively, an accurate surrogate of the prostate volume, such as the implanted fiducials in the prostate, can be used.34,58, 59, 60, 61, 62 Figure 15.1D shows an example where an in-room CT was used to align the entire prostate volume directly.45,48 It is worth noting that the bony anatomy is not aligned in Figure 15.1D after the prostate alignment. This is because the internal anatomic relationship between the bone and the prostate has changed, most likely due to a variable rectal filling and bladder filling.
Even more so than in prostate cancer, pelvic bone alignment is an imperfect method to localize bladder cancer treatments. Even when instructed to empty their bladders prior to treatment or to drink measured amounts of fluid prior to therapy, there is considerable variability in the magnitude of patients’ bladder volumes during daily radiation therapy.63, 64, 65 The placement of fiducial markers into the bladder is technically more complex than the analogous procedure for prostate cancer. A specialized bladder clip has been developed to facilitate the identification of the limits of the boost clinical target volume (CTV) for patients receiving 3D CRT for bladder cancer.66 Unfortunately, clips do not stay fixed to the bladder wall, and most fall off within a few weeks making them unsuitable for IGRT. Shimizu et al.67 have reported the feasibility of using a single 2-mm gold marker implanted near the CTV for real-time tracking of bladder and prostate targets for external-beam radiation therapy.
CHARACTERISTICS OF ANATOMIC CHANGES
Daily Variations in Prostate Position
Many previous studies have demonstrated that significant setup uncertainties and internal organ variations are present in external-beam radiation therapy.20,36,38,68, 69, 70, 71, 72, 73, 74, 75, 76, 77, 78, 79, 80, 81, 82, 83, 84, 85, 86, 87 The major
reason for such uncertainties is the use of external (skin) marks or pelvic bone (as a surrogate) for patient setup because the skin marks or bony landmarks do not accurately represent the position of the soft tissue target, such as the prostate or the seminal vesicles.
reason for such uncertainties is the use of external (skin) marks or pelvic bone (as a surrogate) for patient setup because the skin marks or bony landmarks do not accurately represent the position of the soft tissue target, such as the prostate or the seminal vesicles.
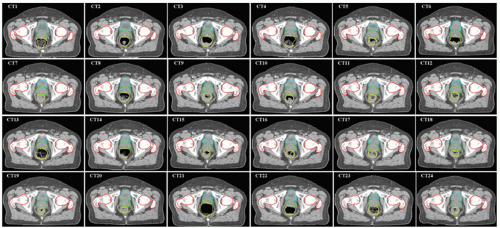 Figure 15.2. A serial in-room computed tomography (CT) imaging study shows the daily prostate positional variations as well as deformation caused by variable rectal and bladder fillings. In this figure, the pelvic bone is registered to the simulation CT. It is evident that the prostate position changes relative to the bony structure and is strongly impacted by the rectal filling on different days. |
A comprehensive review of prostate setup error and organ motion was given by Langen and Jones.36 The displacement of the prostate was summarized from 18 prior studies. Recently, Frank et al.86 studied interfractional variability in prostate and seminal vesicle (SV) positions during a course of IMRT using a CT on rails system and assessed the impact of rectal and bladder volume changes. In-room CT allows high-quality soft tissue imaging, facilitating the study of shape and position changes of the prostate relative to skin marks or bony structures. An example of a series of 24 CT images acquired during a treatment course is shown in Figure 15.2. It is clear that the prostate changes relative to nearby bony structures.
 Figure 15.3. The characteristics of target motion can be quantified from the mean and spread of a group of individual patients. The group random variation is characterized by S, whereas the important systematic variation for the group is characterized by S, which is the standard deviation of the mean positions from each patient. |
Random and Systematic Errors
Figure 15.2 also illustrates an important fact that a systematic error can occur if only one CT is used as a reference to design a treatment plan. The variation of target position can be characterized by a random (σ) and a systematic (Σ) component. For each patient, the target position can be randomly scatted around its mean value, as illustrated in small ellipsoids in the diagram of Figure 15.3. The systematic component, which is important for treatment margin determination, is characterized by the spread of mean positions for each patient in a population. A more detailed description about errors and margin recipes to account for dosimetric impact
has been provided by van Herk.22 Unfortunately, various publications usually do not report the measured deviations in the same way, and different setup techniques may also introduce additional variations in different clinics. Based on a general observation of target localization from various publications, the systematic variation (Σ) is approximately 2 to 4 mm, and the random variation (σ) is approximately 2 to 3 mm for a typical prostate treatment course with more than 30 fractions. The SV position can vary almost twice as much as the prostate because of their softer, more pliable tissue composition. The biggest variations are seen in the anterior-posterior direction (AP). The posterior margin in prostate cancer radiotherapy has the most significant impact for both the target coverage and normal tissue sparing because of the high frequency of tumor located within the peripheral zone of the prostate88, 89, 90 and the proximity of the anterior rectal wall.19,91
has been provided by van Herk.22 Unfortunately, various publications usually do not report the measured deviations in the same way, and different setup techniques may also introduce additional variations in different clinics. Based on a general observation of target localization from various publications, the systematic variation (Σ) is approximately 2 to 4 mm, and the random variation (σ) is approximately 2 to 3 mm for a typical prostate treatment course with more than 30 fractions. The SV position can vary almost twice as much as the prostate because of their softer, more pliable tissue composition. The biggest variations are seen in the anterior-posterior direction (AP). The posterior margin in prostate cancer radiotherapy has the most significant impact for both the target coverage and normal tissue sparing because of the high frequency of tumor located within the peripheral zone of the prostate88, 89, 90 and the proximity of the anterior rectal wall.19,91
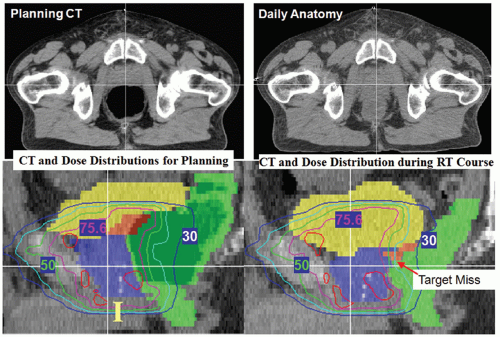 Figure 15.4. Systematic error can occur if the treatment plan is designed on an atypical anatomy, such as the case illustrated with a highly distended rectum due to gas filling (left). If the patient’s anatomy is usually different from its planned position during actual treatments, such as the empty rectum in a daily treatment (right), the posterior portion of the prostate and most of the seminal vesicles will most likely be underdosed. |
The Danger of the Systematic Error
Due to daily anatomy variations, any one of the 24 CTs shown in Figure 15.2 can become the reference planning CT. If the selected planning CT is not a typical representation of a patient’s anatomy, a systematic error will occur for the designed treatment plan. This is illustrated in Figure 15.4, in which a treatment plan designed on an anatomy with a significantly distended rectum (due to gas filling) could have a dosimetric impact if the patient’s anatomy cannot reproduce itself in subsequent treatments. The high-risk peripheral zone in the posterior portion of the prostate could be underdosed. de Crevoisier et al.92 have studied this effect and found that the incidence of biochemical failure was significantly higher among patients with distended rectums. Multivariate analysis also indicates that rectal distension and high-risk disease are independent risk factors for biochemical failure, with hazard ratios of 3.89 (p = 0.003) and 2.45 (p = 0.016), respectively. No IGRT was used for this group of patients. This study was subsequently confirmed in the Dutch trial of 68 Gy versus 78 Gy with more patients, in which IGRT was also not used.93 However, Kupelian et al.94 found that rectal distention was not an independent predictor of biochemical failure on multivariate analysis (p = 0.80) when a group of patients was treated with IGRT using ultrasound. They conclude that the use of daily image guidance eliminates errors such as rectal distention at the initial planning stage that can affect outcomes after radiotherapy. The study further illustrates the importance of using IGRT for radiotherapy of prostate cancer.
Interfractional Variability of Rectum and Bladder
The most important normal organs near the prostate target are rectum and bladder. Both organs exhibit significant day-to-day shape variations if uncontrolled during routine treatment. A recent study by Frank et al.86 showed that the rectal volume could vary >300% during treatment and was typically larger than the rectal volume measured on the planning CT scan in 61% of treatment fractions. This difference was mainly due to the bowel preparation procedure at treatment simulation to avoid extensive rectal gas filling, which may strongly
impact the treatment outcome. Figure 15.5 shows the variation of rectum volumes during a 42-fraction treatment course for 15 patients. The plots showed the ratio of the rectum volume during daily treatment to the rectum volume at the simulation. It is evident that the rectum volume varies significantly, which implies that there is a lack of confidence in the dose-volume histograms for the rectum designed at the time of treatment simulation.
impact the treatment outcome. Figure 15.5 shows the variation of rectum volumes during a 42-fraction treatment course for 15 patients. The plots showed the ratio of the rectum volume during daily treatment to the rectum volume at the simulation. It is evident that the rectum volume varies significantly, which implies that there is a lack of confidence in the dose-volume histograms for the rectum designed at the time of treatment simulation.
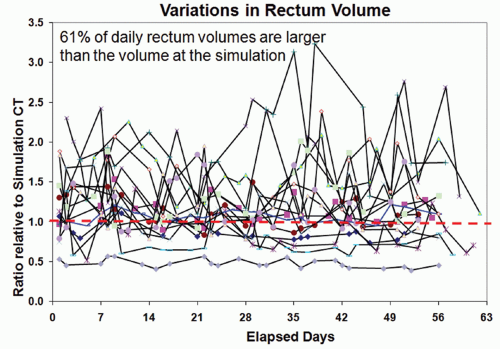 Figure 15.5. Variations in rectum volume for 15 patients who had serial computed tomography (CT) imaging during their course of treatment. The vertical axis represents the ratio of rectal volume relative to the volume at the treatment simulation.86 |
 Figure 15.6. Variations in bladder volume for 15 patients who had serial computed tomography (CT) imaging during their course of treatment. The vertical axis represents the ratio of bladder volume relative to the volume at the treatment simulation.86 |
Similarly, the bladder volume also varies significantly during the course of treatment as a result of variable bladder filling at the time of treatment. Figure 15.6 shows the variations in bladder volume relative to its initial volume at the time of treatment simulation. The data were from the same patient series as reported by Frank et al.86 In this cohort of patients, a full bladder was requested at the time of treatment simulation so that the bladder would be more visible to be used as a reference for daily ultrasound-guided alignment.86 Unfortunately, most patients do not conform to a full-bladder requirement at the time of treatment due to management difficulties in keeping treatment schedule on time. The bladder volume during daily treatment is smaller than the bladder volume at the time of simulation 90% of time. This systematic difference could have a significant impact on the reported dose volume constraints for bladder toxicity.
In fact, daily variations of rectum and bladder introduce significant uncertainties in dose variations to these organs.
Using helical tomotherapy, Kupelian et al.94 found significant daily variation in rectal and bladder doses, mostly because of variations in volume and shape of these organs. Image guidance may improve targeting of the prostate; however, it does not take into account the variation in rectal and bladder position and its impact on dose.
Using helical tomotherapy, Kupelian et al.94 found significant daily variation in rectal and bladder doses, mostly because of variations in volume and shape of these organs. Image guidance may improve targeting of the prostate; however, it does not take into account the variation in rectal and bladder position and its impact on dose.
Daily Variations in Bladder Cancer Position
Due to urinary filling, the positions of the anterior and cranial aspects of the bladder vary considerably. Anisotropic margins are necessary due to the independent movement of the different aspects of the bladder wall. In one study where the intent was to encompass the entire bladder for treatment, the margins necessary to cover >87% of patients’ bladders following a simulation with an empty bladder were 2.4 cm in anterior, 1.1 cm in posterior, 3.5 cm in cranial, 0.5 cm in caudal, and 1.3 cm in lateral directions.65 When less than the whole bladder is the target, the margin necessary to encompass the CTV is very dependent on the location of the tumor in the bladder.63 In a series of 21 bladder cancer patients, Lotz et al.63 found that tumors of the anterior or cranial aspect of the bladder moved considerably more than tumors elsewhere in the bladder. Interestingly, the shape of the actual gross tumors did not change, and nearly all the uncertainty in target localization was related to variability in the shape of the whole bladder. Cancers of the bladder are stiffer and less deformable than the healthy bladder wall.
INTRAFRACTIONAL ANATOMIC VARIATIONS
Most image-guided procedures acquire target information prior to radiation delivery and assume that a patient’s anatomy will remain unchanged during the actual treatment. Therefore, intrafractional target motion is usually considered as a residual error for the IGRT technique. However, both the image-guided patient setup and the treatment delivery may take several minutes, which may allow the position of the target to change during treatment. Therefore, uncorrected intrafractional variation limits further margin reduction for pretreatment-based IGRT. This is particularly problematic for very long treatment sessions that could be encountered with IMRT or stereotactic radiation therapy.
INTRAFRACTIONAL TARGET POSITIONAL CHANGES MEASURED BY X-RAY IMAGING AND ULTRASOUND
It is well known that the prostate moves dynamically as a result of normal rectal peristalsis, bladder filling, breathing, or pelvic muscle contractions or relaxation. Most early intrafractional motion studies have used electronic portal imaging devices (EPIDs),95, 96, 97, 98, 99 fluoroscopic kV x-ray imaging,75,100, 101, 102 or ultrasound,103, 104, 105 because these are the most commonly used daily localization techniques.
Shimizu et al.67 used posttreatment fluoroscopy with implanted fiducials and found that 81% of the patients had shifts <3 mm and 98% had shifts <5 mm. Nederveen et al.95 used cine electronic portal imaging to detect implanted markers during prostate treatment. They found that the motion of the prostate was greatest in the caudal-cranial and AP directions; additional margins of 2 to 3 mm may be required to account for intrafraction prostate motions. Similarly, Madsen et al.96,106 found that the mean prostate motion was approximately 2 mm in their pilot study of hypofractionated stereotactic radiotherapy for prostate cancer. McNair et al.99 used pre- and posttreatment electronic portal images to study the change in the position of implanted markers. They found that the independent intrafraction prostate motion was -0.1 ± 1.2 mm, 0.5 ± 2 mm, 0 ± 2.5 mm in the right-left, superior-inferior, and AP directions, respectively. Again, the largest movement is in the AP direction, with a standard deviation of 2.5 mm.
INTRAFRACTIONAL TARGET VARIATIONS MEASURED BY CINE MAGNETIC RESONANCE IMAGING
Several recent studies used magnetic resonance imaging (MRI) to study prostate motion. Padhani et al.107 used cine MRI imaging for 55 patients and reported that 16% of them had prostate movement >5 mm. Ghilezan et al.108 used cine MRI for prostate imaging and segregated the patients into two groups, those with full and those with empty rectums. The empty rectum group showed little prostate movement over 20 minutes, whereas the full rectum group frequently had prostate shifts >3 mm.
Mangar et al.109 evaluated intrafractional motion in bladder cancer patients using cine MRI. They observed a linear relationship of bladder filling to wall displacement over a 20-minute period of observation. As expected, the anterior and superior aspects of the bladder moved forward and up as the bladder filled. There was also some downward motion of the inferior bladder wall with filling.
INTRAFRACTIONAL PELVIC ANATOMY CHANGES MEASURED BY IN-ROOM COMPUTED TOMOGRAPHY IMAGING
Although prostate motion can be measured using implanted fiducials, these markers are not typically implanted in the SV or critical normal structures, such as rectum or bladder. Limited markers do not represent the entire 3D soft tissue targets, which can deform in shape. A recent study by de Crevoisier et al.110 used in-room CT on rails to capture and compare patients’ 3D anatomy before and immediately after one IMRT session in 46 patients. During one treatment fraction (21 ± 4 minutes), both the prostate and SVs showed statistically significant systematic trends in the superior and anterior directions of the patient’s anatomy. The net increase in bladder volume was huge (127 ± 79 cm3), yet this change did not translate into large target displacements. The one standard deviation for prostate and SV motion was 2.9 mm and 4.1 mm, respectively. A few patients had displacements as large as 8.4 mm and 6 mm. These large displacements were strongly correlated (p <0.001) with large rectal volume increases caused by gaseous buildup in the rectum.
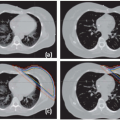
An example of a patient’s anatomy change is shown in Figure 15.7, in which CT scans of a patient before treatment (left) and immediately after the IMRT fraction (right) are shown. The red arrows in Figure 15.7 (left) indicate the direction of soft tissue movement from the pretreatment position to the posttreatment position, although the transition between the two statuses may not be as smooth as shown in the figure (MRI cine imaging indicates that the large prostate motion is often a transient effect). The directions of soft tissue changes
were calculated by a deformable image registration algorithm.111 Figure 15.7 indicates that most soft tissues moved toward anterior and superior directions. Both the rectal and the bladder filling differences are obvious, which moved the prostate position by >1 cm in this example.
were calculated by a deformable image registration algorithm.111 Figure 15.7 indicates that most soft tissues moved toward anterior and superior directions. Both the rectal and the bladder filling differences are obvious, which moved the prostate position by >1 cm in this example.
 Figure 15.7. Infrafractional anatomy change before and after one intensity-modulated radiation therapy (IMRT) fraction.110 The in-room computed tomography (CT) on rails captured the patient’s three-dimensional anatomy before the start of treatment (left) and immediately after the IMRT delivery (right). The duration between the two CT scans was 22 minutes. It can be seen that significant rectal gas buildup changed the position and shape of the prostate and seminal vesicles. The red arrows show the direction of soft tissue movement after performing a deformable image registration between the two CT data sets. |
In a companion study, the dosimetric impact of intrafractional motion of the prostate and SV was studied by Melancon et al.112 They found that a 3-mm intrafractional margin may be sufficient to cover the movement and deformation of the prostate; however, substantial SV misses in 10% to 15% of the patients and moderate misses in an additional 10% to 15% of the patients were observed. Rectal filling was correlated with a decrease in percentage-volume of the SV receiving 75.6, 70, and 60 Gy (p <0.02). Melancon et al.112 also found that dosimetric variation of the pelvic anatomy during the treatment fraction was the result of multiple factors, including rectal filling, bladder filling, and muscular tension. However, none of the patients exhibited all of the factors. This makes control of intrafractional anatomic variation difficult. Control of one factor, such as rectal volume, during the treatment fraction may not ensure that target organs are properly covered during the treatment fraction.
In a study of tumor motion and deformation of bladder cancers, Lotz et al.63 used in-room CBCT to quantify bladder tumor motion during a course of external-beam radiation therapy. The gross tumor volumes (GTVs) moved most in the cranial-caudal and AP directions over the 4- to 5-week course of treatment. Standard deviations of translational movements ranged from 0.1 to 0.9 cm. Shape changes in the GTV made only a small contribution to the overall uncertainty in tumor position.
REAL-TIME MONITORING OF PROSTATE POSITIONS BY IMPLANTED ELECTROMAGNETIC TRANSPONDERS
Electromagnetic transponders implanted within the prostate are a recent technical development that allow near real-time observation of prostate motion while the patient is in a treatment position.113, 114, 115, 116 The system uses alternating current (AC) magnetic fields to induce and detect signals from permanently implanted “wireless” Beacon transponder devices (Calypso Medical Technologies, Inc., Seattle, Wash). Each Beacon transponder is briefly excited at its distinct resonant frequency, and the software interprets the response signal to solve for the unknown coordinates of each Beacon’s position. The system can be used for both pretreatment interfractional alignment and real-time monitoring during treatment delivery.115,117
Compared to other imaging techniques, the implanted electromagnetic transponders have a high temporal resolution,
which can be used to monitor prostate position continuously during treatment delivery. The system was used at five centers to position 41 patients over a full course of therapy.115 The study found that the continuous motion of the prostate was unpredictable and varied from persistent drift to transient rapid movements. Displacements >3 and >5 mm for cumulative durations of at least 30 seconds were observed during 41% and 15% of treatment sessions, respectively. Figure 15.8 shows some typical prostate movement patterns during 9 to 11 minutes of treatment.
which can be used to monitor prostate position continuously during treatment delivery. The system was used at five centers to position 41 patients over a full course of therapy.115 The study found that the continuous motion of the prostate was unpredictable and varied from persistent drift to transient rapid movements. Displacements >3 and >5 mm for cumulative durations of at least 30 seconds were observed during 41% and 15% of treatment sessions, respectively. Figure 15.8 shows some typical prostate movement patterns during 9 to 11 minutes of treatment.
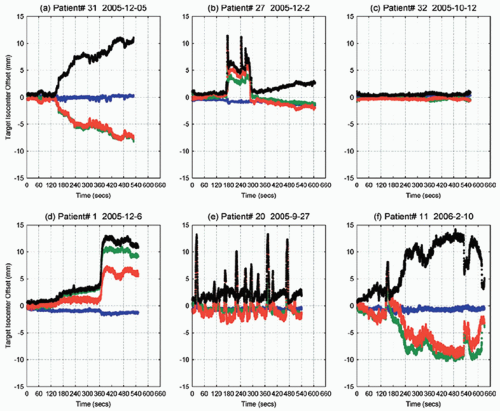 Figure 15.8. Examples of behaviors observed in the continuous tracking of prostate positions by implanted electromagnetic transponders: (a) continuous target drift; (b) transient excursion; (c) stable target at baseline; (d) persistent excursion; (e) high-frequency excursions; and (f) erratic behavior. Red: vertical, green: longitudinal, blue: lateral, black: vector length. (From Kupelian P, Willoughby T, Mahadevan A, et al. Multi-institutional clinical experience with the calypso system in localization and continuous, real-time monitoring of the prostate gland during external radiotherapy. Int J Radiat Oncol Biol Phys. 2007;67:1088-1098, with permission.) |
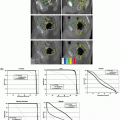
In a recent study, Li et al.118 analyzed 1,267 tracking sessions in 35 patients with the Calypso electromagnetic transponders. Composite dose distributions incorporating motion blurring were calculated by convolving static IMRT plans with corresponding motion probability functions. For prostate planning target volume (PTV) margins of ≥2 mm, intrafraction motion did not compromise prostate dose coverage for either the patient population or individual patients. Figure 15.9 shows the averaged motion for all sessions and all patients. The error bars represent the one standard deviation in three directions, which is, again, approximately equal to 2 mm—very close to the measurements using projection x-rays or cine MRI. Figure 15.9 nicely showed that prostate motion is perhaps the smallest during the first 2 minutes of the treatment, which implies that the time on table is an important factor to prevent significant intrafractional motion. One drawback of this study is that the composite dose distribution by using the motion probability function did not consider the deformation of the prostate target, which usually occurs with large displacements (see Fig. 15.7). In addition, SV movement cannot be assessed because the SVs are too small to be implanted with typical fiducial markers.
In a study by Pierburg et al.,119 the authors found that margins as small as 4 mm may have a dosimetric impact with loss of prescription coverage due to nonrigid prostate deformation and/or rotational shifts of the gland that are not corrected with simple translational corrections. Rotational changes may be exaggerated when the fiducial markers are placed eccentrically within the prostate or when systematic displacements due to large variations in rectal or bladder filling are present.
 Figure 15.9. Tracking data averaged over all sessions and all patients for each time, with times synchronized among sessions. Error bars denote one standard deviation (SD) of the individual session data about the mean. It is worth noting that variations are smaller during the first 2 minutes of treatment. (From Li HS, Chetty IJ, Enke CA, et al. Dosimetric consequences of intrafraction prostate motion. Int J Radiat Oncol Biol Phys. 2008;71:801-812, with permission.) |
IMAGE-GUIDED APPROACHES FOR TREATING PROSTATE AND BLADDER CANCER
Various image-guided approaches have been proposed to assist the daily fractionated radiotherapy of prostate cancer. This section focuses primarily on in-room image guidance technologies and methods that have emerged since the mid-1990s and are undergoing continued evolution.
STEREOSCOPIC IMAGING FOR DAILY SETUP
2D radiographic imaging is perhaps the most commonly used technique for pretreatment image guidance to align the patient relative to radiation beams. This technique is based on the stereoscopy principle that a 3D (rigid) object can be identified from a pair of 2D images. MV electronic portal imaging is a classic example.120, 121, 122, 123, 124 MV imaging, including the traditional x-ray films, uses therapy x-ray beams to verify patients’ setup positions by taking x-rays from two orthogonal gantry angles (typically in the AP and straight lateral angles). A patient’s lateral position can be determined from the AP image; the AP position can be determined from the lateral image; and the superior-posterior position can be determined from both images.
In addition to patient alignment, MV imaging is also used to verify the shape of the treatment portals in 3D CRT treatments.123,125, 126, 127, 128


Related posts:

Stay updated, free articles. Join our Telegram channel
Full access? Get Clinical Tree
