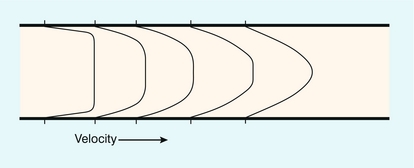
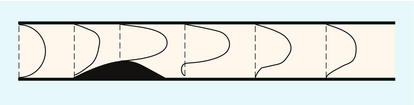
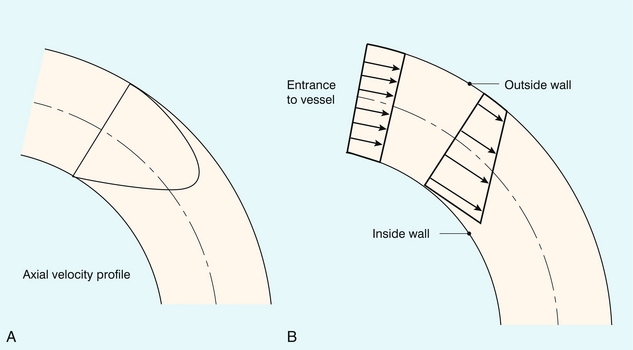
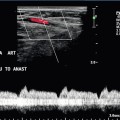
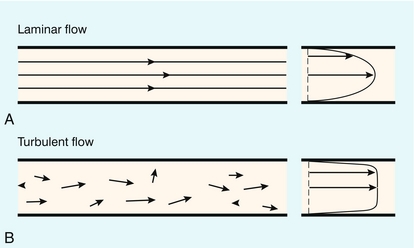
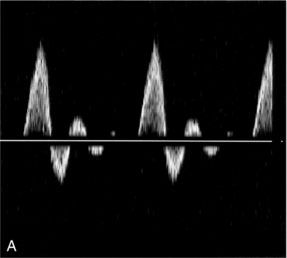
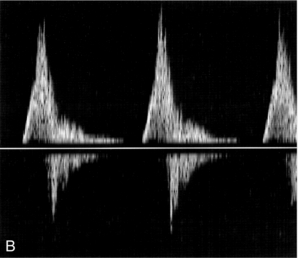
Chapter 2 This section describes the simple principles of blood flow which are of value in understanding the role of Doppler and for performing vascular ultrasound examinations. The underlying principles of fluid mechanics applied to the flow of blood are complex, and discussed in detail in a number of texts including those by McDonald,1 Caro et al.,2 Strackee & Westerhof3 and chapters in the Doppler ultrasound books by Evans et al.4 and Taylor et al.5 The two essential flow states are laminar and turbulent. At low velocity, fluid flow is laminar (Fig. 2-1A). This is characterised by the motion of fluid along well-defined paths called streamlines. At very high velocities, fluid flow is turbulent (Fig. 2-1B); particular elements of the fluid no longer travel along well-defined paths, and there is a random component to the motion of the fluid. FIGURE 2-1 (A) Laminar flow consists of flow along well-defined streamlines; the velocity profile in a long straight tube under conditions of steady flow is parabolic. (B) The velocity vector magnitude and direction in turbulent flow have random components; the time-averaged profile is blunt. where ρ is the fluid density, L is the vessel diameter, V is the mean velocity and μ is the fluid viscosity. For a wide variety of fluids the transition to turbulence takes place at a value of Re of about 2000. For flow in which Re is about 2000 the fluid flow will alternate between turbulent and laminar. When velocity is increased so that the Re is above the critical value, turbulence will take a small amount of time to develop. During pulsatile flow it is therefore possible for the flow to be laminar at values of Re higher than the critical value, because turbulence does not have time to develop before the blood velocity has decreased. The effect of the flow state on the Doppler waveform is illustrated in Figure 2-2. Doppler spectra are shown from the normal femoral artery in Figure 2-2A; in this case flow is laminar. Within the sample volume the blood velocity magnitude and direction are similar for all of the red cells, hence the spectral width is low and the waveform outline is smooth. In the post-stenotic region of a diseased artery the Doppler waveform is more complex (Fig. 2-2B). The blood which was at rest in the poststenotic region during diastole is accelerated through the sample volume. For this blood, flow is laminar and the initial up-slope of the waveform has a smooth outline with low spectral width, whereas blood which was in the prestenotic region during diastole has to pass through the stenosis, producing disturbed and turbulent flow within the sample volume. The variation in velocity magnitude and direction which this produces results in an increase in the spectral width (Fig. 2-2B), and the waveform outline is no longer smooth. FIGURE 2-2 Femoral artery Doppler waveforms. (A) From a normal segment; the waveform has a smooth outline and the spectral width is low. (B) From the poststenotic region; in the early systolic phase the waveform has a clearly defined outline associated with the passage of blood which was at rest in the poststenotic region during diastole through the insonation site. In the later part of the waveform, blood which has passed through the stenosis has developed turbulent, disturbed flow with increased velocity. This appears as a region in which there is spectral broadening, with Doppler shifts above and below the baseline and high-frequency spikes. A summary of points concerning flow state is given in Box 2.1. This is a simple expression which dem+onstrates that there will be an interchange between the different types of energy within the circulation. In the human body, however, the flow is not steady and the above equation must be modified slightly to account for the energy required to accelerate the fluid.4 Energy is conserved in this simple ideal lossless system. In the circulation, energy is lost in the form of heat through viscous effects, manifested through friction of the blood at the vessel wall and between adjacent layers of blood. Energy losses are highest in the region of a stenosis, as there is considerable friction during turbulent flow and vortex motion. The most common application of Bernoulli’s equation is in the prediction of pressure drop across a stenosed cardiac valve.6 The equation may be simplified to: where V is the measured velocity in m/s, and P is the pressure drop in mmHg. Points concerning pressure and energy are summarised in Box 2.2. Strictly speaking, a parabolic velocity profile only applies to steady laminar flow in a long straight tube, when there is maximum velocity in the centre of the vessel and zero velocity at the edge of the vessel (Fig. 2-1A). The profile is radially symmetric, which means that it is the same regardless of which diameter is considered. The shape of the profile is an exact mathematical equation, that of a parabola. The velocity profile in a vessel is strongly influenced by the distance of the region of interest from the entrance to the vessel. For a long straight vessel, when there is steady flow, the profile is initially flat at the entrance to the vessel. With increasing distance from the entrance the profile will change, becoming parabolic at a distance called the inlet length (Fig. 2-3). For steady flow, a gradual narrowing taper will tend to sharpen the velocity profile. At regions where the cross-sectional area of the vessel increases, an adverse pressure gradient in the direction of flow is created; that is, there is a pressure decrease in the direction of flow, which tends to retard the flow. For the central high-velocity region, the high momentum opposes this, but at the edge of the vessel the velocities are low and the direction of motion near the wall will reverse if there is a sufficiently rapid increase in vessel cross-sectional area with distance. The phrase ‘flow separation’ is often used to describe this phenomenon; that is, the high-velocity central jet is located next to a region in which the flow is of low velocity and recirculating. The production of vortices in these circumstances was noted above; both the central jet and vortices die out after a length equivalent to a few diameters and laminar flow is re-established. Figure 2-4 shows the velocity profiles in the region of a small stenosis. When the expansion is less severe, such as a gradually widening taper, the velocity profile simply becomes more blunted. Figure 2-5 shows that the velocity profile for steady flow in a curved vessel is skewed towards the outer wall when the entrance profile is parabolic, and skewed towards the inner wall when the entrance profile is flat.
Haemodynamics and Blood Flow
Principles of Blood Flow
TYPES OF FLOW

PRESSURE AND ENERGY

VELOCITY PROFILES
Entrance Effect
Vessel Narrowing
Vessel Expansion
Curved Vessels