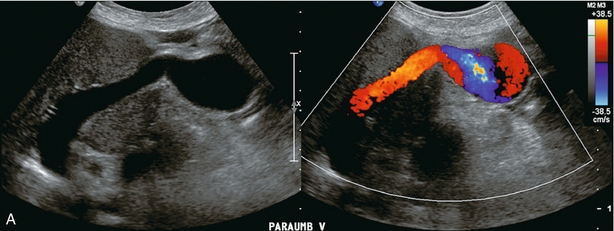
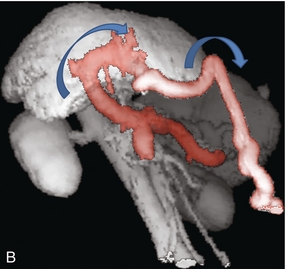
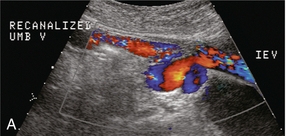
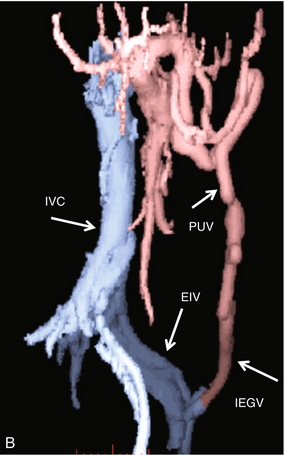
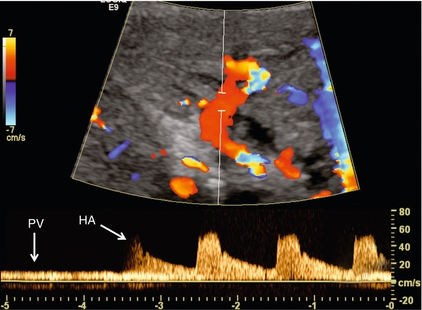
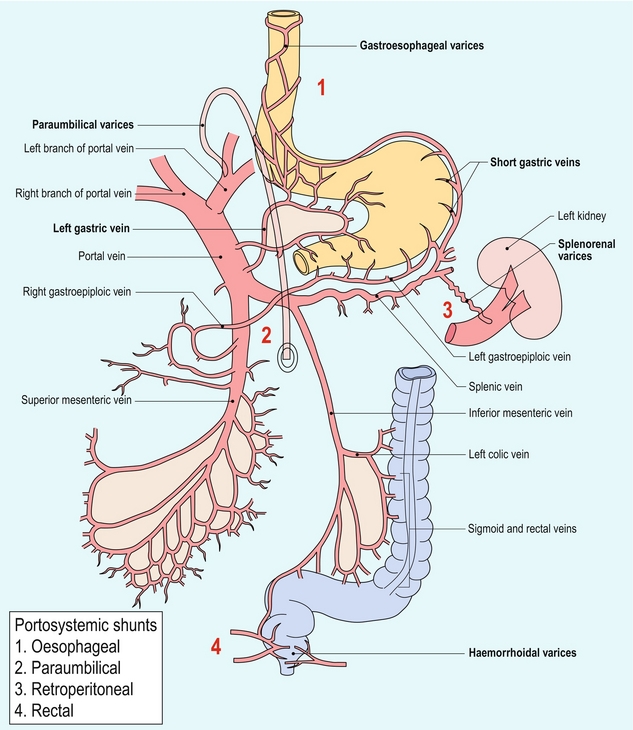
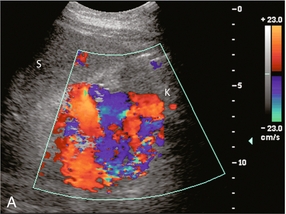
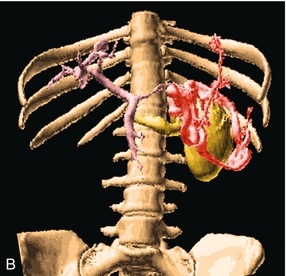
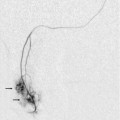
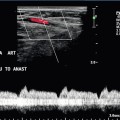
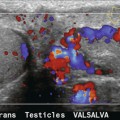
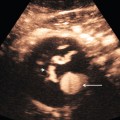
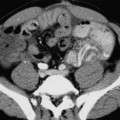
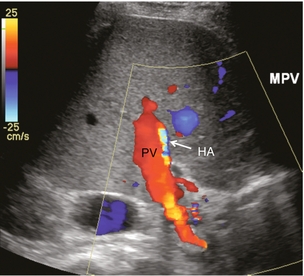
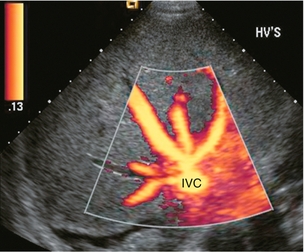
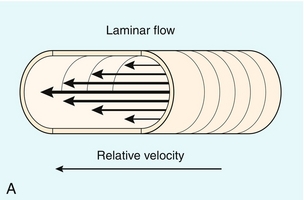
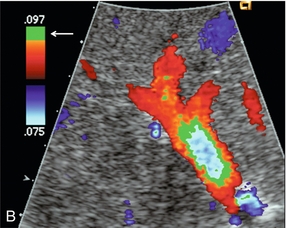
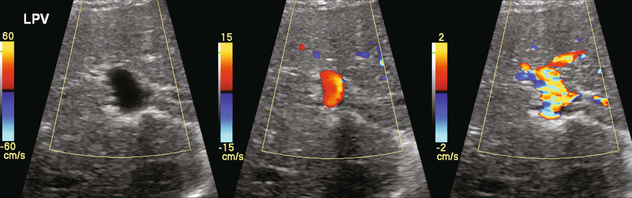
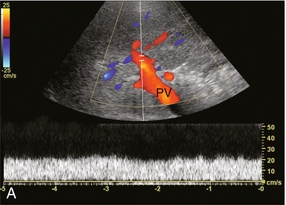
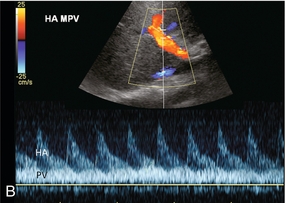
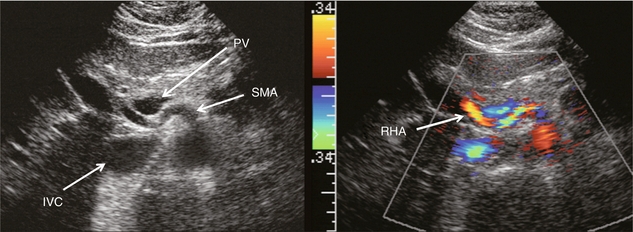
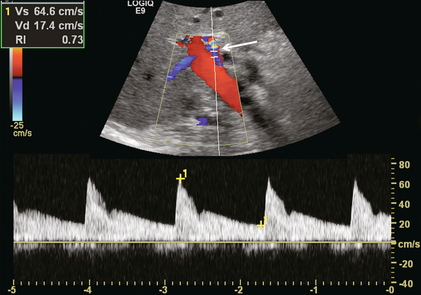
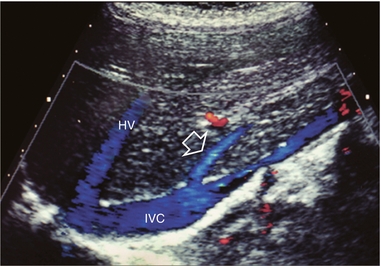
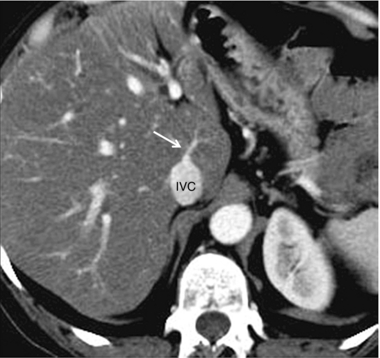
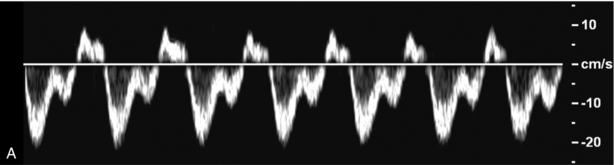
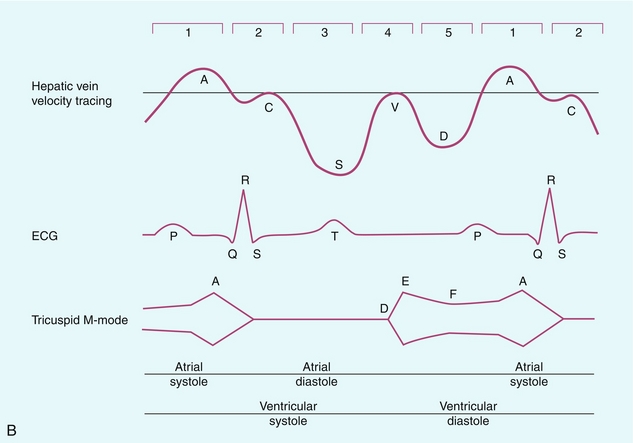
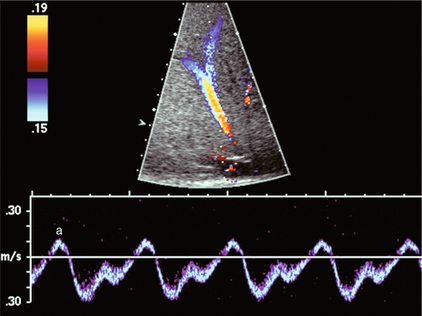
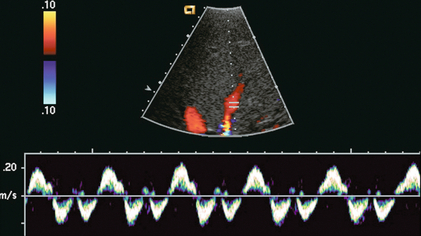
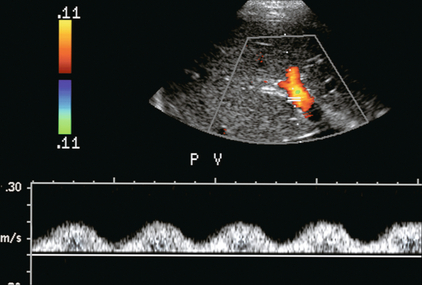
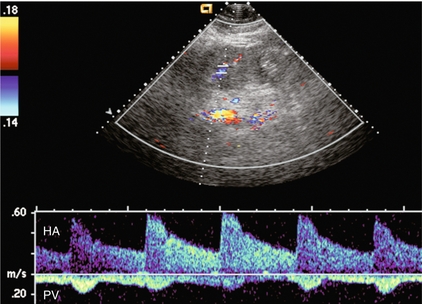
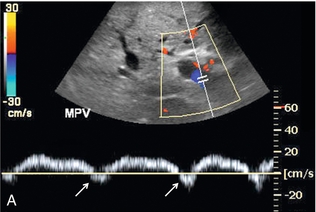
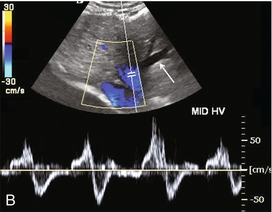
Chapter 8 There have been impressive advances recently in the application of ultrasound contrast medium to liver imaging; but these agents are not universally available. Researchers have shown the benefits of microbubble-enhanced lesion detection and characterisation.1 Unfortunately governing agencies across the world have not uniformly endorsed these agents and there is limited ability and/or interest to apply them in many centres. This chapter is, therefore, written for those ultrasound practitioners who do not have access to or routinely use intravenous ultrasound contrast. For discussion of hepatic applications of sonographic contrast please refer to Chapter 17. The standard hepatic US examination should include a brief survey with spectral and colour Doppler (Box 8-1). This serves a two-fold purpose: first, it adds valuable haemodynamic information to the evaluation of the liver, in most cases reinforcing normality, but occasionally revealing an unexpected finding. Second, by consistently integrating Doppler into the routine hepatic examination, sonologists will continually refine their Doppler skills so that when presented with significant haemodynamic abnormalities, they can be identified quickly and evaluated accurately. Although a cursory Doppler survey of the hepatic vasculature may add 2–3 min to an abdominal examination, regular practice enables the examiner to become more adept at perceiving abnormalities, dialling in the settings to optimise the display, and more expert in analysing the results. Not infrequently altered blood flow may be the only abnormal finding to suggest the presence of pathology. The Doppler survey may reveal distortion of vascularity around a subtle lesion of which the examiner was otherwise unaware. It may display hypervascularity of an observed lesion and this awareness may increase diagnostic certainty. The use of colour Doppler in the hepatic examination also helps to differentiate vascular from non-vascular structures. Care must be taken, however, to ensure that equipment settings are appropriate: if gain, pulse repetition frequency, and filtration are not optimised, slow flow can be missed in vascular structures or artifactual colour can be painted into non-vascular structures.2 The patient is scanned in a supine or left lateral decubitus position. Depending on vessel orientation and body habitus, the portal vein and hepatic artery are best interrogated by either a subcostal approach pointing posterocephalad, or a right intercostal approach pointing medially. Since the portal vein and hepatic artery travel together in the portal triad, along with the common duct, these approaches should satisfactorily interrogate both vessels (Fig. 8-1). FIGURE 8-1 Oblique colour Doppler image of the porta hepatis. The hepatic artery (HA) accompanies the portal vein (PV) and bile ducts. With the colour scale appropriately set for the slow flow within the portal vein, hepatic arterial flow projects as colour aliasing. Scanning the left hepatic and middle hepatic veins is best accomplished from a substernal approach. The transducer should be oriented transversely, pointing posterocephalad, and swept up and down across the liver. For the right hepatic vein, a right lateral intercostal approach is used with the transducer pointed cephalad. If the patient’s liver extends below the costal margin during inspiration, a subcostal transverse view, angled cephalad, is useful for the confluence of the hepatic veins (Fig. 8-2). FIGURE 8-2 Power Doppler transverse view of the liver with a subcostal approach. This crow’s foot appearance of the hepatic veins shows the convergence of five hepatic veins onto the IVC. The presence of accessory branches is very common. Some patients, when asked to hold their breath perform a vigorous Valsalva manoeuvre. This results in increased intrathoracic pressure which will impede venous return, affecting flow profiles and velocities, particularly in the hepatic veins and inferior vena cava (IVC). This will often alter the hepatic vein profile, creating the perception of hepatic venous outflow obstruction (HVOO). Scanning must be performed in neutral breath-hold to avoid producing a misleading Doppler tracing.3 Varying the width of the sample volume can be advantageous when examining the porta hepatis. If the examiner is screening for vascular patency or trying to locate a specific vessel, a large sample volume is appropriate for rapid interrogation of a broad area; for example, when ruling out hepatic artery thrombosis in a liver transplant recipient. If, however, the examiner wants to precisely characterise flow within a vessel and evaluate waveform detail, then the sample volume must be small and placed near the centre of the vessel, thereby interrogating the highest velocity lamina (Fig. 8-3). A wide sample volume, by incorporating the slower lamina along the wall together with the faster central lamina, will broaden the spectral Doppler tracing and mimic turbulence.4 FIGURE 8-3 (A) Schematic representation of normal laminar flow. The velocity of fluid along the wall of a vessel is slowed because of frictional forces causing drag; therefore its relative velocity is less than that at the centre of the vessel. The travelling wave assumes a parabolic form. (B) Colour Doppler image of portal vein flow with a green tag assigned to high velocities towards the transducer. Additionally the pulse repetition frequency (velocity scale) is set low to cause aliasing. This distortion of the colour-encoding thus permits a display of several velocity lamina. Note the transition from the slowest velocities, red through orange, green and blue from the periphery to the centre of the vessel. The actual velocity displayed on a spectral Doppler tracing is, therefore, dependent on sample volume placement relative to these various velocity lamina. A small, centrally placed sample volume will display a higher measured velocity than a peripherally placed sample volume. Differentiating a patent from a thrombosed vessel is critically dependent on Doppler settings and transducer frequency. Gain, filtration, and pulse repetition frequency settings must be adjusted throughout the study. The settings must be carefully reviewed if one is about to make a diagnosis of thrombosis (Fig. 8-4). FIGURE 8-4 Series of colour Doppler images of the left portal vein. The only setting changed among these three images is the pulse repetition frequency (colour Doppler scale). On the first image with scale set high (60 cm/s), no colour is displayed within the portal vein which therefore could be interpreted as thrombosed. The second image with scale set appropriately (15 cm/s), relative to normal portal velocity, reveals appropriate colour saturation and confirms patency. On the final image with scale set too low (02 cm/s), colour aliasing distorts the image. Patients referred for right upper quadrant (RUQ) US typically have elevated liver enzymes of unknown aetiology incidentally detected on screening blood tests. Although sonographic imaging of the liver may reveal diffuse abnormality or focal disease, the majority of these examinations are normal (Box 8-2). Doppler US, however, may reveal flow alterations caused by inflammatory disease, neoplasm, or other disorders which are too subtle or too small to cause perceptible imaging irregularities. Being able to differentiate flow profile and velocity alterations in the hepatic vasculature between those caused by hepatic versus cardiac disease will help identify those patients needing additional cardiac evaluation versus those who would benefit from liver biopsy. Additionally, the identification of a Doppler abnormality can define those patients who would benefit from further hepatic imaging with computed tomography (CT), magnetic resonance imaging (MRI), or angiography. When portal hypertension is suspected, Doppler US characterises changes in portal haemodynamics and identifies pathways of portosystemic collateralisation.5 Doppler can confirm the patency of surgical or percutaneous shunts which have been performed in patients with bleeding oesophageal varices. Identification and differentiation of bland thrombus from tumour thrombus within the hepatic or portal veins by Doppler has significant implications for medical, surgical or ablation treatment planning. Doppler US plays a key role in the postoperative monitoring of liver transplant recipients, confirming vascular patency. The role of Doppler in the characterisation of parenchymal liver disease and screening for hepatocellular carcinoma (HCC) is controversial. Marked alterations in flow profiles and velocities can be seen and have been described in the literature.6–9 It is rare, though, to be able to precisely pinpoint a specific diagnosis based on Doppler findings since there is considerable overlap in velocity and waveform alterations among various disease states. The portal vein is formed by the confluence of the splenic and superior mesenteric veins. It supplies around 70% of incoming blood volume to the liver. It is accompanied by the hepatic artery and common bile duct which together make up the portal triad (Fig. 8-1). The triad has echogenic margins as it enters the liver, due to the intrahepatic extension of Glisson’s capsule and presence of perivascular fat. After forming the right and left branches, these vessels progressively branch to supply the liver segments as defined by Couinaud whose US appearance was described by La Fortune.10 The Couinaud system divides the liver vertically along the planes of the hepatic veins, and horizontally along the planes of the left and right portal veins. A thorough understanding of this anatomy is critical for surgical planning in liver resection and living related donation. Anatomic variations of the portal vein are rare. The portal vein Doppler flow profile in a fasting patient has a relatively constant velocity of approximately 18 cm/s (± 5 cm/s) towards the liver (hepatopetal) (Fig. 8-5A). The flow velocity is uniform because cardiac pulsation is damped by the splenic parenchyma and the capillaries of the gut at one end of the portal system and by the liver sinusoids at the other. Slight phasicity may be seen on the portal spectral tracing due to respiration and a mild degree of periodicity may be present, due either to retrograde pulsation transmitted from the right heart via the hepatic vein (A-wave) or to the hepatic artery systolic pressure wave. Because these brief pressure surges into the liver transiently elevate intracapsular pressure, they increase resistance to portal venous inflow and, thereby, effect a momentary slowing of antegrade flow in the portal vein (Fig. 8-5B).11 Although some periodicity may be expected in portal vein flow, marked velocity variation or reversal of flow, even if brief, should be considered an abnormal finding.12 The blood in the portal vein is relatively deoxygenated since it comes to the liver after perfusing the intestine and spleen. It is rich in nutrients after a meal, and arrives at the liver to be processed by the cells of the hepatic sinusoids. FIGURE 8-5 (A) Spectral Doppler tracing of normal portal vein flow. The flow velocity of 20 cm/s is relatively uniform and in a hepatopetal direction. (B) Spectral Doppler tracing of normal portal vein and hepatic artery flow. Slight periodicity is present in this patient’s portal vein tracing. The dip in antegrade velocity coincides with hepatic arterial systole. The comparison of the two flow profiles is achieved by interrogating with a wide sample volume that encompasses both the artery and the vein in one tracing. Velocity variation may also occur due to pressure change with the hepatic vein A-wave but those are harder to compare since the vessels are separated and cannot be simultaneously interrogated. The hepatic arterial blood supply arises solely from the celiac axis in approximately 75% of individuals. The celiac trifurcates into the splenic artery, left gastric artery and common hepatic artery. After the take-off of the gastroduodenal artery, the common hepatic is then called the proper hepatic artery. It enters the liver alongside the portal vein (Fig. 8-1) where it divides into left and right hepatic arteries and from there branches into the Couinaud segments. There are, however, numerous variants of hepatic artery anatomy. These include accessory vessels which exist in conjunction with normal branches of the hepatic artery and replaced arteries which make up the sole supply of a segment or lobe. For example, a replaced right hepatic artery arising from the superior mesenteric artery (SMA) is the sole blood supply to the entire right lobe of the liver in 15% of the population.13 In a slender patient, colour Doppler US may be able to identify the replaced right hepatic artery behind the main portal vein as it courses towards the right lobe from the SMA (Fig. 8-6). A branch of the left gastric artery may supply the left lobe of the liver. This occurs less frequently and is more difficult to identify by Doppler US because of its small size. FIGURE 8-6 Transverse image of the mid-abdomen at the level of the superior mesenteric artery origin. A tubular structure is seen coursing from the superior mesenteric artery (SMA) to the right lobe of the liver, between portal vein (PV) and the inferior vena cava (IVC). The addition of colour Doppler identifies this tubular structure as a vessel. An arterial signal on spectral Doppler, identification of its SMA origin and a course towards the right lobe of the liver confirm this to be a replaced right hepatic artery. The normal proper hepatic artery in a fasting patient has a low-resistance Doppler flow profile, [about 60–70% resistive index (RI)] (Fig. 8-7). During systole, the velocity is approximately 30–60 cm/s; while during diastole, it normally slows to approximately 10–20 cm/s. Normal systolic acceleration time of the hepatic artery is brisk – less than 0.07 seconds. FIGURE 8-7 Spectral Doppler tracing of a normal hepatic artery. Systolic upstroke is brisk with acceleration time < 0.07 s. Resistive index measures 73%. Velocity at end diastole approximates 17 cm/s. Diastolic arterial velocity approximates the velocity of the portal vein. A comparison between hepatic artery diastolic velocity and the portal vein velocity is called the liver (or hepatic) vascular index. To acquire this comparison one can increase the sample volume size so that both vessels are incorporated into the same tracing (Fig. 8-5B) or swing the sample volume from one vessel to the other in the same tracing (Fig. 8-8).12,14 The right, middle, and left hepatic veins enter the IVC in a ‘crow’s foot’ configuration when viewed in the transverse plane (Fig. 8-2). The left and middle hepatic veins usually enter as a common trunk along the left anteromedial aspect of the IVC. Over 50% of individuals have additional hepatic veins that are seen with colour Doppler; a right superior anterior segmental vein may be seen draining into the middle hepatic vein, marginal hepatic veins may drain into the right and left hepatic veins, and a large accessory right hepatic vein may be seen entering the IVC several centimetres inferior to the junction of the three main hepatic veins in 6–10% of people (Fig. 8-9). The venous drainage from the central liver, and the caudate lobe, empties directly into the IVC and is not normally detected by colour Doppler since these veins are small and deep (Fig. 8-10). This separate drainage pathway is responsible for the unique behaviour of the caudate lobe in diffuse liver disease, and for the distinctive enhancement pattern seen on contrast-enhanced CT scans of patients with hepatic vein thrombosis. FIGURE 8-9 Longitudinal colour Doppler image of the liver and inferior vena cava (IVC) through the right flank. There is a prominent accessory hepatic vein (open arrow) from the inferior posterior segment of the right lobe of the liver (Couinaud segment 6). This vein joins the inferior vena cava approximately 4 cm inferior to the junction of the main three hepatic veins (HV). FIGURE 8-10 CT scan at the level of the mid-liver in a patient with steatosis. Because of the fatty background, small central hepatic veins (arrow) can be seen draining directly into the inferior vena cava. This unique drainage of the central liver is the underlying cause for caudate hypertrophy in patients with main hepatic vein thrombosis or cirrhosis. The normal hepatic vein waveform is referred to as triphasic and is a result of pressure waves emanating from the right heart (Fig. 8-11A). It is similar to the jugular vein waveform. There are four components to this waveform and occasionally a fifth may be perceived. Since hepatic vein flow courses toward the centrally located IVC, the hepatic vein flow is towards the heart and away from the transducer. Therefore, the majority of flow registers below the baseline. During right atrial contraction blood is forced back into the liver and is therefore displayed above the baseline. These directions are best described as being ‘antegrade’ (towards the heart) and ‘retrograde’ (away from the heart). FIGURE 8-11 (A) Normal hepatic vein spectral Doppler tracing. (B) Illustrated tracings of an ECG, hepatic vein spectral Doppler tracing, and mitral valve M-mode tracing with correlation to atrial and ventricular systole and diastole. The divisions at the top of these tracing 1–5 correspond to the discussion in the text. This complex hepatic vein tracing and associated velocities have been described by Abu-Yousef.15 Figure 8.11B shows the hepatic vein waveform in relationship with an electrocardiogram (ECG) tracing, tricuspid M-mode scan, and atrial and ventricular status. The following stages can be identified: 1. The most distinctive feature is the retrograde A-wave, which is the result of right atrial contraction triggered by the P-wave on the ECG. Since there is no valve between the right atrium and the IVC, a burst of reversed flow travels down the IVC and into the hepatic veins, which has a mean velocity of approximately 18 cm/s. 2. At the end of right atrial contraction, flow returns to the antegrade direction as the atrium relaxes. However, as the right ventricular contracts, the tricuspid valve is slammed shut and bulges back into the right atrium, creating its own pressure wave: the C-wave. This is a subtle brief pause in the steadily increasing antegrade flow. It is infrequently detected. The C-wave coincides with the beginning of ventricular systole and occurs with the QRS complex on the ECG. 3. The right atrium continues to dilate and antegrade flow builds to a relatively high velocity of approximately 30 cm/s. Eventually atrial filling approaches completion and antegrade flow starts to slow. This transition from accelerating to decelerating flow is known as the S-wave and occurs during ventricular systole within 0.15 s of the QRS complex. 4. At the end of atrial filling, antegrade velocity decelerates, or may even briefly reverse. The tricuspid valve then opens and velocities accelerate in the antegrade direction. This is known as the V-wave and has a mean velocity of approximately −1 cm/s. In relation to the ECG, this occurs following the T-wave. 5. As the right ventricle relaxes flow in the hepatic veins again accelerates in the antegrade direction, as both the right atrium and right ventricle fill. Velocity builds to a mean of approximately 22 cm/s. Eventually, the right heart chambers become filled passively and antegrade flow decelerates. This change from accelerating to decelerating velocity is referred to as the D-wave, and occurs during ventricular diastole. We then return to the A-wave as the atrium again contracts to begin another cardiac cycle. This waveform is seen in the hepatic veins and upper IVC in the vast majority of patients. However, not all individuals have a similar degree of periodicity within the hepatic veins. The percentage of patients that manifest an identifiable C-wave is relatively small (Fig. 8-12). The degree of flow reversal of the A-wave and V-wave may vary depending on the patient’s cardiac status, state of hydration, heart rate, and the distance of Doppler interrogation from the heart. In a survey of a population of normal volunteers, a 9% incidence of a flattened hepatic vein flow profile has been reported.12,16 FIGURE 8-12 Normal hepatic vein spectral Doppler tracing. Even though the tracing is acquired within a few centimetres of the heart, the C-wave cannot be identified on this tracing. This is, indeed, the tracing most often visualised in the hepatic vein and inferior vena cava. The retrograde component of flow is appropriately small. Because the heart is located within the thorax, pressure changes caused by respiration affect the hepatic vein flow profile. When the patient forcefully exhales or bears down against a closed glottis, the elevated intrathoracic pressure resists antegrade flow, causing the S- and D-waves to be less prominent. The reversed component of flow increases so the A- and V-waves become more pronounced (Fig. 8-13). Conversely, during forced inspiration with increasing negative intrathoracic pressure, the S- and D-waves become more prominent, while the A- and V-waves are less pronounced and may actually not manifest as reversed flow.17 FIGURE 8-13 Hepatic vein spectral Doppler tracing obtained during Valsalva manoeuvre. Because of the elevated intrathoracic pressure, the reversed component of flow is accentuated. Forward flow is decreased. Compare to Figure 8.12. The colour image was captured during the ‘a wave’ as flow was coursing back into the liver. In hepatocellular disease, the sinusoids are damaged, destroyed or replaced. As the volume of normally functioning liver parenchyma decreases, the resistance to portal venous flow increases, the portal vein dilates, and portal flow decreases and with increasing severity, reverses.18–20 An elevation of pressure in the portal system above 6 mmHg is considered portal hypertension. Above 12 mmHg pressure, portal hypertension becomes clinically evident. Use of the ‘congestive index’ has been recommended to help diagnose portal hypertension. This index is the ratio of the portal vein cross-sectional area (cm2) divided by the mean portal flow velocity (cm/s). This takes into account portal vein dilatation and decreased flow velocity, the two physiological changes associated with portal hypertension. In normal subjects, this ratio is less than 0.7. Although there is theoretical value in this index, the interobserver variability in portal vein area measurements and velocity measurements is relatively high, and error is further compounded when the parameters are combined in a ratio. Therefore, few centres now rely on this index.21,22 As liver disease worsens, the periodicity in the portal vein may become more pronounced, usually coinciding with hepatic arterial systole (Fig. 8-14).19,23 Finally, with end-stage liver disease, continuous hepatofugal flow is observed, usually with increased periodicity. Blood entering the liver in the hepatic artery normally passes through the hepatic sinusoids to the hepatic veins, but with increasing hepatocellular disease, scarring, fibrosis, and capillary leak the pathway of least resistance for the arterial inflow becomes the portal vein. Arterial blood shunts to the portal vein via vasa-vasorum, or via direct arteriovenous shunting at the level of the sinusoids. Thus, the origin of hepatofugal flow leaving the liver in the portal vein is blood shunted from the hepatic artery24 (Fig. 8-15). FIGURE 8-14 Spectral hepatic vein Doppler tracing in a patient with alcoholic cirrhosis. Portal vein flow profile has become more sinusoidal although the flow direction does remain hepatopetal throughout the cardiac cycle. This degree of periodicity is beyond what we would expect in a normal portal vein. The dip in antegrade velocity coincides with hepatic arterial systole. FIGURE 8-15 Portal vein spectral Doppler tracing in a patient with severe hepatocellular injury secondary to paracetamol (acetaminophen) overdose. Portal vein flow is hepatofugal throughout the cardiac cycle. We again see increased periodicity with a velocity surge concurrent with arterial systole secondary to capillary leak. Pronounced periodicity may be seen in the portal vein, which does not coincide with hepatic arterial systole. This is usually due to cardiac disease, such as right ventricular dysfunction or tricuspid regurgitation, and is caused by a prominent reversed component of flow in the hepatic veins, either a ‘cannon’ A-wave or a reversed S-wave25,26 (Fig. 8-16). FIGURE 8-16 (A) Spectral Doppler tracing of portal vein flow in a patient with severe right ventricular dysfunction and tricuspid regurgitation. There is marked periodicity in the portal vein waveform. Hepatopetal flow decreases, and briefly reverses, coinciding with the large regurgitant component of hepatic vein flow during tricuspid regurgitation. (B) Colour image and spectral Doppler tracing of the middle hepatic vein. Note the veins are distended. There is complete distortion of the triphasic hepatic vein waveform with a large regurgitant component of flow. This large reversed pressure wave impedes portal vein inflow. As portal hypertension progresses and pressure rises to 15 or 20 mmHg, sufficient pressure exists to cause the development of varices. These collateral pathways shunt blood from the portal to the systemic circulation.27 The more common channels are the short gastric, left gastric and coronary veins; recanalised umbilical or paraumbilical vein; and splenorenal-mesenteric collaterals (Fig. 8-17). Other, less typical, pathways include pericholecystic, iliolumbar, gonadal, haemorrhoidal, and ascending retrosternal veins. Indeed, any vein in the abdomen may serve as a potential collateral to the systemic circulation and may be incorporated in a very convoluted shunt.28,29 Short gastric varices coursing between the spleen and the greater curvature of the stomach are best imaged via the left flank, using the enlarged spleen as a window (Fig. 8-18). Left gastric or coronary vein varices course from the splenic or portal veins along the lesser curvature of the stomach and are best imaged through the left lobe of the liver (Fig. 8-19). Both sets of varices then converge on the gastro-oesophageal junction (Fig. 8-20A). From there, blood flow proceeds upwards through oesophageal varices to eventually communicate with the azygous vein and the systemic circulation (Fig. 8-20B). Because of the potential lethal risk from spontaneous, brisk haemorrhage from oesophageal varices, a variety of endoscopic, surgical, or percutaneous procedures have been developed to divert blood away from them. FIGURE 8-18 Longitudinal colour Doppler view of the left flank in a patient with portal hypertension and splenomegaly. A tangled web of veins (arrows) is seen coursing cephalad from the splenic vascular pedicle and extends towards the diaphragm (D). These are short gastric varices coursing from the splenic vein, along the greater curvature of the stomach and from there to the systemic circulation via oesophageal varices. FIGURE 8-19 Longitudinal colour Doppler image in the midline of a patient with portal hypertension. A large tortuous left gastric varix is seen coursing from the region of the coeliac axis towards the gastro-oesophageal junction. Whereas short gastric varices tend to be a plexus of small vessels, the left gastric varix is typically a single large tortuous vessel. (Image courtesy of a friend.) FIGURE 8-20 (A) Anterior view of a colour-coded shaded surface display 3-D rendering of a CT angiogram/portal venous phase in a patient with portal hypertension and splenomegaly. Short gastric varices (green) are best imaged from the left flank using the spleen as a sonographic window. The left gastric varix (red) is best imaged through the left lobe of the liver. (B) Anterior view of a colour-coded shaded surface display 3-D rendering of the portal vasculature in a patient with portal hypertension. The portal venous system is coloured red. The vessel coded blue is a large left gastric varix. Note the serpiginous course of this vessel as it courses cephalad, eventually branching into multiple oesophageal varices. In utero, oxygenated blood flows from the placenta up the umbilical vein to the left portal vein and then through the ductus venosus into the IVC and right atrium. After birth, this pathway involutes and the umbilical vein remnant becomes the ligamentum teres in the falciform ligament. In portal hypertension, paraumbilical veins in this ligament or the umbilical vein itself can dilate and carry blood from the left portal vein along the anterior abdominal wall to the umbilical region (Fig. 8-21). From the umbilicus, the blood may pass to the superior or inferior epigastric veins, or through subcutaneous veins in the anterior abdominal wall, known as the ‘Caput Medusa’, to reach the systemic circulation. Because inferior epigastric varices run just deep to the rectus muscles, they are not apparent on clinical examination but are easily identified by colour Doppler (Fig. 8-22). Patients with known portal hypertension, who present with an umbilical hernia, should undergo imaging evaluation prior to surgery as the hernia may contain a dilated varix, rather than bowel. This pathway has less risk of life-threatening variceal bleeding.30 FIGURE 8-21 (A) Longitudinal colour Doppler image of a patient with portal hypertension. A large vein carries flow from the left portal vein towards the transducer. It courses along the falciform ligament and then turns caudad along the abdominal wall passing towards the umbilicus, deep to the rectus muscles. (B) Shaded surface display three-dimensional reformat of the upper abdominal solid organs and portal venous system. Flow in the main portal vein courses towards the liver but immediately channels into a large left portal vein (open arrow). Flow then continues anteriorly towards the anterior abdominal wall and down towards the umbilicus in a large recanalised umbilical vein (pink). FIGURE 8-22 (A) Longitudinal colour Doppler image directly over the umbilicus. A recanalised umbilical vein carries blood towards the umbilicus. No caput medusa was present in this patient since flow drains from the umbilical region via the inferior epigastric vein (IEV). (B) Right lateral view of a colour-coded shaded surface display 3-D rendering of the portal vasculature in a patient with a large recanalised umbilical vein. The umbilical vein (UV) courses towards the umbilicus. From there flow continues back to the systemic circulation via the left inferior epigastric vein (IEGV) to the left external iliac vein (EIV) and eventually the inferior vena cava (IVC). Splenorenal-mesenteric collaterals are typically quite large, elongated and very tortuous. Spontaneous splenorenal varices are almost never a direct communication between splenic and renal veins. They are seen in the left flank taking an extremely convoluted course, often extending between diaphragm and pelvis (Fig. 8-23). Very often this pathway arrives at the renal vein via the left gonadal vein.
 The Liver
Introduction
Executing the Liver Doppler Study
SCAN TECHNIQUE
Indications
Vascular Anatomy and Normal Flow Profiles
PORTAL VEIN
HEPATIC ARTERY
HEPATIC VEINS
Assessment of Disease
PORTAL VEIN
Portal Hypertension
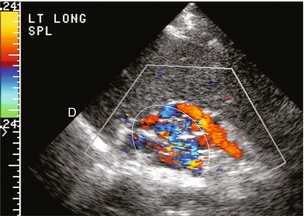
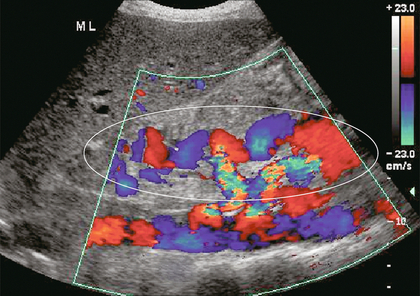
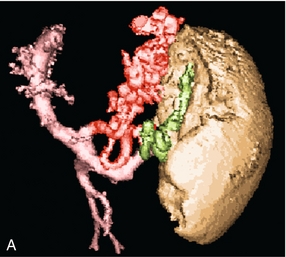
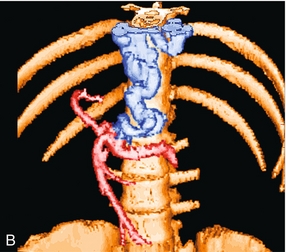
Varices