Fig. 1
Sketch of the haemodynamics simulation pipeline
Image segmentation here refers to the extraction of the boundaries of vascular objects from a 3D image. The outcome is a binarization of the image in voxels belonging either to the vessels or to the background (including other tissues) or a distance transform image where voxels are given values representing the Euclidean distance to the vascular surface. Mesh processing algorithms involve first the extraction of a surface triangulation representing the vascular wall and then some geometrical and topological corrections that lead to a smooth representation of the vessels of interest.
The anatomical model is used as a support surface to generate a computational grid that divides the complex arterial domain into a finite number of smaller polyhedral elements such as tetrahedra or hexahedra. Before simulating the blood flow through the geometrical domain, the nodal velocities or pressure at the geometric boundaries of the model must be specified. Blood is approximated as a Newtonian fluid and vessel walls are typically assumed rigid. Blood flow is mathematically modeled by the unsteady Navier-Stokes equations for an incompressible fluid. These equations are converted into a matrix of discrete equations whose solution yields the unknown velocity and pressure at the nodes of the entire volumetric grid. The velocity field is then processed to facilitate the analysis of the complex unsteady flow characteristics, which includes simple operations such as derivation or time averaging to extract clinically relevant quantities such as WSS magnitude and gradient or the oscillatory shear index (OSI).
2.1 Image acquisition
At present, there are no standard guidelines for the evaluation of image quality for haemodynamics simulation. This often requires a certain familiarity with the flow realization across the vessels of the Circle of Willis, an understanding of the geometrical features prone to affect blood flow and a basic knowledge of the main components of the processing pipeline. It is generally accepted that 3DRA images provide both higher resolution ( ∼ 0. 15mm) and better contrast between the signal intensity of vascular lumen and background when compared to CTA and MRA. On the other hand, 3DRA images have been reported to occasionally present artefacts leading to the underestimation of aneurysm dimensions in specific locations of the Circle of Willis [35] or to the appearance of pseudo stenosis of parent vessels [20, 32]. Due to the profound influence of parent vasculature on aneurysmal haemodynamics, the absence of artefacts has to be ensured not only in the aneurysm but also for all the vessels influencing the realization of the aneurysm haemodynamics. While providing important information on the aneurysm environment in the brain, CTA images offer instead lower resolution ( ∼ 0. 4mm) and the ranges of intensities of vessels and bone overlap. These conditions may limit an accurate segmentation of both small aneurysms and vessels crossing the skull base, where vascular and bone structures are very close. Similar resolution is achieved with TOF MRA, which has the disadvantage of sensitivity to metal implants such as endo vascular devices. In addition, progressive saturation may occur as the spins penetrate into the imaging volume and for disturbed or slow flow. The result is the appearance of signal voids in the vascular lumen or blurred regions across the vascular boundaries, at bifurcations and inside aneurysms, where complex flow patterns may be expected. Despite these limitations, MRA is potentially the most suited imaging technique for haemodynamics simulation as it can derive all the necessary boundary conditions from a single non-invasive imaging session by combining TOF and PC MRA acquisitions.
2.2 Image segmentation
For adapt to the topological changes common in the cerebral vasculature, the segmentation of cerebral vessels may be performed using the geometric deformable model technique within the level set framework [45]. This technique describes the evolution of a surface model within the image domain that deforms under the action of internal (curvature and smoothness) and external (image gradient and other features) forces to recover the unknown shape of the vessels. The surface is represented implicitly as a zero level set of a distance transform image whose size corresponds to the original medical image. Information on image gradient drives the evolution of the model towards the locus of maximum intensity variation across the vascular boundaries [9]. Due to limited resolution and/or image artefacts, the gradient information may be discontinuous or weak across the vascular boundaries, thus leading to boundary leakage. To overcome this limitation, the Geodesic Active Regions (GAR) [48] technique combines image gradient maps with statistical region-based information. The region-based information is presented in the form of a probability image map, that contains the probability of each image voxels to belong to a certain region (or tissue) R. The estimated probability value can be interpreted as a conditional probability,  , where x is a point in the image domain and f(x) is the feature vector used to characterize the tissue at the point x. The regional descriptors k for each region are then based on the corresponding probability map. The equation that drives the evolution of the surface is expressed as:

where Φ is an implicit function whose zero level set at any time t of the evolution represents the vascular surface, k out and k in are the descriptors of the inner and outer tissues with respect to the vascular lumen, K m is the mean curvature of the surface,  is a parameter that controls the contribution of the curvature to the evolution, while ζ and η control the influence of region-based and boundary information, respectively. We have proposed to create features as vectors of differential invariants [64] up to the second order, which are computed at multiple scales to provide a richer description of the different tissues [30]. These feature vectors are expected to be able to differentiate between tissues that cover overlapping image intensity ranges but present different shapes, such as vascular and bone tissues in CTA images. The set of feature vectors belonging to a specific region are first learned in a supervised fashion and then the probability of each image voxel to belong to a particular tissue is estimated using a non-parametric technique. Such approach is particularly suitable for multimodal vessel segmentation as for each modality the vectors of features corresponding to each tissue can be learned from its own training set. Additionally, the initialization process does not require user intervention since it can be obtained by thresholding the probability map corresponding to the vessel region.
 , where x is a point in the image domain and f(x) is the feature vector used to characterize the tissue at the point x. The regional descriptors k for each region are then based on the corresponding probability map. The equation that drives the evolution of the surface is expressed as:
(1)
 is a parameter that controls the contribution of the curvature to the evolution, while ζ and η control the influence of region-based and boundary information, respectively. We have proposed to create features as vectors of differential invariants [64] up to the second order, which are computed at multiple scales to provide a richer description of the different tissues [30]. These feature vectors are expected to be able to differentiate between tissues that cover overlapping image intensity ranges but present different shapes, such as vascular and bone tissues in CTA images. The set of feature vectors belonging to a specific region are first learned in a supervised fashion and then the probability of each image voxel to belong to a particular tissue is estimated using a non-parametric technique. Such approach is particularly suitable for multimodal vessel segmentation as for each modality the vectors of features corresponding to each tissue can be learned from its own training set. Additionally, the initialization process does not require user intervention since it can be obtained by thresholding the probability map corresponding to the vessel region.
2.3 Mesh processing
The generation of numerical grids for flow simulation requires a watertight description of the vascular surface. This can be obtained by automatically applying the method of the marching cubes (or tetrahedra) [6] to the distance transform image obtained from the segmentation process. A sequence of global and local operations is then applied to either improve the quality of the resulting triangulation or to correct geometrical and topological irregularities, which include the fusion of the surface with touching vessels or bones (in CTA only) and over- or under-estimation of the aneurysm neck due to low image contrast and/or resolution. Improvements in mesh quality are obtained by the use of automatic mesh smoothing and optimization algorithms. In particular, the Taubin algorithm [61], which is a volume preserving smoothing technique, is employed to remove bumps and sharp corners, although there is no guarantee that some triangles do not become distorted or too small. Therefore, some mesh optimization operations, including edge-collapsing and side swapping or the removal of degenerate, stretched, repeated and small triangles [12], are applied to the whole triangulation.
In the presence of residual geometrical or topological irregularities, a set of interactive tools are adopted to efficiently edit the triangulation, locally remove or smooth a single or a group of elements and close holes while preserving the general topology and smoothness of the vascular surface [5]. The vessels are then interactively cut perpendicularly to the axis. Each operation is carefully considered to minimize the sensitivity of the results to parent vessel modeling and, at the same time, obtain a workable model size for further grid generation and numerical solution. In addition, the boundary surfaces are extruded along the direction of the axis to minimize the effects of boundary conditions on the realization of blood flow. Following work presented in [19, 25, 44], the length of each extension is typically 5 to 10 times the diameter of the associated vessel.
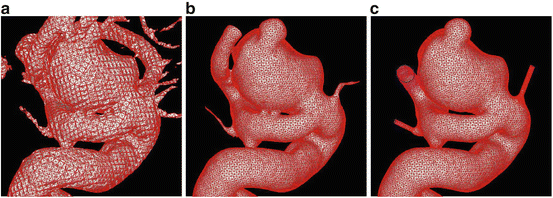
Fig. 2
Mesh processing steps. (a) initial model extracted using the marching tetrahedra technique; (b) smooth model after the application of the Taubin smoothing technique and a gross clipping to discard unwanted vessels; (c) final model after mesh optimization, editing, clipping and extrusion
3DRA acquisition achieves a full description of the Circle of Willis only if multiple injections are performed at the same time. As this carries some risks, Castro [11] applied a surface merging technique to fuse models constructed from different 3DRA images into a single watertight model including all possible avenues of flow. This approach allows to construct complex arterial networks and to investigate the haemodynamics environment of aneurysms that are fed by vessels typically captured in separate 3DRA images.
2.4 Grid generation
The process of generation of a finite element grid for CFD simulation typically starts with the generation of a higher quality surface grid. Although mesh processing operations lead to an appropriate representation of the vascular surface, the quality and the size distribution of the triangulation is not adequate for CFD simulation. New surface grids can be generated starting from an analytical representation of the surface or directly from the surface triangulation obtained after mesh processing. In the former case, the analytical representation of the surface can be obtained using parametric patches or implicit functions of global support [50]. Our approach instead adopts an advancing front method that places newly created points on the original surface triangulation by linear or quadratic interpolation [41]. This process provides elements of higher quality and a more uniform distribution of the element size across the model. This surface mesh is then employed as a support for the generation of tetrahedral elements inside the anatomical model using the advancing front method [42]. Other approaches include Delaunay and octree meshing, but we refer to the literature for further details on the progress in this field [47].
The distribution of element sizes is typically prescribed to obtain a minimum number of elements across the smallest vessel. Adaptive background grids can also be used and interactively specified to increase the mesh resolution in regions where the anatomical model has a large surface curvature. The number of tetrahedral elements in our models typically varies from 1. 5 to 4 millions (average element size of 0. 1 to 0. 15mm). Details of the surface and volumetric grids generated with our approach are provided in Fig. 3.
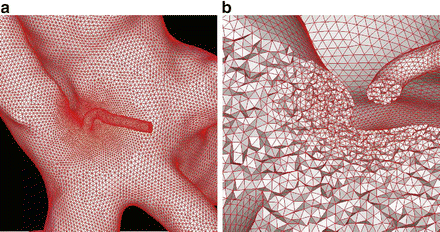

Fig. 3
(a) Surface grid with increased mesh resolution in correspondence to a small branching vessel near the aneurysm neck. (b) Detail of the corresponding volumetric grid
2.5 Specification of boundary conditions
The numerical solution of the equations governing the fluid flow requires the specification of the fluid behavior at the boundaries of the computational domain, that account for the unmodeled part of the vascular network. The assumption of non-moving walls implies that the value of the velocity at the surface nodes is null. Physiological boundary conditions are instead derived for the inlets and outlets of the model. These can be obtained from 2D PC MRA images for the main branches of the Circle of Willis, especially if contributing to the realization of the flow in the aneurysm. Flow rate curves are obtained at each location across one cardiac cycle, but due to resolution constraints the technique does not offer an adequate description of the velocity profile. The flow rate curves are therefore decomposed into their Fourier modes and the velocity profile is analytically computed from the Womersley solution [62].
It must be noted that patient-specific flow rate measurements are seldom available and reference data obtained from normal volunteers are instead employed. Ford [21] suggested that the use of reference waveforms may be appropriate, although the time-average flow rate should be scaled to coincide with the patient’s measured one. If time-averaged flow rates are not available, an approach could be to scale the reference waveforms by a factor depending on vascular dimensions or so that the time-average flow rate corresponds to physiological shear stress values. In the case reference waveforms are also not available, which is the typical scenario for small outflow branches, traction free (zero-pressure) boundary conditions may be applied, assuming that the flow division among the arterial branches is determined by the geometry of the anatomical model. As flow divisions are actually determined by the impedance of the distal arterial tree, more sophisticated strategies have been proposed to integrate vascular bed models of the brain [15] or 1D models of the whole cardiovascular system [3] into the simulation model.
2.6 CFD simulation
Blood is a suspension of particles (e.g. red/white cells and platelets) immersed into an aqueous fluid (plasma). However, in medium and large sized vessels (diameter > 1mm) blood may be considered a homogenous, incompressible, viscous fluid with constant density. Blood flow is here governed by the Navier-Stokes equations for incompressible fluids. Starting from an initial condition at t = 0, these equations require the solution of a system of partial differential equations (PDE) for t > 0, that express the conservation of mass and linear momentum, respectively, as


where ρ is the density,  is the velocity field, p is the pressure, τ is the deviatoric stress tensor and f is a source term that accounts for additional contributions such as gravity, which is however generally not considered in our case. The momentum equation is a vector equation and is therefore composed of three differential equations. The role of the pressure term is peculiar for an incompressible fluid as it is not related to density by an equation of state but is obtained from the divergence constraint. The pressure establishes itself instantaneously and must therefore be integrated implicitly. For a viscous and isotropic fluid, the stress/strain rate relationship (although a tensor relation) is usually expressed as an algebraic equation of the form
  , where μ is the viscosity, while the strain-rate
  is defined as the second invariant of the strain-rate tensor and depends on first derivatives of the velocity. The system of equations is closed by providing a constitutive law for the local viscosity of the fluid. The simplest rheological model is a Newtonian fluid that assumes a constant viscosity μ = μ 0 and a linear relationship between stress and strain. Typical values used for blood are
  and
and  . As the caliber of cerebral vessels quickly decreases with the degree of branching and low shear regions are common in intracranial aneurysms, more accurate non-Newtonian models such as power law, Casson’s or based on Carreau’s law may be used to introduce the shear thinning behavior of blood [38].

(2)

(3)
 is the velocity field, p is the pressure, τ is the deviatoric stress tensor and f is a source term that accounts for additional contributions such as gravity, which is however generally not considered in our case. The momentum equation is a vector equation and is therefore composed of three differential equations. The role of the pressure term is peculiar for an incompressible fluid as it is not related to density by an equation of state but is obtained from the divergence constraint. The pressure establishes itself instantaneously and must therefore be integrated implicitly. For a viscous and isotropic fluid, the stress/strain rate relationship (although a tensor relation) is usually expressed as an algebraic equation of the form
  , where μ is the viscosity, while the strain-rate
  is defined as the second invariant of the strain-rate tensor and depends on first derivatives of the velocity. The system of equations is closed by providing a constitutive law for the local viscosity of the fluid. The simplest rheological model is a Newtonian fluid that assumes a constant viscosity μ = μ 0 and a linear relationship between stress and strain. Typical values used for blood are
  and
and  . As the caliber of cerebral vessels quickly decreases with the degree of branching and low shear regions are common in intracranial aneurysms, more accurate non-Newtonian models such as power law, Casson’s or based on Carreau’s law may be used to introduce the shear thinning behavior of blood [38].
The solution of this system of equations requires the specification of boundary conditions (see Sect. 2.5) and of initial conditions  the value of v 0(x) is usually chosen arbitrarily, thus the numerical solution of the system of equations may produce initial transients to recover, typically after two or three cardiac cycles, from the incorrect initial data.
 the value of v 0(x) is usually chosen arbitrarily, thus the numerical solution of the system of equations may produce initial transients to recover, typically after two or three cardiac cycles, from the incorrect initial data.
The Navier-Stokes equations admit analytical solutions only in very simple conditions such as for a laminar flow through a cylinder (Poiseuille’s law), thus we need to resort to numerical techniques to find an approximation of the mathematical problem. The most popular techniques in haemodynamics simulation involve the reformulation and approximation of the system of PDEs in a finite number of equations, which are then numerically solved on computational grids (see Sect. 2.4). The numerical solution of the unknown v, p requires a spatial discretization and a temporal advancement of the approximation v h , p h . Popular spatial discretization techniques are the finite volume (FV) [31] and finite element (FE) [51] methods. The FV method adopts an integral formulation of the PDEs, called the divergence or conservation form, leading to a system of equations where the approximation v h , p h of v, p at each element of the grid depends only on the value of  at neighboring elements, which are thus used as a control volumes of a piecewise linear (or non-linear) approximation. The FE method instead is based on the Galerkin approximation method, which turns the system of PDEs into its weak variational form. The approximation
  is searched in functional subspaces and is expressed as a linear combination of a finite number of basis functions weighted by the values of v and p at the nodes of the computational grid. The basis functions are typically high-order polynomials, whose degree determines the order of accuracy of the method. In addition, the basis functions have small support so that the value of
  at each node only depends on the values of
  in a limited region of the grid. Thus, as the finite number of equations is subsequently turned into a linear system A u = b, this has the implication that the stiffness matrix A is sparse and that smaller memory requirements and more efficient solutions can be achieved. Similar considerations can be extended to the FV method. In addition, clearly for both methods the finer the grid the more accurate the solution, but also the higher the computational costs. Higher accuracy could also be achieved by increasing the degree of the polynomial basis as in the spectral elements method [49].
 at neighboring elements, which are thus used as a control volumes of a piecewise linear (or non-linear) approximation. The FE method instead is based on the Galerkin approximation method, which turns the system of PDEs into its weak variational form. The approximation
  is searched in functional subspaces and is expressed as a linear combination of a finite number of basis functions weighted by the values of v and p at the nodes of the computational grid. The basis functions are typically high-order polynomials, whose degree determines the order of accuracy of the method. In addition, the basis functions have small support so that the value of
  at each node only depends on the values of
  in a limited region of the grid. Thus, as the finite number of equations is subsequently turned into a linear system A u = b, this has the implication that the stiffness matrix A is sparse and that smaller memory requirements and more efficient solutions can be achieved. Similar considerations can be extended to the FV method. In addition, clearly for both methods the finer the grid the more accurate the solution, but also the higher the computational costs. Higher accuracy could also be achieved by increasing the degree of the polynomial basis as in the spectral elements method [49].
Stay updated, free articles. Join our Telegram channel

Full access? Get Clinical Tree


