Key Facts
Hemochromatosis
- •
Most cases are due to a mutation that results in increased iron absorption from the gut.
- •
Secondary hemochromatosis is due to iron overload from other conditions such as multiple blood transfusions.
- •
Cirrhosis, diabetes, bronze coloration of the skin, hypogonadism, cardiomyopathy, and arthropathy may result.
- •
A distinctive arthropathy may occur that resembles osteoarthritis but typically involves the metacarpophalangeal (MCP) joints and other joints not typically affected by osteoarthritis. Chondrocalcinosis, hook-like osteophytes at the MCP joints, and cystic changes may be present.
- •
Hepatocellular carcinoma occurs in approximately 30% of cases.
- •
Magnetic resonance imaging (MRI) and computed tomography can detect abnormal iron accumulation in involved abdominal organs and the heart.
Ochronosis
- •
Alkaptonuria is produced by a defect in the metabolism of homogentisic acid leading to darkening of the urine when exposed to air or reducing agents.
- •
Ochronosis refers to the connective tissue manifestations of alkaptonuria.
- •
Early degeneration and later calcification of the lumbar spine and dorsal spine intervertebral cysts are characteristic. Findings similar to ankylosing spondylitis may occur.
Wilson’s Disease
- •
Wilson’s disease is a rare, autosomal recessive disease leading to copper deposition, especially in the brain, corneas, and liver.
- •
Characteristic findings may be seen in the central nervous system on MRI.
Fabry Disease
- •
This disease is an X-linked condition in which there is decreased activity of the lysosomal enzyme, α galactosidase A, leading to the accumulation of neutral glycosphingolipids, especially globotriaosylceramide (Gb3).
- •
Chronic renal insufficiency, arterial hypertension, atherosclerosis, cerebrovascular complications, and cardiac involvement may lead to a shortened life span and decreased quality of life.
Multicentric Reticulohistiocytosis
- •
This condition is also known as lipoid dermatoarthritis.
- •
Characteristic red-brown skin nodules may occur after the arthritis is manifest.
- •
Radiographic features include symmetrical, well-defined erosions of interphalangeal joints without osteoporosis or periosteal reaction. Eventually arthritis mutilans may result.
- •
Diagnosis is confirmed by the characteristic histologic findings.
- •
Accompanying malignant lesions should be excluded.
HEMOCHROMATOSIS
Hemochromatosis results from excess iron deposition in the body due either to a genetic cause (primary) or to iron overload from other conditions (secondary). The primary form is an autosomal recessive condition. The responsible “hemochromatosis gene,” HFE, was identified in 1996, and most cases are due to a mutation of this gene resulting in a base change at position 282 of the HFE protein (C282Y). Other gene mutations may also result in hereditary hemochromatosis. Secondary hemochromatosis is due to iron overload from other conditions such as multiple blood transfusions, sickle cell anemia, or increased iron ingestion.
The condition “bronzed diabetes” was first reported in 1865; in 1889, von Recklinghausen reported 12 patients with iron deposition in most organs. The primary form is fairly frequent with approximately 5 of every 1000 persons of northern European descent being homozygous for the C282Y mutation.
Hemochromatosis is the most common genetic disease in populations of European ancestry.
Hereditary hemochromatosis results in increased absorption of iron from the gastrointestinal tract. Normal iron stores are about 5 g, and symptoms occur when iron stores reach 15 to 20 g. Iron is deposited especially in the liver and pancreas and to a lesser degree in the endocrine glands and heart. Iron is also found in the synovial cells of the joints.
Hereditary hemochromatosis results in increased iron absorption from the gastrointestinal tract and deposition of iron in the liver, pancreas, and heart.
Clinical features of hemochromatosis include cirrhosis, diabetes, bronze coloration of the skin (due to melanin in the basal layer), hypogonadism, cardiomyopathy, and arthropathy. However, due to earlier detection, the classic triad of cirrhosis, bronze skin, and diabetes has become rare in adult-onset disease. Symptoms typically begin between the ages of 50 and 60 years. Men are much more commonly affected, probably due to the protective effect of menses and childbirth on iron overload. Most often, fatigue, malaise, and arthralgia—sometimes with hepatomegaly or slightly elevated aminotransferase levels—are the presenting findings in middle-aged adults. Juvenile-onset disease may be manifested by hypogonadotrophic hypogonadism or unexplained heart failure.
The classic triad of hemochromatosis consists of diabetes, cirrhosis, and bronze skin.
The diagnostic evaluation of patients suspected of having adult-onset hereditary hemochromatosis is reviewed by Pietrangelo and Adams. Markers of iron overload and subsequent genetic testing can confirm the diagnosis. Diagnosis can also be confirmed on liver biopsy showing parenchymal iron distribution with a periportal to central gradient and an iron index above 1.9 (hepatic iron concentration in micromoles per gram of liver dry weight divided by the age in years).
Liver cancer (especially hepatocellular carcinoma) is the cause of death in up to 45% of patients with genetic hemochromatosis.
The presence of hepatocellular carcinoma should suggest the possibility of underlying hemochromatosis.
Bone and Joint Disease
Arthropathy occurs in up to half of patients with hemochromatosis and may be the presenting feature of the disease. The severity of the arthropathy is not correlated with the amount of intraarticular iron or with total iron stores. Pathologic examination of the synovium in cases of hemochromatosis shows hemosiderin in the synovial lining cells but no synovial proliferation. In contrast, other disorders in which iron deposition occurs (such as hemophilia or and pigmented villonodular synovitis) show iron deposited in the deep macrophages.
Pathologic examination allows differentiation of iron deposition due to bleeding disorders from that seen in hemochromatosis.
As summarized by Papakonstantinou et al., cartilage damage in hemochromatosis is precipitated by iron or calcium pyrophosphate or apatite crystals. Iron increases cartilage stiffness and leads to fragmentation at the area of greatest stress, which is the tidemark between the calcified and noncalcified cartilage. This area of splitting is different from the subchondral fractures seen in avascular necrosis or the changes of osteoarthritis.
In 1964, Schumacher reported a distinctive pattern of arthritis in patients with hemochromatosis ( Table 28-1 ). The hands and wrists (especially the proximal interphalangeal [PIP] and metacarpophalangeal [MCP] joints) are most often involved. The hips, shoulders, knees, elbows, and ankles may also be affected.

Radiographic Features
Chondrocalcinosis occurs on radiographs in up to 30% of patients with hemochromatosis. It is usually seen in the knees (hyaline cartilage and menisci), the pubic symphysis, the wrists, and the intervertebral disks.
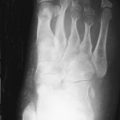
Hands and Wrists
Both hemochromatosis and idiopathic calcium pyrophosphate disease (CPPD)–related arthropathy produce changes of osteoarthritis in joints that are usually not affected by this condition. The radiocarpal and midcarpal joints and the MCP joints are typically involved in these conditions ( Figure 28-1 ). Diffuse cartilage space narrowing is seen instead of the typically asymmetrical narrowing that characterizes primary osteoarthritis. Intraarticular and periarticular calcifications may occur in either condition.
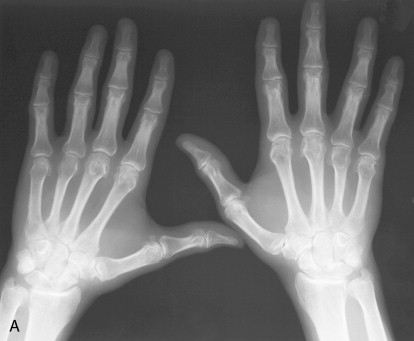
The presence of osteoarthritic changes in a rheumatoid distribution should suggest the possibility of CPPD or hemochromatosis arthropathy.
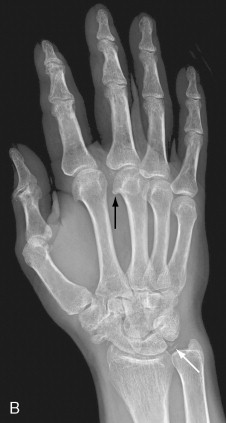
Despite many similar features, there are subtle clues that may allow the diagnosis of hemochromatosis to be suggested over idiopathic CPPD. A blinded review of the hand and wrist radiographs of 26 patients with idiopathic CPPD arthropathy and 26 patients with hemochromatosis revealed some of these subtle differences in appearance ( Table 28-2 ). The most prominent differentiating feature is the involvement of all of the MCP joints including the fourth and fifth and the larger hook-like osteophytes in patients with hemochromatosis.
| Feature | Idiopathic CPPD Arthropathy | Hemochromatosis |
|---|---|---|
| MCP narrowing | Second and third MCP | Every MCP including four and five |
| Osteophytes | Small | Larger hook-like osteophytes from the radial aspects of metacarpal heads |
| Scapholunate dissociation | More often | Less often |
| MCP versus RC involvement | Both MCP and RC | May have MCP without RC |
| Chondrocalcinosis |
|
|
Knee
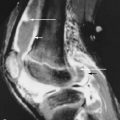
Chondrocalcinosis and predominance of patellofemoral cartilage space narrowing may be seen ( Figure 28-2 ; See also Figure 8-25 ).


Hip
Hip disease is thought to be common and severe in patients with hemochromatosis. Imaging features resemble osteoarthritis or CPPD arthropathy and include concentric joint space narrowing, subchondral lucencies, sclerosis, and osteophytes.
Axford et al. reviewed the radiographs of 112 patients with genetic hemochromatosis and arthritis. Twenty-eight (25%) of the 112 patients had hip abnormalities detected on radiographs. Osteoarthritis and chondrocalcinosis ( <SPAN role=presentation tabIndex=0 id=MathJax-Element-1-Frame class=MathJax style="POSITION: relative" data-mathml='1228′>12281228
12 28
) or osteoarthritis alone ( <SPAN role=presentation tabIndex=0 id=MathJax-Element-2-Frame class=MathJax style="POSITION: relative" data-mathml='928′>928928
9 28
, 32%) were the most common findings. Chondrocalcinosis without accompanying findings was seen in five patients ( <SPAN role=presentation tabIndex=0 id=MathJax-Element-3-Frame class=MathJax style="POSITION: relative" data-mathml='528′>528528
5 28
). In two patients, an unusual arthropathy was described with small osteophytes, cartilage space narrowing, and a wedge-shaped area of subchondral lucency. No patient demonstrated the subchondral cyst formation that is thought to be typical of hemochromatosis involving other joints ( Box 28-1 ).
Symmetrical cartilage loss
Axial migration of the femoral head
Subchondral lucencies
Osteophytes
Subchondral sclerosis
Diffuse osteopenia
Bone marrow edema on MRI
Subchondral cyst-like areas on MRI
Subchondral crescent with fluid signal on MRI
In a case described by Papakonstantinou et al., subchondral lucencies were the result of articular cartilage growing into the subchondral bone rather than subchondral cyst formation.
Axial migration of the femoral head (cartilage loss along the axis of the femoral neck) with osteophytes suggests arthropathy associated with CPPD or hemochromatosis.
MRI may show prominent cystic changes (See Figure 8-16D and E ).
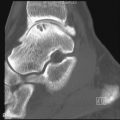
Ankle and Hindfoot
Although involvement of the ankle and hindfoot is unusual in hemochromatosis, occasionally patients with the disorder present with symmetrical pain and swelling of the ankles. Radiographic findings are those of osteoarthritis, although this distribution should suggest an underlying cause (e.g., rheumatoid arthritis, prior trauma) ( Figure 28-3 ). Magnetic resonance imaging (MRI) has shown synovial thickening in addition to the features of osteoarthritis.


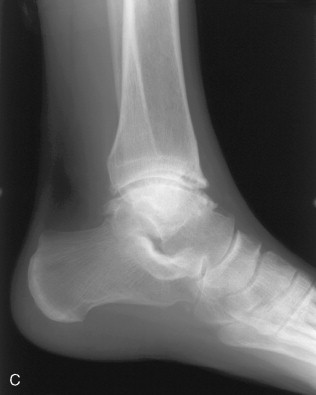
Symmetrical ankle/hindfoot pain and swelling in relatively young men is occasionally a clinical manifestation of hemochromatosis.
MRI Features
Generally, the quantity of intraarticular iron is not adequate in the joint or synovium of patients with hemochromatosis to produce signal changes such as are seen in solid organs in patients with this disorder. The exception is a case reported by Moore et al. in which a periarticular susceptibility artifact in the wrist was described that decreased as the patient was successfully treated.
MRI of Hip
Papakonstantinou et al. correlated MRI findings with gross pathologic and histologic examination in a patient with hemochromatosis. No decrease in signal intensity was present to indicate the presence of iron and histologic examination did not disclose the presence of iron. The imaging findings were nonspecific, although the separation of cartilage at the tidemark on histologic examination suggested the diagnosis.
Nonosseous Imaging Features
Imaging findings generally depend on the presence of iron and the sequelae of iron deposition (e.g., micronodular cirrhosis). Excess iron in genetic hemochromatosis is deposited in hepatocytes, pancreatic acinar cells, the myocardium, joints, endocrine glands, and skin. The cells of the RES are unable to store the excess iron.
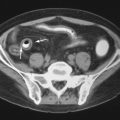
Computed Tomography
Computed tomography (CT) findings in hemochromatosis include increased density to the liver, hepatomegaly, cirrhosis, and hepatocellular carcinoma ( Table 28-3 ). Increased iron deposition in the liver produces a white appearance on non–contrast-enhanced CT scans.
| CT | White liver on noncontrast study |
| Liver density>70 HU | |
| Liver-to-spleen ratio increased | |
| Hepatomegaly | |
| Micronodular cirrhosis | |
| Hepatocellular carcinoma | |
| MRI | Low signal on T1W and T2W image |
Normally, the mean CT number of the liver is 24.9 ± 4.6, and is higher than that of the spleen (mean 21.1 ± 4). The liver spleen difference in CT numbers is 3.8 ± 2.1. In hemochromatosis, the liver density will be > 70 Hounsfield units.
In hemochromatosis, the density of the liver will be > 70 HU and the liver-spleen difference will be greater than normal.
Since the density of the spleen does not increase in iron overload (parenchymal organs rather than the reticuloendothelial system are affected), the liver–spleen difference will be larger than normal. CT is nearly 100% accurate in detecting iron overload that is five times upper normal levels and about 60% sensitive for detecting iron overload that is 2.5 times the upper limit of normal. Normal CT liver values do not completely exclude the possibility of iron overload. Dual-energy CT has correlated with hepatic iron content measured by liver biopsy.
Hepatocellular carcinoma occurs in about 30% of patients with hemochromatosis and is a significant cause of mortality in this condition.
Hepatocellular carcinoma may also occur in patients previously unsuspected of having hemochromatosis. The tumor usually appears as a space occupying hypodense mass in contrast to the hyperdense liver on non-contrast CT examination. Lwakatare et al., however, reported a patient in whom even contrast-enhanced CT examination did not identify the tumor, whereas MRI and contrast-enhanced ultrasonography did. In a liver demonstrating iron overload, a non–iron-containing area should be suspected of being an area containing hepatocellular carcinoma.
Other causes of increased density in the liver include treatment with iodine-containing drugs such as amioderone, or glycogen storage disease.
MRI Compared to CT
Overall, MRI is more sensitive and more specific than CT for detecting elevated liver iron concentrations. The paramagnetic effects of iron produce a low-signal-intensity liver on T1-weighted MRI and especially low signal intensity on T2-weighted and T2*-weighted sequences. (The interested reader is referred to the article by Pomerantz and Siegelman for a more thorough discussion of these findings.) Other entities that produce diffuse low signal on MRI sequences are supermagnetic contrast administration, Wilson’s disease, and Osler-Weber-Rendu disease.
MRI is more sensitive and specific than CT for the detection of iron in the liver.
Quantification of liver iron using noninvasive MRI techniques could offer a clinically relevant alternative to serial liver biopsies. However, relatively low concentrations of iron and relatively large amounts of iron are problematic. Unlike CT, MRI does not provide absolute values; ratios of tissue-to-tissue signal on the same image or calculating a liver index such as T2 relaxation time from a set of images obtained without changing RF parameters can be used for quantification. The ratio of signal intensity on T2-weighted images of the liver to that of the paraspinal muscles of < 0.5 is a predictor of hepatic iron concentrations more than five times the upper limit of normal.
Several MRI techniques have been explored, which are summarized by St Pierre et al. as follows: (1) signal-intensity–ratio methods based on T2 contrast, (2) signal-intensity–ratio methods based on T2* contrast, (3) relaxometry methods based on T2 measurement, and (4) relaxometry methods based on T2* measurement.
In 1994, Gandon et al. reported the quantification of hepatic iron with MRI (using the comparison of liver to fat or liver to muscle ratios on gradient echo sequences) and were able to detect liver iron concentrations of 80 to 300 μM/g. Using this method and a mathematic model, Alustiza et al. generated liver iron concentrations and compared them to biopsy results. For estimated hepatic iron concentrations of > 85 μM/g, the positive predictive value for hemochromatosis was 100%. For concentrations of < 40 μM, the negative predictive value was 100%.
St Pierre et al. reported a noninvasive technique for the measurement and imaging of liver iron concentration in vivo using measurement of tissue proton-transverse relaxation rates (R2) obtained on 1.5T clinical MRI scanners. High sensitivity and specificity were found compared to biopsy-documented liver iron concentrations of clinically significant amounts. The authors noted that the 20-minute scan allowed higher specificity and sensitivity over a greater range of liver iron concentrations than other MRI-based methods available at the time. Custom-designed software is necessary, however.
Similar CT and MRI appearances due to iron deposition occur in other affected organs such as the pancreas and heart. Iron overload detected in the pancreas suggests advanced disease. Myocardial iron can be detected on MRI and can be more accurate than myocardial biopsy, which is subject to sampling error and false negative results. Iron stored as ferritin or hemosiderin interacts with hydrogen nuclei in the vicinity in tissue water to shorten the relaxation times T1, T2, and T2*, which produce low signal on corresponding MRI. When T2* values are less than 20 msec, left ventricle (LV) systolic function has been shown to decline. The presence of cardiac involvement has prognostic implications and may be a contraindication to orthotopic liver transplantation or suggest the need for combined heart and liver transplantation.
Secondary Hemochromatosis
Secondary hemochromatosis is the result of excess iron administration, usually from multiple transfusions or rarely from excessive ingestion. The term hemosiderosis is sometimes used synonymously with hemochromatosis, but it specifically refers to extracellular ferric iron deposition.
Damaged transfused red blood cells are taken up by the reticuloendothelial cells of the bone marrow and spleen and the Kupffer cells of the liver. The iron is stored as hemosiderin. The reticuloendothelial system (RES) can store about 10 g of iron (equivalent to about 40 units of blood). Thereafter, excess iron is deposited in the parenchymal tissues as in primary hemochromatosis. Unlike the deleterious effects seen with parenchymal iron deposition, iron deposited in the RES does not lead to organ fibrosis or hepatocellular carcinoma. Treatment with iron chelation is used to prevent the sequelae of parenchymal iron deposition (such as diabetes).
Iron deposition in hemosiderosis occurs in the reticuloendothelial cell of the bone marrow and spleen and the Kupffer cells of the liver, and it does not usually lead to the complications seen in hemochromatosis.
Related posts:
Stay updated, free articles. Join our Telegram channel

Full access? Get Clinical Tree


