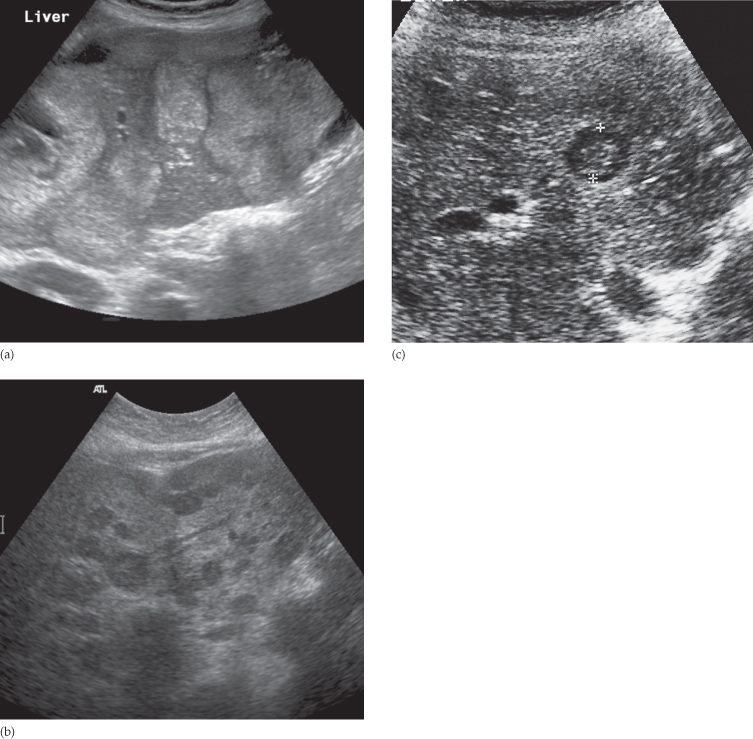
Fig. 7.2 Ultrasound of normal liver. Transverse scan across the porta hepatis. Ao, aorta; IVC, inferior vena cava; PV, portal vein.
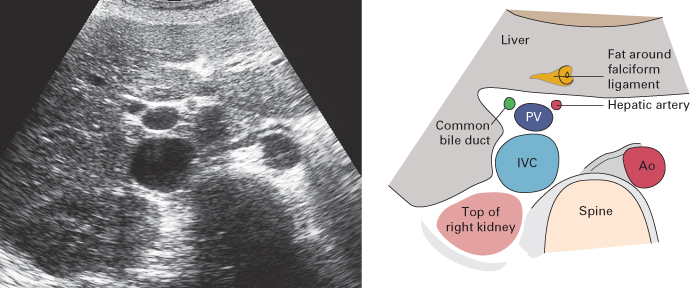
The portal vein within the liver divides into the right and left branches. Running alongside the portal veins are the hepatic arteries and bile ducts, both of which are usually too small to be visualized within the liver. Surrounding these portal triads is an echo-reflective sheath of fibrous and fatty tissue. The hepatic veins run separately, increasing in diameter as they drain towards the inferior vena cava at the level of the diaphragm (Fig. 7.3).
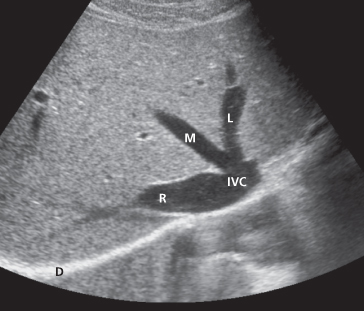
Fig. 7.3 Ultrasound of normal liver. Transverse scan through the superior portion of the liver showing the right (R), middle (M) and left (L) hepatic veins draining into the inferior vena cava (IVC) as it penetrates the diaphragm (D).
Focal masses are recognized as alterations of the normal echo pattern. They can be divided into cysts, solid masses or complex combinations of the two. Cysts that are echo-free and have thin or invisible walls can be assumed to be benign (Fig. 7.4). Solid and complex masses (Figs 7.5 and 7.6) within the liver may be either benign or malignant in nature. Theoretically, most benign solid masses are well defined and should demonstrate a relatively sharp margin with the adjacent hepatic parenchyma, whereas malignant lesions may demonstrate a more irregular border. However, in practice it is often difficult to distinguish benign from malignant lesions unless the mass is clearly a simple cyst.
Fig. 7.4 Ultrasound of a benign cyst. Note the imperceptible wall and absence echoes within the cyst. There is also posterior acoustic enhancement (increased echogenicity of structures deep to the cyst) secondary to enhanced transmission of the ultrasound waves through the water density of the cyst. V, hepatic veins.
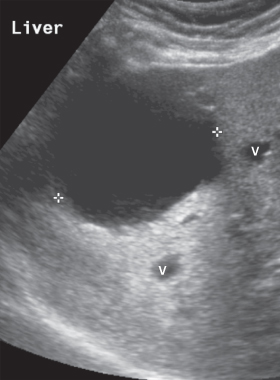
Fig. 7.5 Ultrasound of a solid mass. Longitudinal scan showing an echogenic mass (indicated by cursors), which proved to be a metastasis. D, diaphragm; IVC, inferior vena cava.
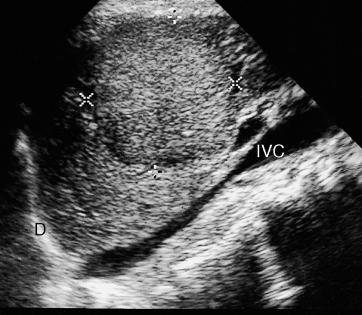
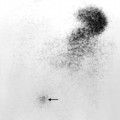
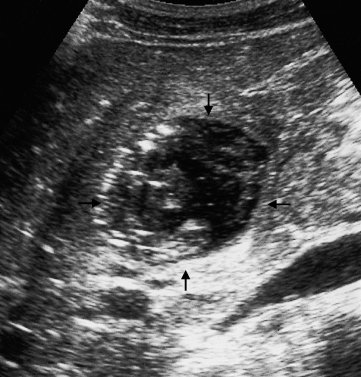
Fig. 7.6 Ultrasound of complex mass. Longitudinal scan of an abscess showing a spherical mass (arrows) with areas of echogenicity both greater and less than normal liver.
When multiple solid or complex masses are seen within the liver, metastatic disease is the likely diagnosis, especially in patients with a known primary tumour. The differential diagnoses of multiple masses are multiple abscesses, regenerating nodules in cirrhosis of the liver and multiple haemangiomas.
Diffuse parenchymal diseases such as diffuse chronic inflammation and diffuse neoplastic infiltration can cause a generalized increase in the intensity of echoes from the liver parenchyma, and are difficult to distinguish from one another.
Computed Tomography
Intravenous contrast medium is usually given in order to increase the density of normal liver parenchyma and to emphasize the density difference between the normal parenchyma and lesions that enhance poorly, such as tumours or abscesses (Fig. 7.7). It is possible to visualize the different phases of liver opacification by taking scans at varying times after the injection of contrast. The liver has a dual blood supply from the hepatic artery and portal vein. Most metastases are best demonstrated as low attenuation areas during the portal venous phase on a scan taken 60–70 seconds after the injection of contrast. Scanning during the arterial phase, about 30 seconds after the injection of contrast, will show lesions such as haemangiomas and some neoplasms, particularly hepatomas and highly vascular metastases (e.g. carcinoid), as areas of greater enhancement than the surrounding parenchyma.
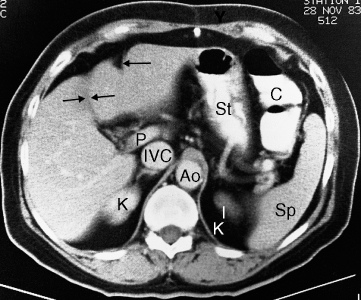
Fig. 7.7 CT scan of normal liver through the porta hepatis (enhanced scan). Ao, aorta; C, colon; IVC, inferior vena cava; K, kidney; P, portal vein; Sp, spleen; St, stomach. The single arrow indicates a fissure for the falciform ligament, and the double arrows a fissure for the gall bladder, which divides the liver into the right and left lobes.
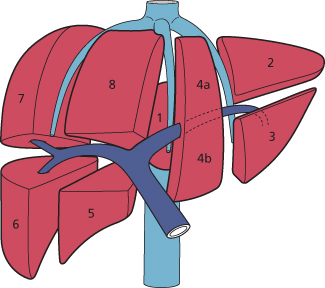
Anatomically, the liver is divided into eight functionally independent segments (Fig. 7.8). Each segment has its own hepatic artery and portal venous inflow, hepatic venous drainage and biliary drainage. This classification is important in hepatic surgery as each segment can be resected without damaging the remaining ones. For the liver to remain viable, resections must proceed along the vessels that define the peripheries of these segments. This means that resection lines run parallel to the hepatic veins. The fissure for the gall bladder divides the liver into the right and left lobes and the falciform ligament divides the left lobe into the medial and lateral segments.
Fig. 7.8 The liver is divided anatomically into eight segments, each of which has its own independent vascular supply and biliary drainage.
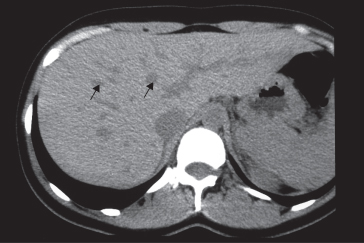
The normal hepatic parenchyma has a relatively high density prior to contrast enhancement; higher than that of muscle and higher or equal in density to the spleen. On images taken without intravenous contrast medium, the hepatic veins and portal veins are seen as branching, low density structures coursing through the liver. As CT is a sectional technique, some of these branches may be seen as round or oval low density areas, which should not be confused with metastases (Fig. 7.9). After contrast enhancement, the veins opacify to become similar or higher in density than the surrounding parenchyma. Because the normal intrahepatic bile ducts are not visible and hepatic vessels opacify with the contrast medium, the normal hepatic parenchyma shows either uniform density or shows the veins clearly opacified against a background of uniform density. The region of the porta hepatis is recognizable as the entrance and exit points of the major vessels and bile ducts. The biliary system distal to the right and left hepatic ducts can be identified, but the smaller intrahepatic bile ducts are not visible in the normal patient.
Fig. 7.9 CT scan of normal liver showing unopacified veins (arrows), which should not be confused with metastases.
Magnetic Resonance Imaging
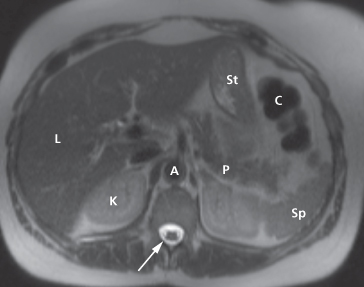
Magnetic resonance imaging is used as a problem-solving technique to give additional information to ultrasound and CT. It is, however, also an excellent technique for demonstrating primary and secondary tumours and is often used if hepatic surgery is contemplated. Axial sections give images akin to CT (Fig. 7.10), but images can also be obtained in the coronal and sagittal planes. Intravenous contrast is used to improve visualization and help characterize lesions. New liver-specific agents are being developed: some are taken up by hepatocytes and some by the reticuloendothelial cells. Malignant tumours do not normally possess hepatocytes or reticuloendothelial cells, so there is heightened contrast between the tumour and normal liver.
Fig. 7.10 Normal T2-weighted MRI scan of the upper abdomen. The liver parenchyma (L) shows intermediate signal intensity. The cerebral spinal fluid has high signal intensity (arrow). A, aorta; C, splenic flexure of colon; K, kidney; P, pancreas; Sp, spleen; St, stomach.
Liver Masses
Ultrasound, CT and MRI are all good methods of deciding whether a mass is present (Box 7.1). Modern imaging techniques can go a long way to predicting the nature of the mass, though occasionally the definitive diagnosis depends on biopsy. This, however, should not be undertaken in a potentially resectable lesion without discussion with a hepatic surgeon as seeding along the biopsy tract may compromise the surgical field.
- Metastases
- Hepatocellular carcinoma (HCC)
- Cholangiocarcinoma
- Fibrolamellar carcinoma
- Sarcomas (rare)
- Hepatic cysts
- Biliary hamartomas
- Haemangiomas
- Hepatic adenomas (can have malignant potential)
- Focal nodular hyperplasia
- Liver abscesses
- Regenerating nodules in cirrhotic liver
Malignant Liver Neoplasms
Metastases, notably from carcinoma of the stomach, colon, pancreas, lung and breast, are much more common than primary tumours (hepatoma and malignant lymphoma, both of which can be multifocal).
Metastases are often multiple, situated peripherally and of variable size. At ultrasound, they may show increased echogenicity (Fig. 7.11a) or, more usually, decreased echogenicity compared with the surrounding parenchyma (Fig. 7.11b). At times, they show a complex echo pattern and when they undergo central necrosis they may even resemble cysts. A metastasis may have an echogenic centre, giving an appearance described as a ‘target lesion’ (Fig. 7.11c). Some metastases have an echo pattern virtually identical to that of the surrounding parenchyma, which means they cannot be identified at sonography.
Fig. 7.11 Ultrasound of liver metastases. (a) Multiple hyperechoic metastases scattered throughout the liver. (b) Multiple metastases appearing as well-defined, round, hypoechoic lesions scattered throughout the liver. (c) The cursors indicate a metastasis showing reduced echogenicity, but with an echogenic centre known as a target lesion.
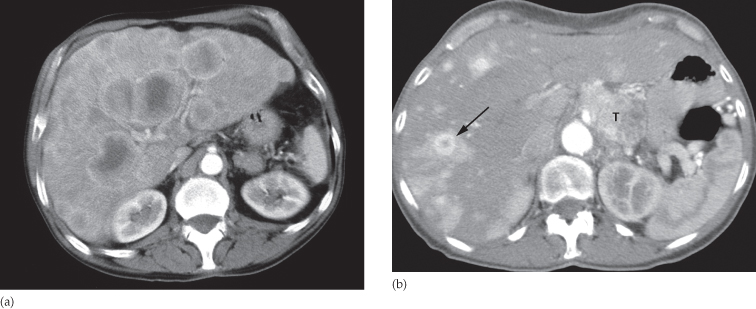
At CT, metastases are seen as rounded areas, usually lower in density than the contrast-enhanced surrounding parenchyma (Fig. 7.12a). Most are well demarcated from the adjacent parenchyma. Intense contrast enhancement is sometimes seen within the tumour, or immediately surrounding it – a useful differentiating feature, which is not seen with cysts. Some metastases, notably carcinoid, are hypervascular and appear as high density areas on arterial phase images (Fig. 7.12b).
Fig. 7.12 CT scan of liver metastases. (a) There are a large number of low density lesions in both lobes of the liver, which show enhancement around their edges. The patient had carcinoma of the bronchus. (b) Vascular metastases (arrow) due to a carcinoid tumour (T) appearing as areas of high density on this arterial phase image.
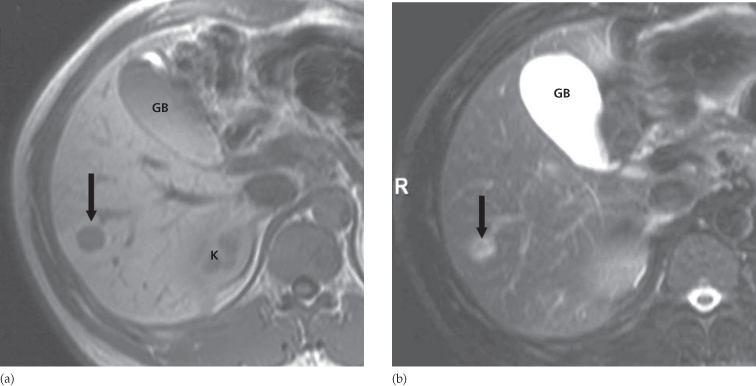
Magnetic resonance imaging is an excellent method of demonstrating metastases, which typically have a signal lower than normal liver on a T1-weighted scan and a high signal intensity on a T2-weighted scan (Fig. 7.13). Various intravenous contrast agents may be used to aid their visualization.
Fig. 7.13 Liver metastasis on MRI. (a) T1-weighted MRI scan showing a solitary low signal intensity focus in the liver (arrow). (b) T2-weighted MRI (with fat saturation) showing the same metastasis. This is of higher signal intensity than the normal liver parenchyma; however, the signal intensity is not as bright as a haemangioma or cyst. GB, gall bladder; K, kidney.
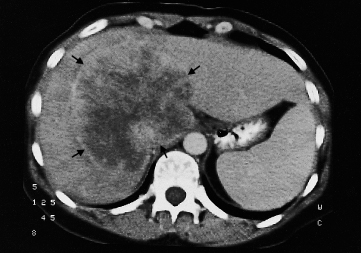
Primary carcinomas of the liver, which include hepatocellular carcinoma (HCC) and cholangiocarcinoma, are usually solitary but they may be multifocal. Their CT (Fig. 7.14), ultrasound and MRI features are similar to metastatic neoplasms. Fibrolamellar carcinoma is a rare tumour, often presenting in adolescents/young adults as a large mass, often with a central calcified scar.
Benign Liver Masses
Benign masses are encountered fairly frequently in the general population. Most are cysts, some are haemangiomas. Focal nodular hyperplasia and adenomas are rare but can closely resemble malignant masses. MRI can be very helpful in differentiating benign from malignant lesions. Interpretation of abnormalities seen in patients with established cirrhosis can be difficult as there is a spectrum of abnormalities ranging from benign regenerating nodules, through dysplatic nodules, to HCC.
Liver Cysts
Simple cysts of the liver may be single or multiple, and are usually congenital in origin; some are due to infection. Multiple hepatic cysts occur in adult polycystic disease, which not only affects the kidneys but may also involve the liver and other organs. These cysts are variable in size and are scattered through the liver. Multiple biliary hamartomas are another rare cause of multiple small hepatic lesions. They represent disorganized clusters of dilated cystic bile ducts and have the imaging appearances of multiple small simple cysts.
At ultrasound, liver cysts show the typical features of cysts elsewhere in the body, namely a sharp margin, no echoes within the lesion, and intense echoes from the front and back walls with acoustic enhancement deep to the larger cysts (see Fig. 7.4).
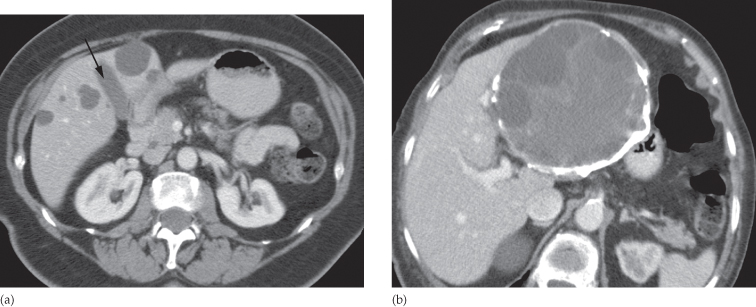
At CT, cysts show very well-defined margins and have attenuation values similar to that of water (Fig. 7.15a). It is often not possible to characterize small lesions, and with lesions below 1 cm in diameter it may be difficult to distinguish cyst from neoplasm.
Fig. 7.15 CT scan of liver cysts. (a) Simple cysts. CT shows several well-defined, low attenuation lesions of near water density. Note their density is equivalent to the bile in the gall bladder (arrowed). (b) Complex cyst. CT scan showing a multilocular hydatid cyst with calcification in its wall.
At MRI, the features are similar to those found at CT. Cysts have the expected signal intensity of water, namely low signal on a T1-weighted scan and high signal on a T2-weighted scan.
Cysts due to echinococcus (hydatid) disease may be single or multiple; a few show calcified walls. Daughter cysts may be seen within a main cyst at both ultrasound and CT (Fig. 7.15b). Unless these features are present, hydatid cysts may prove indistinguishable from simple cysts at both ultrasound and CT.
Occasionally metastases can have a cystic appearance.
Haemangiomas of the Liver
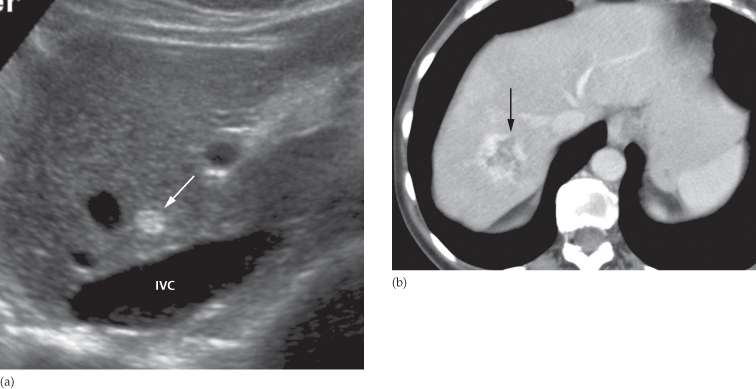
The detection of one or more haemangiomas of the liver is a common incidental finding and rarely requires treatment. Occasionally, they can cause significant haemorrhage, especially following trauma, and therefore percutaneous biopsy should be avoided if possible. Haemangiomas are typically well-defined, peripheral, echogenic masses at ultrasound (Fig. 7.16a). At CT, there is usually a characteristic enhancement pattern characterized by sequential contrast opacification, beginning as nodular or globular areas of enhancement at the periphery and proceeding toward the centre over time until the density increases to become similar to that of the surrounding liver (Fig. 7.16b).
Fig. 7.16 Haemangioma (incidental finding). (a) Ultrasound scan showing an echogenic mass in the right lobe of the liver (arrow). IVC, inferior vena cava. (b) CT scan, in another patient, after intravenous contrast enhancement showing a low density lesion in the right lobe of the liver (arrow) with peripheral nodular enhancement, characteristic of a haemangioma.
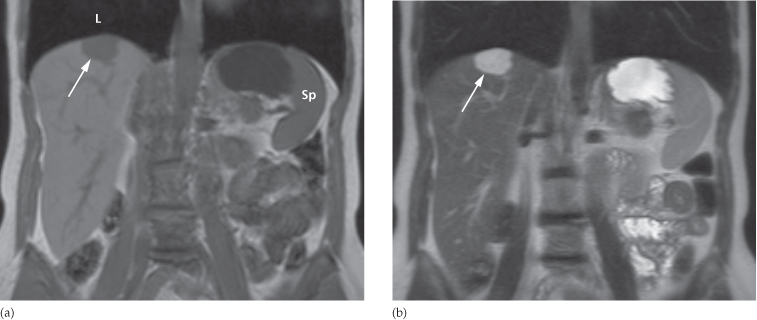
Magnetic resonance imaging shows uniform very high intensity on T2-weighted images (Fig. 7.17), a characteristic that is shared with benign cysts, but which is very unusual with malignant neoplastic lesions.
Fig. 7.17 MRI of a haemangioma. (a) Low signal intensity focus (arrow) on a coronal T1-weighted image. (b) High signal intensity focus (arrow) on a coronal T2-weighted image. L, right lung base; Sp, spleen.
Adenoma and Focal Nodular Hyperplasia
Both of these conditions appear as hypervascular masses on arterial phase, both on CT and MRI (Fig. 7.18).