High-field magnetic resonance (MR) imaging is showing potential for imaging of neurodegenerative diseases. 7 T MR imaging is beginning to be used in a clinical research setting and the theoretical benefits of higher signal-to-noise ratio, sensitivity to iron, improved MR angiography, and increased spectral resolution in spectroscopy are being confirmed. Despite the limited number of studies to date, initial results in patients with multiple sclerosis, Alzheimer disease, and Huntington disease show promising additional features in contrast that may help the diagnosis of these disorders.
- •
Preliminary studies have shown that high-field MR imaging is possible in patients with neurodegenerative diseases.
- •
High-field MR imaging is sensitive to detect the perivenous location of MS lesions and the frequent cortical involvement, difficult to visualize at lower field strengths.
- •
Visualization of the lenticulostriate arteries is possible in patients with CADASIL.
- •
Localized spectroscopy in patients can be performed in small anatomic structures allowing for improved metabolite quantification, including glutamate.
- •
High-resolution structural imaging revealed local changes in the hippocampus in patients with AD or HS.
- •
A new type of image contrast based on signal phase has been developed called quantitative magnetic susceptibility imaging.
Despite the limited number of clinical studies that have been performed, 7 T MR imaging has been shown to provide high sensitivity for:
- •
High-resolution MR angiography using a TOF technique to visualize small arteries, such as the lenticulostriate arteries in patients with CADASIL
- •
Detection of iron depositions in basal ganglia, a common finding in many patients with neurodegenerative diseases
- •
Detection of lesions in patients with MS, specifically the sensitivity to detect the presence of a central vein within the lesions is increased compared to lower field strengths
- •
Detection of cerebral microbleeds, a common finding in many patients with neurodegenerative diseases
- •
Imaging with high detail of the hippocampal substructures, a region of interest for patients with HS, or AD
- •
Detection of brain metabolites using MR spectroscopy in small anatomical structures, such as the putamen and the caudate nucleus, that could provide further insight in neurodegenerative disease processes
Potential of high-field magnetic resonance imaging for neurodegenerative diseases
The increase in static magnetic field strength for clinical magnetic resonance (MR) imaging scanners has resulted in significant improvements in image quality. There is almost universal improvement in the diagnostic value of 3 T versus 1.5 T clinical neurologic MR imaging scans, and 3 T scanners are routinely used for a broad range of applications. The need for increased sensitivity to early indicators of neurodegeneration with the goal of identifying potential biomarkers for diagnosis and the monitoring of treatment is one of the driving forces behind the interest in further increasing the magnetic field strength. The well-characterized signal-to-noise ratio (SNR) increase with field strength can be used for reduced acquisition times or higher spatial resolution. The increased sensitivity of image contrast (particularly in T 2 ∗-weighted sequences) to tissue iron levels has great potential for the detection of early diffuse depositions that may lead to neurotoxic effects. There is a new type of image contrast based on signal phase, but this contrast depends on the brain orientation and its interpretation needs to be further developed, which is the topic of a relatively new approach called quantitative magnetic susceptibility imaging. In addition, the orientation of WM bundles also affects this contrast, which has to be described using a susceptibility tensor. The longer T 1 value of both blood and tissue results in higher-quality MR angiography with improved background suppression. Furthermore, the increased difference in chemical shift between the proton signals of different metabolites has an advantage for MR spectroscopy in quantifying more metabolites than previously possible.
Initial imaging studies of multiple sclerosis (MS) patients at 7 T seem promising in detecting more lesions with higher structural detail, especially in gray matter (GM). In addition to the improved spatial resolution and SNR, the increased contrast in MR angiography and cortical layer contrast in T 2 ∗-weighted imaging have already demonstrated the potential of 7 T MR imaging. However, many intrinsic challenges remain in obtaining high-quality MR data at field strengths of 7 T and higher.
Challenges
The main challenges are related to creating a homogeneous magnetic field (B 0 ) and radiofrequency (RF) field B 1 over the whole brain. A higher magnetic field strength results in increased sensitivity to magnetic susceptibility–induced field variations. On a microscopic scale this effect enhances the contrast within cortical layers, basal ganglia, and small venous structures, and results in greater white matter (WM) heterogeneity. However, large-scale magnetic field variations induced by, for example, air-tissue interfaces (static) or respiration (dynamic), can lead to undesired signal loss and image deformations. Most modern high-field MR imaging scanners are equipped with higher-order shim gradients to improve the static field homogeneity. Careful optimization of sequence parameters and image-correction algorithms has shown that it is possible to acquire high-quality images even from sequences such as echo-planar imaging, which are particularly susceptible to static magnetic field inhomogeneities. Equally problematic, the amplitude of dynamically fluctuating magnetic fields caused by respiration or body movements also increases with field strength. It has been shown that corrections for these dynamic effects are possible both prospectively and retrospectively. Using dedicated hardware or sequences, image quality can be restored reasonably well.
Another fundamental challenge at 7 T is producing a highly homogeneous RF field, B 1 , with high efficiency, to minimize tissue heating. B 1 inhomogeneities are due primarily to the dielectric properties of tissue, which result in partial constructive and destructive interactions from RF wave behavior. Tissue conductivity produces conduction currents in tissue, which dampens the electromagnetic (EM) field as it penetrates through tissue, producing a phase shift in the traveling RF. This process not only results in significant image inhomogeneity and areas of signal loss, but may also give rise to local heating, expressed as the specific absorption rate (SAR) from interaction with the electric field. The dielectric properties of tissue produce displacement currents in tissue and inductive losses caused by eddy currents, and also alter the RF wavelength in tissue. The effective wavelength of electromagnetic energy in tissue is approximately 13 cm at 7 T. The brain has dimensions on the same order as the wavelength. This situation limits the applicability of conventional volume coils, such as the birdcage and transverse electromagnetic (TEM) resonator, which produce homogeneous transmit fields at 1.5 T and 3 T, but cannot produce the same homogeneous fields at 7 T. The inhomogeneous RF field in combination with increased tissue heating leads to important sequence considerations. SAR-intensive protocols involving sequences such as fast spin echo and fluid-attenuated inversion recovery (FLAIR) cannot simply be copied from lower field strengths. Solutions are discussed in the section on future prospects and challenges.
Despite these challenges, 7 T MR imaging is beginning to be used in a clinical setting and the theoretical benefits of 7 T, namely higher SNR, sensitivity to iron, improved MR angiography, and spectroscopy are being confirmed. Although thus far only a limited number of patient studies have been performed at 7 T and many of the proposed techniques still need further validation. Initial imaging studies of MS patients at 7 T seem promising in detecting more lesions with higher structural detail, especially in GM. In addition to the improved spatial resolution and SNR, the increased contrast in MR angiography and the detection of cortical layer contrast in T 2 ∗-weighted imaging have already demonstrated the potential of 7 T MR imaging.
Neurodegenerative diseases
This section describes some of the clinical studies with 7 T MR imaging that have been performed to date in patients suffering from neurodegenerative diseases. A selection of the used sequences is given in Table 1 .
| Sequence | Resolution (mm 3 ) | TR (ms)/TE (ms)/FA | Slices/Orientation | Specific Parameters | Parallel Imaging | Scan Duration | Refs. |
|---|---|---|---|---|---|---|---|
| 3D TOF | 0.23 × 0.23 × 0.23 | 16/4.1/30° | 161/Transverse | RL = 3 | 10 min 40 s | ||
| 2D T 2 ∗ | 0.24 × 0.24 × 1 | 1770/25/60° | 46/Transverse | Retrospective f 0 correction | RL = 2.2 | 10 min 00 s | |
| 2D T 2 | 0.5 × 0.5 × 1 | 3000/56/90° | 35/Transverse | Turbo factor = 12, refocusing angle = 105° | 9 min 09 s | ||
| 3D T 1 | 0.9 × 0.9 × 0.9 | 4.2/1.87/7° | 193/Sagittal | TI = 1300 ms, turbo factor = 350 | AP × RL = 2 × 2.5 | 2 min 30 s | |
| 3D FLAIR | 0.8 × 0.8 × 0.8 | 8000/300/90° | 225/Sagittal | TI = 2200 ms, T 2prep = 100 ms, refocusing angle = 70° | AP × RL = 2.5 × 2.5 | 12 min 30 s |
CADASIL
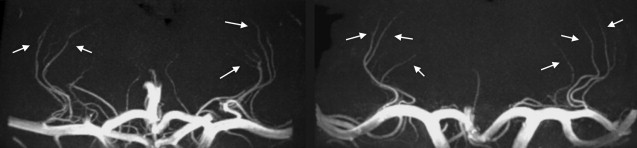
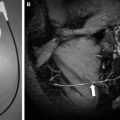
Cerebral autosomal dominant arteriopathy with subcortical infarcts and leukoencephalopathy (CADASIL) is a hereditary form of small-vessel disease that is caused by a mutation in the Notch3 gene. Pathologically, degeneration of the small smooth vessels is observed together with fibrous thickening of the small vessels. Clinical characteristics of the disease are cognitive loss, migrainous headaches, strokelike episodes, and dementia. In addition, cerebral blood flow is known to be reduced in CADASIL patients. However, the exact mechanism remains unclear, and most findings regarding vessel wall pathology come from ex vivo studies. In vivo MR angiography can potentially provide valuable information on the hemodynamic changes in CADASIL patients. The most affected vessels are the leptomeningeal arteries supplying the WM and the lenticulostriate perforating arteries supplying the deep gray nuclei. At lower field strengths, MR angiography has been unable to visualize these arteries because of their small diameter. However, recent studies performed at 7 T show sufficient enhancements in resolution and contrast, enabling visualization of the lenticulostriate arteries. The method that is most suited is time-of-flight (TOF) MR angiography, whereby the contrast is generated by the fresh inflow of blood with a gradient echo sequence that is relatively SAR friendly. The prolonged T 1 relaxation times at 7 T result in improved background saturation compared with lower field strengths, increasing the contrast between the vessel lumen and surrounding tissue. In addition, the increase in SNR can be traded for a very high spatial resolution. In a recent study this was confirmed by visualization of significant lengths of the lenticulostriate arteries in patients with CADASIL and control subjects. Fig. 1 shows an example of a coronal maximum-intensity projection of the lenticulostriate arteries in a healthy control subject and in a patient with CADASIL. A small field-of-view (FOV) 3-dimensional TOF MR angiography technique was used with an isotropic resolution of 0.23 × 0.23 × 0.23 mm 3 and 161 slices, resulting in a scan duration of 11 minutes. From these data sets, the number of visible arteries at different locations with respect to the middle and anterior cerebral artery, the cross-sectional area, and length of the arteries were determined. No significant differences were found between patients and controls in any of the measures. In addition, no association was found between the luminal diameters and lacunar infarct load in the basal ganglia and basal ganglia hypointensities on separately acquired T 2 -, T 2 ∗-, or T 1 -weighted scans. These results suggest that basal ganglia damage in CADASIL is likely not caused by vascular mechanisms. The lack of association between age and disease duration with these vascular measurements further supports the finding that generalized narrowing of luminal diameters of lenticulostriate arteries does not play a significant role in the pathophysiology of CADASIL.
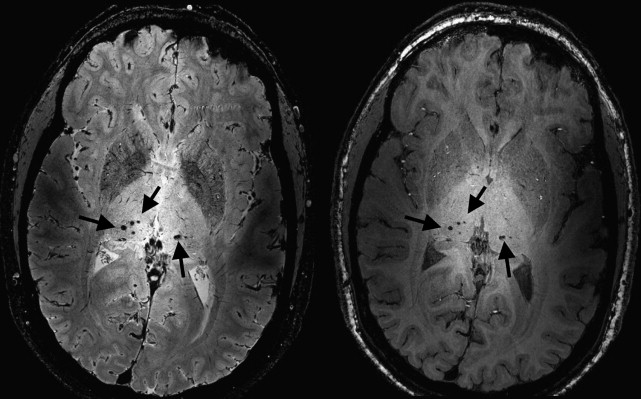
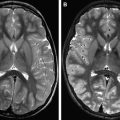
Another common MR imaging finding in patients with CADASIL are hypointensities on T 2 ∗-weighted images caused by iron-containing hemosiderin deposits in cerebral microbleeds (CMBs). Fig. 2 shows CMBs observed bilaterally in the thalamus of a 35-year-old patient with CADASIL on T 2 ∗- and T 1 -weighted images. Initial results have shown diffuse areas of T 2 ∗ hypointensity in the basal ganglia, most commonly caused by diffuse iron deposition in CADASIL. Such diffuse areas have also been described in other neurodegenerative diseases such as Alzheimer disease (AD). Nevertheless, whether iron deposition is exclusively a neurodegenerative process or whether it can also be caused by vascular mechanisms is unsure. High-field T 2 ∗-weighted MR imaging is extremely sensitive to changes in the local magnetic field, such as those generated by iron-rich regions. These changes in local magnetic field lead to decreased signal intensity on magnitude images and an increased frequency shift (relative to non–iron-containing brain tissue) on phase images. Preliminary data of high-resolution T 2 ∗-weighted images using a 2-dimensional gradient echo sequence obtained with a resolution of 0.24 × 0.24 × 1 mm 3 demonstrated increased iron deposition in the globus pallidus and the caudate nucleus. These findings were based on both magnitude images and unwrapped phase images. Both approaches gave similar results, but the phase-shift measurements showed larger differences, emphasizing the sensitivity of phase to iron-induced changes in the brain.
Related posts:
 Current State-of-the-Art 1.5 T and 3 T Extracranial Carotid Contrast-Enhanced Magnetic Resonance Angiography
High-Field Atherosclerotic Plaque Magnetic Resonance Imaging
Current State-of-the-Art 1.5 T and 3 T Extracranial Carotid Contrast-Enhanced Magnetic Resonance Angiography
High-Field Atherosclerotic Plaque Magnetic Resonance Imaging
 Vascular Disorders: Insights from Arterial Spin Labeling
 Current Status and Future Perspectives of Magnetic Resonance High-Field Imaging: A Summary
 Pediatric High-Field Magnetic Resonance Imaging
 Ultrahigh-Field Magnetic Resonance Imaging: The Clinical Potential for Anatomy, Pathogenesis, Diagnosis and Treatment Planning in Neck and Spine Disease
Stay updated, free articles. Join our Telegram channel

Full access? Get Clinical Tree


