Epileptogenic lesions are often subtle, do not change during life, and are easily overlooked, if spatial resolution and signal to noise ratio are inappropriate. 2D or more recently 3D-FLAIR sequences are best suited to detect small cortical dysplasias which are often located at the bottom of a sulcus. 3D-T1-weighted gradient echo sequences are used for multiplanar, curved surface reformations, and voxel-based analyses. 3 T MR imaging is currently the state-of-the-art imaging modality for patients with suspected structural epilepsies in which an epileptogenic lesion has not yet been found.
- •
High-field magnetic resonance (MR) imaging is currently the state-of-the-art technique for the detection and characterization of epileptogenic lesions.
- •
An increased signal-to-noise ratio helps to increase the spatial resolution while maintaining a high contrast between normal cortex and epileptogenic lesion.
- •
Subtle epileptogenic lesions are more frequently overlooked than invisible on high-quality MR imaging.
Do not start MR imaging without information about:
- •
Seizure type
- •
Seizure frequency (single vs multiple seizures, seizures in context of an acute disease)
- •
Semiology of the seizure
- •
Suspected etiology (genetic/idiopathic, structural/metabolic, unknown)
Check if MR images show:
- •
Sufficient gray/white matter contrast
- •
Appropriate spatial resolution
- •
Symmetric visualization of unaffected anatomic structures for allowing side comparisons
Check if MR images show:
- •
Sufficient gray/white matter contrast
- •
Appropriate spatial resolution
- •
Symmetric visualization of unaffected anatomic structures for allowing side comparisons
Interpret MR imaging
- •
In a clinical context as described above
- •
Incorporating electroencephalography findings if possible
Theoretical considerations
Signal-to-Noise Ratio
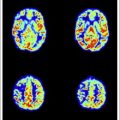
According to the increasing number of parallel spins at higher field strengths (as derived from the Boltzmann equation), the signal increases in proportion to the field strength B 0 (signal to noise ∼ B 0 ). The signal theoretically doubles from 1.5 to 3 T, and in practice it increases by a factor of around 1.8. However, this higher signal-to-noise ratio (SNR) can be used to increase the CNR and the spatial resolution, or to decrease the acquisition time ( Fig. 1 ).
Relaxation Times
Relaxation times are a function of the applied magnetic field strength. With increasing field strength, spin-lattice or longitudinal relaxation time T1 increases by 20% to 40% for most tissue. At the same time, spin-spin or transversal relaxation time T2 decreases. T1 and T2 relaxation times of biological fluids such as water (ie, cerebrospinal fluid) and blood are constant between 1.5 T and 3 T; the strong prolongation of T1 of solid tissue (ie, brain) at 3 T leads to an overall lower tissue contrast on T1-weighted images.
| Sequence Type | ||||||
|---|---|---|---|---|---|---|
| 3D T1 FFE | FLAIR TSE | T2 TSE | FLAIR TSE | T2 TSE | FLAIR TSE | |
| Orientation | Sagittal | Sagittal | Axial | Coronal | Coronal | Axial |
| FOV | 256 | 240 | 230 | 230 | 240 | 256 |
| RFOV | 0.95 | 0.9 | 0.8 | 0.8 | 0.9 | 1 |
| Matrix | 256 | 256 | 512 | 256 | 512 | 256 |
| Scan% | 100 | 72.6 | 80 | 70.6 | 80 | 100 |
| TI | 833 | 2850 | 2850 | 2850 | ||
| TR/TE | 8.2 | 12000 | 3272 | 12000 | 5765 | 12000 |
| TE | 3.7 | 120 | 80 | 140 | 120 | 140 |
| Flip angle | 8 | 140 | 90 | 90 | 90 | 90 |
| R-factor | No | No | No | 3 | No | |
| Slice thickness | 1 | 3.5 | 5 | 3 | 2 | 2 |
| Interslice gap | 0 | 0 | 1 | 0 | 0 | 0 |
| No. of slices | 140 | 40 | 24 | 40 | 40 | 60 |
| No. of excitations | 1 | 1 | 1 | 1 | 6 | 1 |
| Acquired voxel size (mm) | 1 × 1 × 1 | 0.98 × 1.26 × 3.5 | 0.57 × 0.72 × 5 | 0.9 × 1.27 × 3 | 0.47 × 0.64 × 2 | 1 × 1 × 2 |
| Reconstructed voxel size (mm) | 1 × 1 × 1 | 0.49 × 0.49 × 3.5 | 0.45 × 0.45 × 5 | 0.45 × 0.45 × 3 | 0.23 × 0.23 × 2 | 1 × 1 × 2 |
| Acquisition time | 3 min 11 s | 4 min 48 s | 1 min 58 s | 4 min 00 s | 4 min 53 s | 5 min 24 s |
Larmor Frequency
According to the relationship between the Larmor precession frequency and the magnetic field strength (ω = γB 0 ), the Larmor frequency increases from 63.9 MHz at 1.5 T to 127.8 MHz at 3 T.
Chemical Shift, Susceptibility, and B 1 Homogeneity
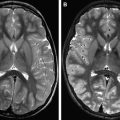
Chemical shift increases proportionally with the field strength, that is, from 220 Hz at 1.5 T to 440 Hz at 3 T. The shorter echo time (TE) at 3 T potentially decreases the sensitivity to pulsation and motion artifacts. Susceptibility, defined as the extent to which a material becomes magnetized when placed within a magnetic field, scales in proportion to the field strength, which can be both an advantage ( Fig. 2 ) and disadvantage. Susceptibility can affect local tissue resonance frequencies (spin-spin relaxation) and lead to dephasing and signal loss typically in gradient echo pulse sequences. The relaxation time T2∗ that describes the susceptibility-induced signal loss is shortened at 3 T compared with 1.5 T.
| Sequence | ||||||
|---|---|---|---|---|---|---|
| T1 TSE | T2 FFE | DWI | DTI | SWI | 3D FLAIR | |
| Orientation | Coronal | Axial | Axial | Axial | Axial | Sagittal |
| FOV | 230 | 230 | 256 | 256 | 220 | 250 |
| RFOV | 0.8 | 0.8 | 1 | 1 | 0.8 | 100 |
| Matrix | 256 | 256 | 128 | 128 | 256 | 228 |
| Scan% | 79.9 | 79.9 | 97.8 | 98.4 | 100 | 100 |
| TI | 1600 | |||||
| TR | 550 | 601 | 3151 | 11374 | 16 | 4800 |
| TE | 13 | 18 | 69 | 63 | 23 | 309 |
| Flip angle | 90 | 18 | 90 | 90 | 10 | 90 |
| R-factor | No | No | 3 AP | 2.2 AP | 1.5 RL | 2.5 AP, 2 RL |
| Slice thickness | 5 | 5 | 5 | 2 | 1 | 1.1 |
| Interslice gap | 1 | 1 | 1 | 0 | 0 | 0 |
| No. of slices | 24 | 24 | 24 | 60 | 200 | 327 |
| No. of excitations | 1 | 1 | 2 | 1 | 1 | 2 |
| Acquired voxel size (mm) | 0.9 × 1.12 × 5 | 0.9 × 1.12 × 5 | 2 × 2.4 × 5 | 2 × 2.03 × 2 | 1 × 1 × 1 | 1.1 × 1.1 × 1.1 |
| Reconstructed voxel size (mm) | 0.45 × 0.45 × 5 | 0.45 × 0.45 × 5 | 1 × 1 × 5 | 2 × 2 × 2 | 0.43 × 0.43 × 0.5 | 0.43 × 0.43 × 0.55 |
| Acquisition time | 4 min 33 s | 1 min 41 s | 1 min 09 s | 6 min 26 s | 3 min 17 s | 4 min 43 s |
Radiofrequency Power Deposition
Radiofrequency (RF) energy deposition is monitored by measuring the specific absorption rate (SAR), which must not exceed 4 W/kg over a 15-minute period. For comparison, RF energy deposition of most mobile phones is in the range of 0.5 to 0.75 W/kg. Because RF energy deposition scales with the square of B 0 in the range from 1.5 T to 3 T, SAR limits will be reached much earlier, limiting especially fast pulse sequences with high RF energy deposition, such as fast spin-echo sequences.
Adaption of Imaging Protocols
SAR limitations, different relaxation times, and increased susceptibility are the most important parameters to be adapted at 3 T. Parallel imaging reduces RF energy deposition by reducing the number of phase-encoding readouts (determined by the reduction factor R) at a given TE, or it allows for the reduction of echo-train length in, for example, echo planar imaging (EPI), yielding a shorter effective TE. This approach allows a substantial reduction in image distortion and improves image quality. In addition, the shorter TE is more motion resistant and reduces blurring in the image. Moreover, as the application of high R-factors are limited by the parallel imaging inherent signal loss (S ∼ 1/√R), the abundant SNR at 3 T can be used to implement R-factors of greater than 2.
Another way to reduce SAR is to acquire 3D sequences and sequences with variable refocusing flip angle. However, 2-dimensional (2D) FLAIR sequences with in-plane resolutions of less than 1 mm and slice thicknesses between 2 and 5 mm still have a higher CNR than 3D FLAIR sequences with isotropic, typically 1-mm 3 voxels, which are useful for the generation of multiplanar reformations and voxel-based analyses.
With respect to T1-weighted spin echo images, gray matter/white matter contrast is reduced at 3 T for several reasons. T1 relaxation times of gray and white matter lengthen and converge. Shielding effects induced by eddy currents prevent central parts of the image from being properly excited, which results in reduced signal intensity of the basal ganglia region. Stronger magnetization transfer effects reduce signal intensity and contrast. T1-weighted gradient echo images provide a good contrast between gray and white matter; however, contrast enhancement is different and may remain undetected on gradient echo images.
A recent survey about the distribution of epileptogenic lesions operated on in a large epilepsy surgery center shows hippocampal sclerosis (HS) as the most common and also almost constant lesion over time. The number of long-term epilepsy-associated tumors (LEATs) and of patients negative on MR imaging has decreased, whereas the number of focal cortical dysplasias (FCDs) has steadily increased. These main groups of epileptogenic lesions are now described in detail:
Hippocampal sclerosis
Background
HS is by far the most common cause of temporal lobe epilepsy and is found in approximately half of patients undergoing resective surgery. Resective surgery, either by anterior two-thirds temporal lobe resection or selective amgydalohippocampectomy, results in complete seizure relief in at least 58% of patients. Conversely, with medical therapy only 8% of patients achieve freedom from seizures.
Imaging
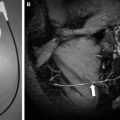
On MR imaging, the sclerotic hippocampus is atrophic and has an increased signal intensity on FLAIR and T2-weighted fast spin-echo images. This pattern is best visualized on thin (2–3 mm thick) coronal images perpendicular to the longitudinal axis of the hippocampus. CNR is higher on FLAIR than on T2-weighted images ( Figs. 3 and 4 ); however, already normal limbic structures have an increased FLAIR signal intensity compared with the remaining cortex. High-resolution T2-weighted fast spin-echo images at 3 T visualize hippocampal substructures precisely (see Figs. 3 and 4 ) and are therefore suited to detect mild forms of HS, which, however, account for only around 5% of epilepsy surgery series. Associated lesions such as amygdala atrophy, entorhinal cortex atrophy, atrophy of ipsilateral corpus mamillare, atrophy of ipsilateral fornix, and gray/white matter demarcation loss of the anterior temporal lobe are also better visualized on 3 T than on 1.5 T MR imaging.
Related posts:
 Current State-of-the-Art 1.5 T and 3 T Extracranial Carotid Contrast-Enhanced Magnetic Resonance Angiography
High-Field Atherosclerotic Plaque Magnetic Resonance Imaging
Current State-of-the-Art 1.5 T and 3 T Extracranial Carotid Contrast-Enhanced Magnetic Resonance Angiography
High-Field Atherosclerotic Plaque Magnetic Resonance Imaging
 Vascular Disorders: Insights from Arterial Spin Labeling
 Current Status and Future Perspectives of Magnetic Resonance High-Field Imaging: A Summary
 Pediatric High-Field Magnetic Resonance Imaging
 Ultrahigh-Field Magnetic Resonance Imaging: The Clinical Potential for Anatomy, Pathogenesis, Diagnosis and Treatment Planning in Neck and Spine Disease
Stay updated, free articles. Join our Telegram channel

Full access? Get Clinical Tree


