chapter 19 Hybrid Imaging
SPECT/CT and PET/CT
Virtually all modern positron emission tomography (PET) scanners and an increasing number of single photon emission computed tomography (SPECT) systems are integrated with an x-ray computed tomography (CT) scanner. These hybrid imaging systems are capable of acquiring PET or SPECT images, along with spatially registered CT images, in quick succession. This chapter discusses the features of these hybrid systems and describes how the CT scans not only provide anatomic context to improve diagnostic interpretation of nuclear medicine studies, but also can be used as the basis for performing corrections for photon attenuation and scatter in PET and SPECT.
A Motivation for Hybrid Systems
The power of hybrid imaging systems, in which a PET or SPECT scanner is integrated with a CT scanner, is that the two scans are acquired in quick succession, and thus the data can be considered to be in fairly good spatial and temporal registration (see Sections C and D). With good spatial registration, it also becomes possible to consider using the CT scan, which provides a map of tissue attenuation values (Section B), to compute the corrections for photon attenuation and scatter for the PET and SPECT studies (see Section E). It also is more convenient for the patient and more efficient from a scheduling perspective, as both datasets are acquired in a single imaging session. Hybrid systems also are common in small-animal and preclinical imaging studies. Just as in the clinical environment, the anatomic information provided by CT can be helpful both for interpreting and quantitatively analyzing PET and SPECT studies.
To date, the focus has been largely on the integration of PET and SPECT with x-ray CT. As described in Sections C and D, from a technical perspective it has been relatively straightforward to integrate these modalities with only minor modifications to the hardware for either system. Much of the integration in hybrid PET/CT or SPECT/CT systems occurs at the software and system control level. Hybrid systems that combine PET and MRI also are under development. MRI has advantages over CT for some structural imaging applications because of the high contrast it can produce in soft tissues; however, integration is much more challenging, and the cost of a combined device could be high. Nonetheless, human scanners have been installed and a brief overview of the status of hybrid PET/MRI systems is given in Section F.
B X-Ray Computed Tomography
X-ray CT is a form of transmission computed tomography that is based on the reconstruction techniques described in Chapter 16. It shares many of the features of transmission scanning that already have been described for attenuation correction for SPECT (see Chapter 17, Section B.3) and PET (see Chapter 18, Section D.4) imaging. However, instead of an external radionuclide source, a CT scanner uses an x-ray tube that generates a high flux of x rays in a relatively narrow beam that are transmitted through the body. Because the flux of x rays is so high, images with excellent counting statistics can be acquired very rapidly, on the order of seconds. This section provides a very brief overview of x-ray CT to aid in the discussion of hybrid PET/CT and SPECT/CT systems that follows. More details on x-ray CT can be found in Reference 1.
1 X-ray Tube
The x-ray tube is a vacuum tube containing a cathode, which consists of a filament (helical coil of tungsten wire) through which a current is passed. As the filament is heated, electrons are liberated, and are accelerated and focused by an applied bias voltage towards a high-density metal (typically tungsten) anode (Fig. 19-1). When the electrons interact in the anode material, they produce both continuous bremsstrahlung radiation (see Chapter 6, Section A.1) as well as discrete characteristic x rays at energies that correspond to the electron binding energies of the anode material (see Chapter 2, Section C.2).
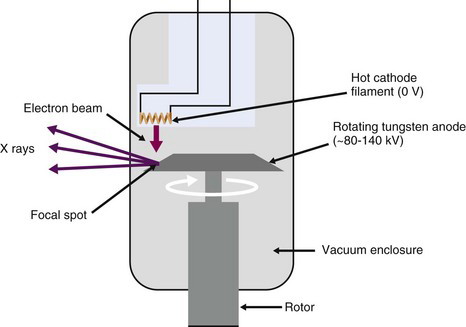
The current passing though the filament controls the number of electrons emitted from the filament, and thus the current flowing through the x-ray tube (the tube current) as well as the flux of x rays produced when these electrons strike the anode. The tube current typically is approximately 10% to 20% of the current passed through the heating filament. The voltage applied between the coil and the anode determines the energy spectrum of the x rays. The highest (peak) x-ray energy that can be produced equals the x-ray tube bias voltage setting in kV. Thus an applied voltage of 120 kV (often denoted as kVp—peak voltage in kilovolts) can produce x rays with a maximum energy of 120 keV. By varying the x-ray tube current and bias voltage, the intensity and energy spectrum of the x-ray beam transmitted through the subject can be controlled. In general, higher energy x rays are used for penetrating larger thicknesses of tissue. On the other hand, image contrast is typically better for lower energy x rays. Thus there is a trade-off in choosing the appropriate x-ray energy that also must carefully consider the radiation dose given to the tissues.
The x-ray beam is filtered by passing the x rays through a sheet of metal (typically 2.5 mm of aluminum for the x-ray energies used in CT) prior to reaching the patient to remove the lowest energy x rays. Such x rays have a very small probability of penetrating through the body, and therefore contribute mostly radiation dose to the patient, without providing any useful signal. The x-ray beam also is collimated such that x rays irradiate only the tissue slices of interest. This is one fundamental way in which x-ray imaging differs from nuclear medicine imaging. With x rays, radiation dose can be limited to the areas being imaged, whereas in nuclear medicine, the radiotracer generally distributes throughout the body and delivers a radiation dose everywhere. Radiation dosimetry is discussed in Chapter 22.
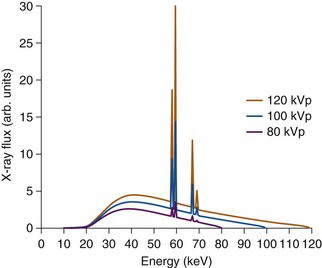
Figure 19-2 shows the typical spectrum from an x-ray tube as the high voltage is varied. Typical values for the x-ray tube settings for CT examinations are a voltage of 120 kV, and a tube current ranging between 120 and 300 mA, depending on the amount of tissue the x rays must penetrate. A lower tube current is used for CT imaging of the head and neck, and a larger current for the abdomen. The number of x rays that are used to form an image is proportional to the product of the x-ray tube current and the exposure time for a given tissue slice and is given in units of milliamps × seconds, commonly abbreviated to mAs for short. The time for which a slice of tissue is exposed to x rays in a CT examination typically is on the order of 0.5 to 2 seconds.
2 X-ray Detectors
The detectors used in a CT scanner typically are scintillator materials [e.g. CsI(Tl) or ceramic scintillators] read out by silicon photodiodes (see Chapter 7, Section C). Some older or low-cost CT systems employ detectors consisting of thin ionization chambers containing high-pressure xenon gas (Chapter 7, Section A.2). Because the x-ray photons arrive at the detectors at very high rates, individual pulses cannot be separated for each interacting x-ray photon. Therefore, unlike nuclear medicine detectors that operate in pulse mode, x-ray detectors operate in an integrating current mode. That is, they produce an output current proportional to the x-ray flux impinging on them.
Older single-slice CT scanners consisted of a single linear detector array, with elements measuring, for example, 1 mm in the transaxial direction and 15 mm in the axial direction. Slice thickness was controlled by collimating the x-ray beam and therefore could be considerably smaller than the physical height of the detector in the axial direction. Slice thicknesses of 1 to 5 mm were typical. To acquire multiple image slices, the patient bed was stepped incrementally through the system.
3 X-ray CT Scanner
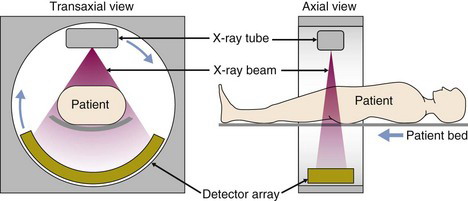
The CT scanner consists of the x-ray tube and a step-up high-voltage power supply, along with the detector, mounted on a rotating gantry (Fig. 19-3). Low-voltage power is supplied to the gantry via slip-ring technology rather than by cables. The slip rings consist of conductive brushes that slide over the surface connections providing continuous electrical contact and allowing the gantry to rotate continuously. Data can be taken off the gantry in the same way or, more commonly, by wireless transmission. This enables very fast data acquisition as the patient moves through the gantry while it rotates at speeds of 1 to 3 revolutions per second. A large axial stack of images can be acquired in just a few seconds.
4 CT Reconstruction
The projection data for CT typically are collected as the scanner performs a helical trajectory, where the patient bed is translated through the scanner while the x-ray tube and detector rotate. They are readily sorted into stacks of sinograms with each sinogram containing the data for a single transaxial section through the patient. Images commonly are reconstructed using the same types of filtered backprojection methods discussed in Chapter 16, Section B.
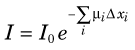
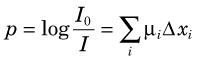
where I0 is the initial x-ray intensity directed along the line of response, µi is the linear attenuation coefficient (Chapter 6, Section D) for the ith pixel and Δxi is the pathlength of the line of response through the ith pixel. X-ray CT seeks to reconstruct the linear attenuation coefficient µ; therefore the measured data must be transformed prior to reconstruction by taking the logarithm of the ratio of the incident x-ray intensity with respect to the measured intensity. The transformed projection, p, used in the reconstruction algorithm is therefore given by:
Given the x-ray energies used and the relatively low atomic number of most tissue constituents, the majority of x-ray interactions in the body are by Compton scatter (see Chapter 6, Section C.3). Because Compton scatter depends primarily on tissue density (see Chapter 6, Section D.1), the pixel value in CT images is roughly proportional to tissue density. Higher-density materials such as bone show up with high pixel values, whereas lower-density tissues such as lung show up with low pixel values.
Note that the reconstructed values represent some average of µ across the range of energies present in the x-ray beam (see Fig. 19-2) and therefore depend strongly on the x-ray tube voltage and filtration. For this reason, pixel values in CT images usually are expressed on a normalized scale, with respect to the values for water, as follows:
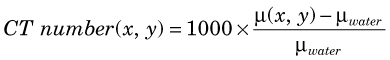
CT numbers calculated from Equation 19-3 are called Hounsfield units (HU), named after the inventor of medical CT scanning. By definition, water has a value of 0 HU, air spaces in the lungs have values that can approach –1000 HU, and bone can have values as high as 3000 HU.
CT projection data are subject to the same sampling requirements as nuclear medicine data (see Chapter 16, Section C.1). Angular projection data are captured as the system rotates and acquired at ~1000 to 2500 projection angles. The linear sampling distance is governed by the detector element spacing and typically is in the range of 0.25 to 1 mm. Thus the sampling of projection data in CT datasets is sufficient to support much higher spatial resolution than is obtained in nuclear medicine studies; however, the size of the projection datasets also is much larger. In practice, the spatial resolution obtained in CT is limited by the focal-spot size of the x-ray tube and also by radiation dose considerations. A reconstructed spatial resolution of approximately 1 mm is typical in many clinical scenarios.
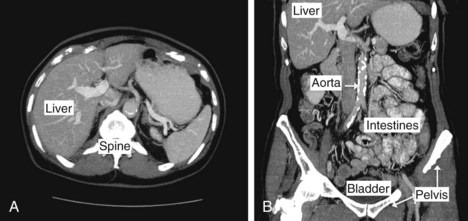
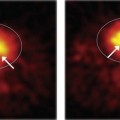
Figure 19-4 shows examples of reconstructed CT images of the human body. In this study, a large number of transverse slices were obtained to produce a volumetric dataset covering the entire abdominal region. A transverse and coronal view are shown. In many clinical studies, native tissue contrast is augmented by the injection or ingestion of a contrast agent. These agents, typically containing high-Z elements such as iodine (injected agents) or barium (ingested agents), serve to increase x-ray attenuation in tissues in which they are present. They are used to increase contrast in the vasculature, in highly perfused organs and tissues with leaky blood vessels (e.g., tumors), to detect internal bleeding, or to highlight the digestive and excretory tracts of the body.