Fig. 16.1
Focal myocardial hypertrophy. Images in different planes (with corresponding scanlines) serve as a reference “road map” to pinpoint the location of focal hypertrophy and to precisely measure the true maximal wall thickness, a metric which has been associated with increased risk of cardiac events. (a) In this HCM patient, a basal short-axis slice shows a focal area of increased septal wall thickness confined to the anterior septum with normal wall thickness in other segments. Maximal wall thickness was 16.6 mm. Corresponding 4-chamber (b) and 2-chamber (c) views demonstrate the difficulty in appreciating the true geometry of the left ventricle walls without the short-axis slice
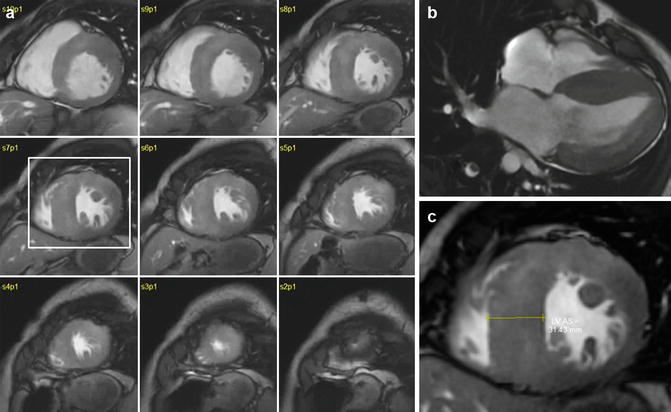
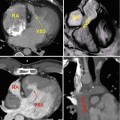
Fig. 16.2
Concentric hypertrophy on the left ventricle (LV). (a) Short-axis stack shows extreme hypertrophy in most segments. Note the relative sparing of the right ventricular walls. (b) 4-chamber slice showing the degree of hypertrophy in all of the LV walls. (c) Enlarged view of slice 7, showing maximal wall thickness of 31 mm. Overall LV mass was 311 g, with an LV mass index of 185 g/m2. Based on this finding and after a balanced discussion with the patient, a prophylactic ICD was placed due to the high risk of sudden death associated with extreme hypertrophy
Characterization of Anatomy
LV Hypertrophy
CMR has the unique ability to acquire truly tomographic high-resolution images in any anatomic plane without ionizing radiation, thus making it a particularly useful tool for precisely characterizing the HCM phenotype. Balanced steady state free precession (SSFP) cine imaging sequences result in a sharp delineation of myocardial borders due to the high contrast between a relatively dark myocardium and bright blood pool. This allows for accurate measurements of wall thickness in any region of the LV chamber. By using contiguous short-axis slices, a clear and comprehensive presentation of the entire myocardial geometry from the base to apex can be achieved, resulting in precise and reproducible quantification of chamber volumes, LV mass, and systolic function (Figs. 16.1 and 16.2).
Focal areas of LV hypertrophy in the anterolateral free wall, apex, and posterior septum may not be well seen (or the extent underestimated) by echocardiography due to the inability to discriminate the epicardial borders of the heart from noncardiac structures, or due to anatomic interference from thoracic or pulmonary parenchyma (Fig. 16.3). Furthermore, there is evidence to suggest that in some HCM patients, echocardiography can substantially underestimate the magnitude of hypertrophy compared with CMR [13], particularly in patients with focal areas of increased LV wall thickness confined to the anterolateral wall [14] (Fig. 16.3c).
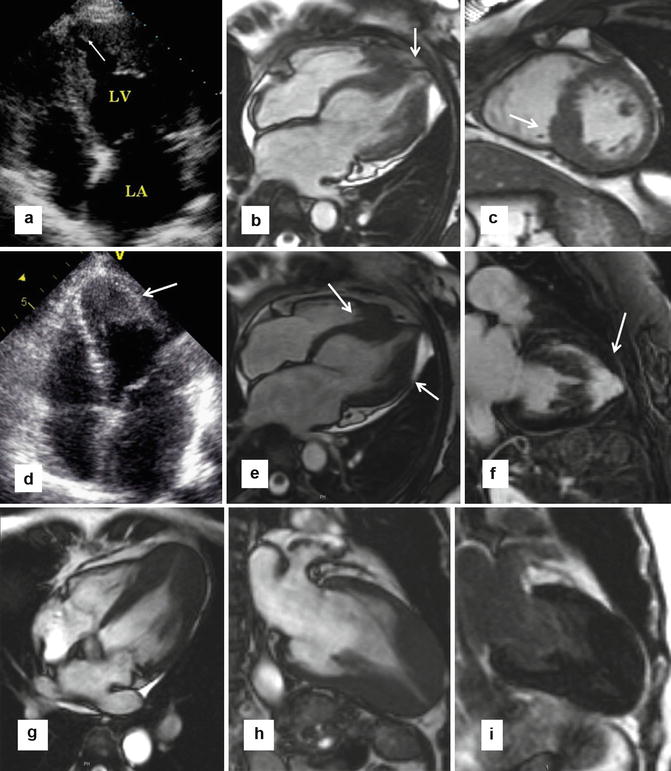
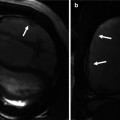
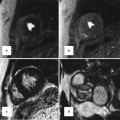
Fig. 16.3
Echocardiography weaknesses. (a, b) Patient with flipped T waves on lateral leads during a screening ECG leads to echocardiography, but was nondiagnostic due to incomplete visualization of the apex and apical lateral walls (a). In this case, steady state free precession (SSFP) MR (b) showed substantial hypertrophy at the apex as well as a small apical aneurysm (arrow). (c) Focal hypertrophy of the mid-inferior septum (arrow), which was underappreciated in echocardiography. (e, f) In a different patient, echocardiography suggested thickening of the apex (arrow in d); however, the endocardial borders were not clearly visualized. Corresponding 4-chamber cine slice (e) precisely delineating the degree and location of apical hypertrophy (arrows). Late gadolinium enhancement (LGE) imaging shows extensive enhancement in the apex and the anterior wall (arrow). (g–i) Patient with apical variant HCM without evidence of LGE. 4-chamber (g) and 2-chamber SSFP images clearly show the hypertrophy localized to the apex. 2-chamber late gadolinium enhancement (i) shows no abnormal enhancement
Apical HCM is characterized by hypertrophy of the myocardium, predominantly in the left ventricular apical area. This variant of HCM is rare in Western countries (1–2 %) but is common in Japanese and other Asian populations (up to 25 %). Typical features of apical HCM include giant negative T waves on ECG, mild symptoms, and a generally more benign course. Other morphological findings of this disease include cavity obliteration and apical sequestration (Fig. 16.3). Echocardiography has limitations for demonstration of the apex and may miss apical HCM. This limitation is not encountered with cardiac MRI.
CMR can also easily facilitate the identification of patients with massive hypertrophy (maximal wall thickness ≥30 mm) which is considered a high-risk feature and warrants consideration of primary prevention implantable cardioverter-defibrillator (ICD), even in the absence of any other risk markers (Fig. 16.2) [15]. CMR can identify myocardial crypts, which are more common in genotype-positive but phenotype-negative patients (i.e., without LV hypertrophy), and may help identify HCM family members to be considered for diagnostic genetic testing (Fig. 16.4) [16, 17].
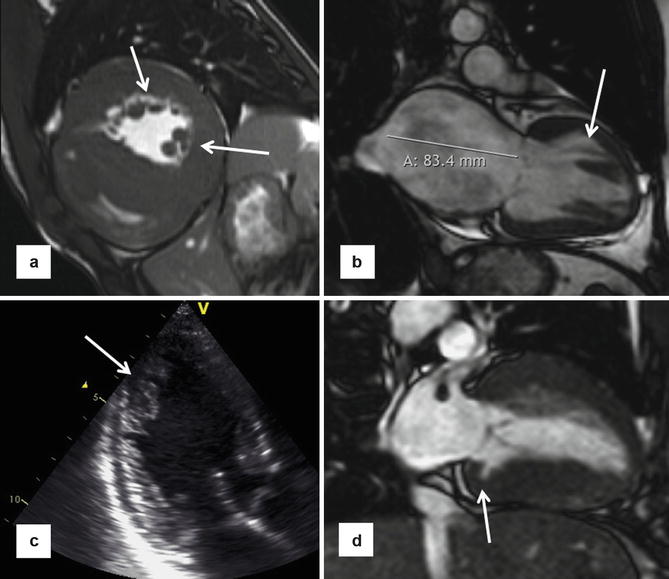
Fig. 16.4
Different phenotypic expressions of HCM. (a) Multiple accessory papillary muscles (arrows) seen on short-axis CMR. (b) End-stage HCM with left ventricle ejection fraction =30 %. Note the markedly enlarged left atrium and the presence of apicobasal bundle (arrow). (c) Myocardial crypts (arrow) seen in mid-inferolateral wall on echocardiogram in 3-chamber view. (d) Different patient with a myocardial crypt (arrow) seen in basal inferior wall
LV mass calculated from planimetry of short-axis slices provides an excellent assessment of the overall extent of LV hypertrophy, as there is tremendous variability in the patterns of hypertrophy in regions remote from maximal LV wall thickness. LV mass is therefore a more robust measure of the overall extent of LV hypertrophy. There is recent evidence that marked increase in LV mass index may be more sensitive in predicting adverse outcome (including sudden death), while maximal wall thickness >30 mm was more specific [18]. However, its relevance as an independent marker for predicting adverse outcomes such as sudden death (SD) is still not well defined.
RV Hypertrophy
Precise delineation of right ventricular morphology has been challenging with echocardiography due to its complex three-dimensional geometry and its orientation within the thorax. The unique ability of CMR or CT to obtain or reconstruct images in any orientation provides tools for robust assessment of the RV. Recent studies have demonstrated increased RV wall thickness (≥8 mm) in over 1/3 of HCM patients, with an important proportion of patients who have an increased RV wall mass [19, 20].
In addition, approximately half of HCM patients will demonstrate hypertrophy of the septal band and the crista supraventricularis (Fig. 16.5) which is an RV muscle structure that is often positioned adjacent to the basal anterior septum [21–23]. As a result, it can sometimes be erroneously included in the measurement of the ventricular septum, which can lead to overestimations in LV maximal wall thickness. It is important to clarify the anatomy by carefully examining cine loops and seeing the crista move off the septum at various stages of the cardiac cycle. The morphological phenomena of hypertrophied crista supraventricularis and increased RV wall thickness support the principle that HCM is a disease process that can involve the right ventricle, rather than exclusively the LV.
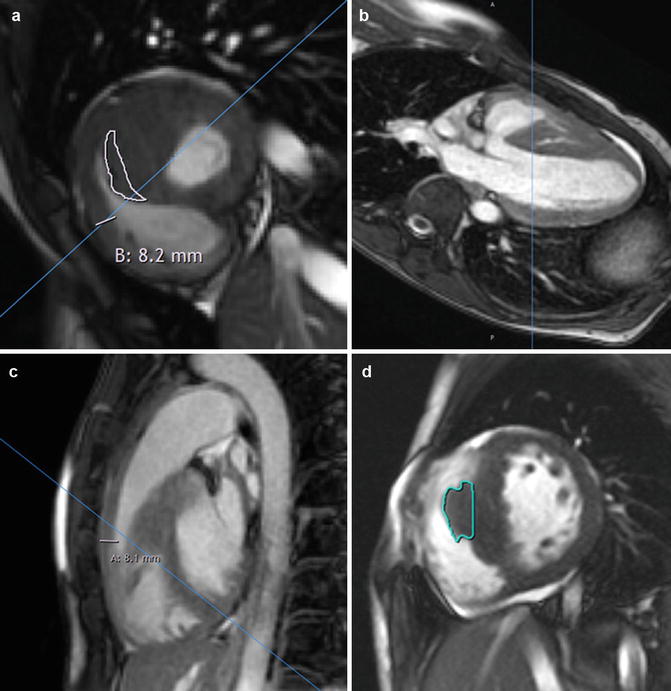
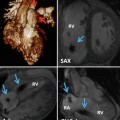
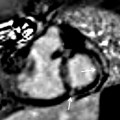
Fig. 16.5
Right ventricular (RV) septomarginal trabeculation and crista supraventricularis can be mistakenly incorporated in the intraventricular septum measurements. (a) HCM patient with very prominent septal band muscle (outlined in white), as well as increased thickness of right ventricular anterior free wall of 8.2 mm. Due to the location of this muscle adjacent to the septum, incorrect inclusion of its dimensions when measuring the left ventricle (LV) septal thickness may lead to overestimation of the maximum LV wall thickness. Close inspection of the cine short-axis stack confirms that this structure indeed moves away from the septum toward the RV cavity. Furthermore, views from other orientations with scanlines in (b) (modified 5-chamber view) and (c) (RV outflow tract view) confirm the location of the circumscribed area of thickness is in the right ventricular cavity rather than part of the septum. (d) Another patient with hypertrophied septomarginal trabeculation, with its structure outlined
LV Outflow Tract Obstruction
Subaortic obstruction in HCM is caused by anterior leaflet of the mitral valve (rarely the posterior leaflet) making contact with basal septum in mid-systole (SAM-septal contact) (Figs. 16.6 and 16.7). The Venturi effect was originally hypothesized to be the mechanism by which systolic anterior motion (SAM) of the mitral valve leaflet and chordal structures occurs. However, recent evidence has pointed to flow drag, which is the force of flow from a hyperdynamic ventricle, to be the primary hemodynamic force for pushing the mitral valve toward the septum. Hence, complete characterization of the mitral valve apparatus (including the chordal structures and papillary muscles), and their influence on the pathophysiology of LV outflow tract (LVOT) obstruction, has important therapeutic implications. There is also emerging evidence that the angle between LVOT and aortic root may be related with outflow tract gradient [24]. The elevated LV systolic pressures resulting from outflow tract obstruction lead to increased wall stress, venous congestion, myocardial ischemia, and mitral regurgitation. Fibrosis may lead to diastolic dysfunction and may also be a substrate for unstable arrhythmias (see discussion below on LGE).
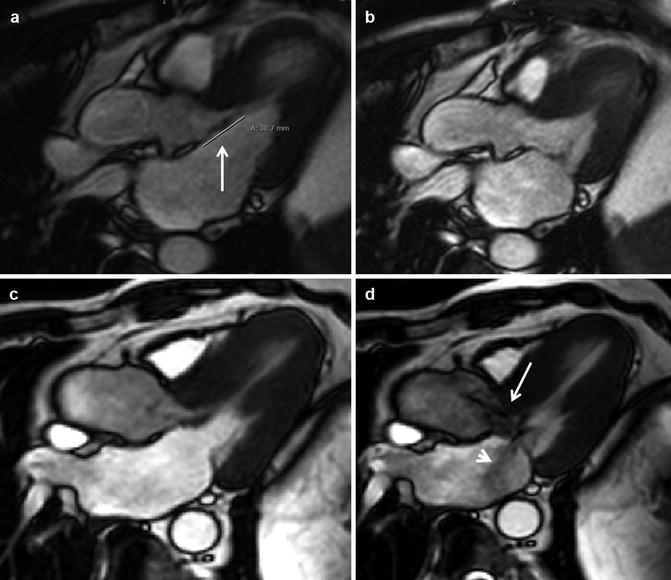
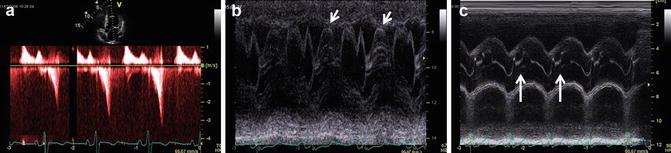
Fig. 16.6
Elongation of mitral valve leaflet length has been identified as a primary phenotypic abnormality in patients with HCM phenotype or genotype. (a) Patient with anterior mitral leaflet length of 31 mm (arrow), (b) Without systolic anterior motion or mitral regurgitation. (c) Patient with anterior mitral leaflet length of 31 mm and posterior mitral leaflet length of 23. (d) There was marked leaflet and chordal systolic anterior motion leading to an LVOT gradient of >80 mmHg. Note the dephasing jet indicative of turbulence through the LVOT (arrow) as well as dephased blood in left atrium (arrowhead) indicative of mitral regurgitation
Fig. 16.7
Some classical echocardiographic findings found in HCM patients with left ventricle (LV) outflow tract obstruction, illustrating the anatomy and hemodynamic effects as a result of the obstruction. (a) Continuous wave Doppler through the LV outflow tract in 5-chamber view showing typical dagger-shaped flow indicative of dynamic obstruction. (b) M-mode through mitral valve leaflets in parasternal long axis showing valvular systolic anterior motion (arrows). (c) M-mode through aortic valve leaflets in parasternal long axis showing premature closure in mid-systole (arrows)
Cine CMR can accurately locate in 3 dimensions the origin of high-velocity blood flow, frequently in the region of SAM-septal contact, which is visualized as a signal void from dephased blood (Fig. 16.6). Although SSFP sequences are less sensitive to dephasing from turbulent blood flow compared with gradient recalled echo (GRE) sequences, hemodynamically significant outflow tract gradients usually result in visually apparent signal voids to easily locate the origin of the obstruction. Phase contrast (PC) MR can be obtained if subaortic hypertrophic obstructive cardiomyopathy (HOCM) is suspected. For accurate measurements, it is important that the plane of PC image is adjusted perpendicular to jet of blood flow in subaortic region and the velocity encoding (VENC) value is set high enough to prevent aliasing. However, due to the superior temporal resolution of Doppler echocardiography, it is preferable to use gradient measurements obtained from echocardiography when making treatment decisions.
Furthermore, fixed LVOT obstruction by a subvalvular membrane and aortic valve stenosis must be ruled out, usually through the use of echocardiography. The presence of an outflow tract gradient in the absence of SAM-septal contact is highly suggestive of a subaortic membrane.
Basal LVOT gradients ≥30 mmHg due to SAM-septal contact are a strong independent determinant of heart failure (HF) symptom progression, HF death, stroke death, and all-cause mortality [25]. The identification of obstruction at rest or following exercise opens up treatment options not available to nonobstructed patients, including surgery and alcohol septal ablation. Therefore, identifying obstruction is a critical issue in the diagnostic workup for HCM patients.
The limiting factor is the dynamic nature of LVOT obstruction [26, 27], where CMR can only assess a patient reliably under basal conditions. One-third of HCM patients will only have outflow obstruction transient during activity or provocation. Thus, clinical management decisions regarding outflow obstruction should be predicated on measurements from echocardiography (with or without stress/provocative maneuvers) (Fig. 16.8) [28].
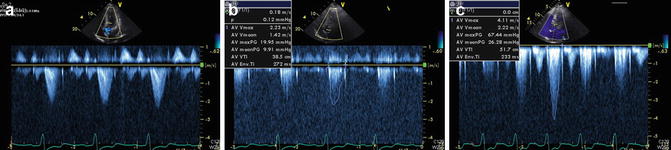
Fig. 16.8
Left ventricle (LV) outflow tract obstruction is a dynamic process. This is an echocardiogram of an HCM patient with marked dyspnea during exertion showing continuous wave Doppler gradients across LV outflow tract. (a) At rest – no significant gradient seen. (b) With Valsalva maneuver – no significant change in gradients. (c) During exercise – significant LV outflow tract obstruction with peak gradient >60 mmHg. Patient’s symptoms were well controlled with titrating doses of beta-blockers
Papillary Muscles
Abnormalities in papillary muscle morphology are common, including papillary muscle hypertrophy, anteroapical displacement, double bifid, direct insertion into mitral leaflets, fusion to ventricular septum or free wall [11, 29–32], and accessory papillary muscles (including apicobasal muscle bundles [33]) (Fig. 16.9). Cardiac MR can be used to reliably characterize papillary muscle anatomy by accurately identifying their number, location, and position in the LV chamber (Fig. 16.10). When compared with controls, there appears to be an increased number of papillary muscles, in addition to an increased papillary muscle mass. Papillary muscle mass is related to overall LV mass index. However, subgroups of patients have normal LV mass but increased papillary muscle mass [30]. These observations broaden our understanding of HCM phenotype to include structures beyond the left ventricular wall and suggest that the same disease pathophysiology responsible for LV hypertrophy may also be involved in papillary muscle hypertrophy.
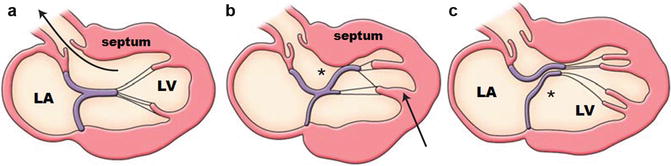
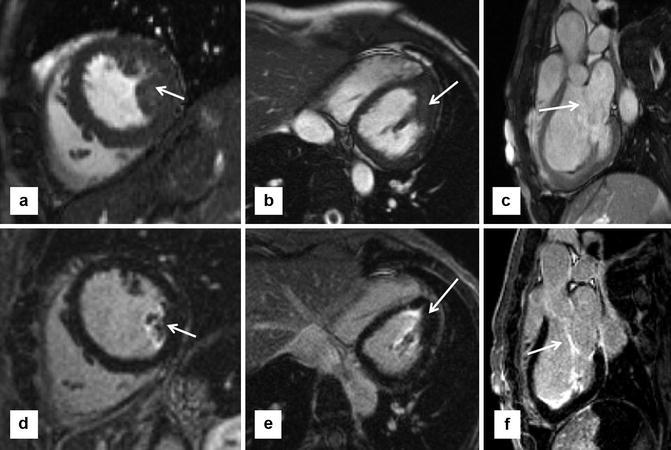
Fig. 16.9
Schematic of septum, papillary muscle, and mitral valve anatomy and their contribution to LV outflow tract obstruction and mitral regurgitation. (a) Normal papillary muscle and mitral valve location and length. Note the unimpeded flow through the LV outflow tract. (b) Anteroapical displacement of thickened papillary muscle (arrow), with lengthened anterior mitral valve leaflet (*) and thickened septum leading to significant outflow tract obstruction. (c) Double bifid papillary muscles with lengthened posterior mitral valve leaflet (*), leading to chordal and valvular systolic anterior motion, outflow tract obstruction, malcoaptation, and mitral regurgitation (Figures copyright Raymond H Chan)
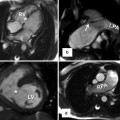
Fig. 16.10
Papillary muscle hypertrophy and mitral valve abnormalities are primary anatomic features of HCM, which affect more than the left ventricle (LV) walls. (a) Short-axis steady state free precession (SSFP) shows prominent size of posterior papillary muscle (arrow), despite relatively normal wall thicknesses. (b) Modified 4-chamber SSFP confirms marked enlargement of posterior papillary muscle (arrow). (c) LV outflow tract (LVOT) view shows elongated anterior mitral valve leaflet. (d–f) Show late gadolinium enhancement (LGE) imaging in corresponding views. Note enhancement seen in papillary muscle (d, e) and mitral valve leaflets (f) (arrows). The clinical significance of LGE in these structures is unknown
Certain abnormalities in papillary muscle anatomy have been shown to be related to LVOT obstruction. Papillary muscles appear to be positioned more anteriorly and closer to the ventricular septum in those with LVOT obstruction at rest and had more marked hypertrophy compared to those without obstruction [30]. Anteroapical displacement of anterolateral papillary muscles and double bifid papillary muscles have been found to be independently associated with significant outflow gradients, even after controlling for septal thickness [29]. Patients with significant outflow tract obstruction also have papillary muscles closer to the ventricular septum (Fig. 16.9) [30]. Prior to more widespread use of CMR, such abnormalities are often not well appreciated by echocardiography and thus missed and were only seen during surgery by direct inspection [22]. Papillary muscle mobility may also play an important role in dynamic LV outflow tract obstruction during exercise (Fig. 16.8). Complete visualization of papillary muscle anatomy is therefore a clinically important step in the management of patients with LVOT obstruction.
The above evidence supports the hypothesis that accessory and apically displaced papillary muscles contribute significantly to LVOT obstruction, by pulling the plane of the mitral valve toward the septum. As a result, they are often removed during surgery, and therefore, their identification by imaging can aid in preoperative surgical planning. Furthermore, CMR can identify anomalous papillary muscle insertion into the mitral valve, which can redirect patients toward surgery rather than alcohol septal ablation, since this abnormality causes mid-ventricular obstruction not amenable to percutaneous approach.
Mitral Valve Leaflet Anatomy
Mitral valve leaflets appear to be elongated independently of other morphological characteristics such as LV thickness or mass and may represent a primary phenotypic characteristic of HCM [34]. Such elongated leaflets play an important role in generating LV outflow tract gradients, particularly in those whose relative anterior mitral leaflet length exceeds twice that of the transverse LV outflow tract diameter (Fig. 16.6) [34]. The anterior mitral leaflet (AML) has more redundancy and mobility [35]. There is also a significant relationship between the ratio of AML length and LVOT diameter with length and the magnitude of outflow tract gradient. Extreme lengths of the AML may potentially produce mitral-septal obstruction even after extensive septal muscle resection. Increased mitral valve leaflet length may also serve as a marker of gene-positive status in HCM in family members without LV hypertrophy.
As a result of mitral leaflet malcoaptation due to systolic anterior motion (SAM), mitral regurgitation jets can also be seen as a signal void in the left atrium. These jets are often posteriorly directed due to relatively greater SAM of the AML compared to the posterior leaflet (Fig. 16.6). The regurgitant jet volume can be quantitated by comparing the left ventricular stroke volume by planimetry of SSFP images with the aorta flow obtained from phase contrast sequences.
Planning for Surgical Myectomy
Surgical myectomy is the gold standard for symptomatic relief in patients with significant LV outflow obstruction on maximal medical therapy [9]. As outlined above, CMR can be helpful by clear delineation of the relative three-dimensional anatomy of the LV outflow tract, mitral valve, and the subvalvular apparatus [28]. Accessory papillary muscles which may contribute to obstruction can be identified for planned removal. Important measurements for operative planning include maximal septal thickness, distance of maximum thickness from aortic annulus, and the apical extent of septal bulge. Careful CMR planning using multiple thin slabs with no gaps in the LV outflow tract orientation can be extremely helpful by providing precise and reproducible measurements. This anatomic information should supplement rather than supplant those obtained from transesophageal echocardiogram (TEE).
Evaluation After Alcohol Septal Ablation
Using late gadolinium enhancement imaging, CMR can objectively quantify the amount of necrosed tissue, as well as its location in relationship to the LVOT (Fig. 16.11). This may help in the assessment of patients who achieve suboptimal results after ablation or when gradients recur late after the procedure.
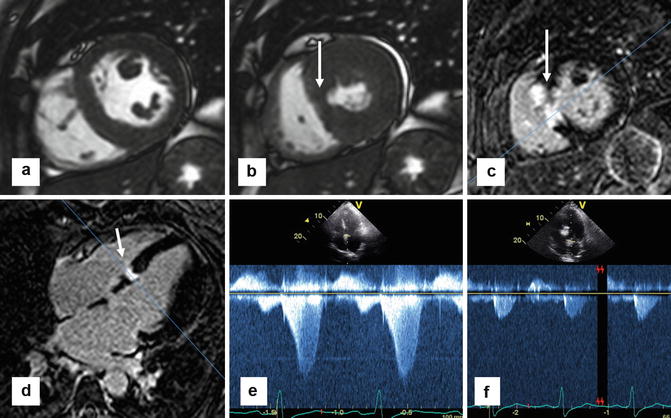
Fig. 16.11
Cardiac MR can be helpful in the evaluation of patients after alcohol septal ablation. These series of images are from a patient who had a successful alcohol septal 2 months prior to MR. (a) Short-axis steady state free precession (SSFP) slice showing small area of infarcted myocardium that fails to thicken during systole in (b) (arrow). Corresponding LGE imaging in short-axis (c) and 4-chamber view (d) showing focal area in the basal septum with bright transmural enhancement secondary to induced infarction from the alcohol septal ablation (arrow). (e) Prior to the alcohol septal ablation, continuous wave Doppler echocardiography shows a significant LVOT gradient well over 50 mmHg. (f) 2-month post-alcohol septal ablation, there is no clinically significant LVOT gradient
LV Apical Aneurysms
HCM patients with LV apical aneurysms are a previously under-recognized subgroup prior to more widespread use of CMR in these patients. Its prevalence is low at 2 % [36]. It is characterized by thin-walled, akinetic, or dyskinetic segments in the LV apex (Fig. 16.12). Often, these segments are composed of fibrotic tissue which can be seen as a transmural pattern of late gadolinium enhancement (Fig. 16.13). Like apical hypertrophy, echocardiography may not reliably detect these aneurysms because of its technical limitations, where in one study the sensitivity was only 57 % [37].
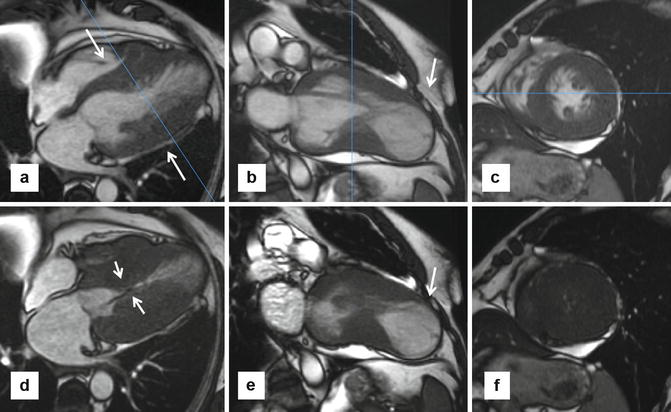
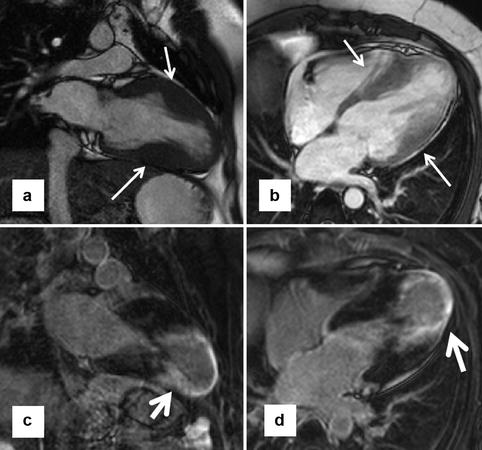
Fig. 16.12
Apical aneurysms. Patients with apical aneurysms represent a small subgroup of high-risk patients. Several mechanisms for aneurysm development have been proposed, including mid-cavitary obstruction. These series of steady state free precession (SSFP) images are from a patient with harsh systolic murmur and shortness of breath, diagnosed with hypertrophic cardiomyopathy with apical aneurysm and mid-cavitary obstruction, with intraventricular gradient >80 mmHg by echocardiogram. (a–c) Are diastolic and (d–f) are systolic views. 4-chamber slice (a) shows dramatic mid-ventricular hypertrophy (arrows) at end diastole and near obliteration of mid-cavity at systole with a jet of dephased blood (arrows in d) indicative of turbulent flow. 2-chamber views in systole (b) and diastole (e) showing noncontractile large apical aneurysm (arrows). Late gadolinium enhancement imaging did not show any evidence of enhancement, refuting the hypothesis that myocardial fibrosis and subsequent dilation is the mechanism of aneurysm formation
Fig. 16.13
Enhancing apical aneurysm. A young patient with hypertrophic cardiomyopathy and apical aneurysm presented with a recent stroke (presumed to be cardioembolic). (a, b) Focal hypertrophy in the mid-left ventricle (arrows), with a dyskinetic apical aneurysm. Corresponding late gadolinium enhancement (LGE) images on similar planes (c, d) show substantial enhancement of the left ventricle apex and the periapical regions (arrows)
Several mechanisms have been proposed, including genetic disposition, presence of myocardial bridging of the left anterior descending artery, and mid-cavitary obstruction causing elevated pressures leading to myocardial fibrosis. The true mechanism of aneurysmal formation is likely multifactorial, as each of the above characteristics has been shown to occur in a small minority of patients [37]. Mid-ventricular hypertrophic obstructive cardiomyopathy (HOCM) is characterized by asymmetric left ventricular hypertrophy and by a pressure gradient between basal and apical sites in the left ventricle. These patients are often symptomatic and prone to ventricular arrhythmias arising from the distal left ventricular aneurysm (Fig. 16.13).
Recent evidence shows that adverse event rates in the subgroup with apical aneurysms are substantial at ~10 % per year, including sudden death, ICD discharges, nonfatal thromboembolic stroke, progressive heart failure, and death [37]; thus, patients with apical aneurysms are considered a high-risk subgroup. Often, fibrosis can extend from the aneurysm to the periapical regions in the septum and free wall and may thus serve as a substrate for malignant dysrhythmias [38]. Patients should be considered for ICD implantation for primary prevention of sudden death, particularly those with extensive LGE [10]. Dyskinetic and akinetic segments may harbor pools of stagnant blood flow, leading to the formation of intracavitary thrombi and subsequent thromboembolic strokes. Among those with a sizable apical aneurysm, there may be a potential role for anticoagulation for stroke prophylaxis.
Fortunately, ventricular rupture is not common despite marked thinning of the myocardium at the apex; thus, prophylactic surgical resection is not warranted.
Tissue Characterization
Late Gadolinium Enhancement (LGE)
Current risk stratification algorithms for sudden cardiac death (SCD) in HCM are imprecise and not always definitive, as SCD occasionally occurs in patients without conventional risk factors (Fig. 16.14). Identification of additional markers to allow more precise selection of those patients who may benefit from primary prevention ICD therapy represents a major clinical aspiration in HCM. Recently, contrast-enhanced CMR with late gadolinium enhancement (LGE) has emerged as an imaging technique to noninvasively identify myocardial fibrosis in coronary artery disease and other cardiomyopathies, including HCM. The prognostic value of LGE in HCM patients has been the subject of immense interest since the first large study demonstrated a possible association between LGE and adverse events [39–44].
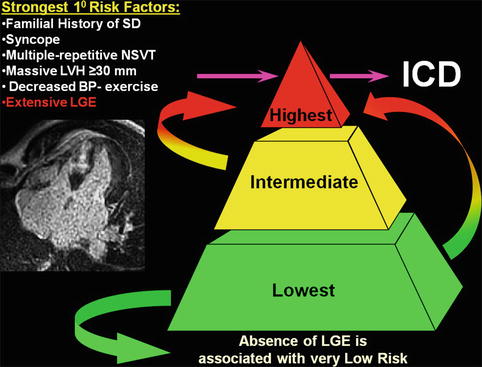
Fig. 16.14
Contrast-enhanced CMR with late gadolinium enhancement can be an arbitrator for implantable cardioverter-defibrillator (ICD) placement decisions in HCM patients whose risk remains ambiguous after assessment with conventional risk factors such as a familial history of sudden death, history of unexplained syncope, multiple episodes on non-sustained ventricular tachycardia, massive left ventricular hypertrophy (LVH), and abnormal blood pressure response to exercise. Furthermore, extensive late gadolinium enhancement (LGE) by itself can identify HCM patients at increased sudden death risk, in whom prophylactic ICD therapy would otherwise not be considered. Conversely, the absence of LGE is associated with low risk of sudden death (SD) and therefore a potential source of reassurance to patients. NSVT non-sustained ventricular tachycardia
Pathophysiology of LGE
Myocardial fibrosis may be a manifestation of the repair process emanating from microvascular dysfunction and silent ischemia in a large proportion of HCM patients. It has been postulated that LGE mostly represents such areas of myocardial fibrosis. However, much of the histopathological correlations with LGE imaging have been extrapolated from CMR-based animal models involving myocardial infarctions [45]. Only a small number of case reports with explanted end-stage HCM patients [44, 46] and small case series of patients who underwent myectomies [47, 48] have provided direct comparison of LGE to histopathology in HCM. Furthermore, it has been shown that the junction of the septum and right ventricular walls (the so-called RV insertion points) may in fact be areas of expanded extracellular space due to intersecting myocardial fibers rather than myocardial fibrosis (Fig. 16.15) [49]. There is currently no suitable HCM animal model available for study. Thus, the precise mechanism by which LGE occurs in HCM is still uncertain [50], but there is strong circumstantial evidence to support the paradigm of LGE representing areas of replacement fibrosis, particularly in end-stage HCM.
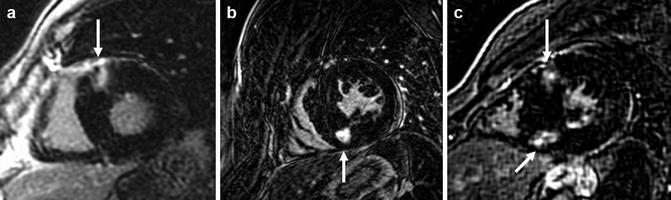
Fig. 16.15
Short-axis slices of late gadolinium enhancement (LGE) imaging, showing the classical “insertion point” enhancement described in various cardiomyopathies, including HCM. (a) Prominent LGE seen in isolation at the anterior RV insertion point (arrow), (b) at the inferior insertion point (arrow), and (c) at both the anterior and inferior insertion points (arrows)
Pattern and Distribution of LGE
Prevalence of LGE is high, with a range between 40 and 80 % depending on patient population. Almost any pattern, distribution, and location of LGE can be observed in HCM (Fig. 16.16). Most commonly, it occurs in a patchy mid-wall distribution, usually involving segments with greatest degrees of hypertrophy [40, 44]. This is likely reflective of the severity of chronic microvascular ischemic damage leading to replacement fibrosis. Patients with greater maximal wall thickness and LV mass index tend to have greater extent of LGE [40, 44] (Fig. 16.17). LGE can be commonly localized to the RV insertion points, likely secondary to myocyte disarray and expansion of extracellular space rather than fibrosis (Fig. 16.15) [49]. As well, LGE can be found in the right ventricular wall and papillary muscles (Fig. 16.10). There is a strong inverse relationship between LVEF and the extent of LGE. Patients with end-stage HCM with depressed ejection fraction usually have extensive LGE seen in all segments (Fig. 16.18) [40, 44, 51]. LGE should not correspond to a coronary vascular distribution, unless there is concomitant coronary artery disease.
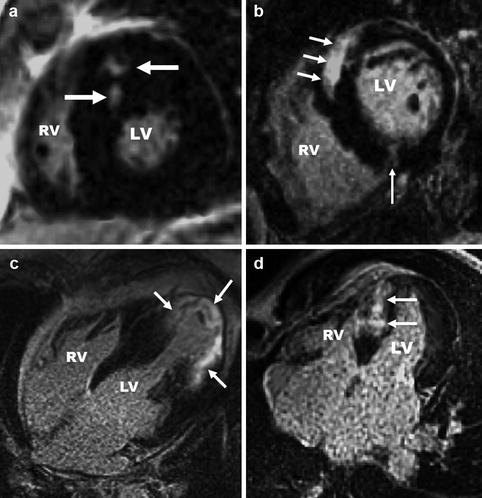


Fig. 16.16
Late gadolinium enhancement (LGE) patterns. Almost any pattern, distribution, and location of LGE can be observed in HCM. (a) Basal left ventricle (LV) short-axis image from an asymptomatic 29-year-old man with no conventional risk factors and focal areas of LGE confined to mid-myocardial anterior wall (arrows), encompassing 4 % of LV mass. (b) Mid-LV short-axis image from a 61-year-old woman, with substantial LGE (23 % of LV mass) involving basal anterior septum and contiguous anterolateral free wall (thick arrows) as well as a focal area at the intersection of the RV free wall and posterior septum (thin arrow). A short five beat run of NSVT on 24-h ambulatory Holter ECG was the only evidence for increased sudden death risk. Extensive LGE acted as an arbitrator for the decision to implant an ICD for primary prevention, which terminated an episode of rapid ventricular tachycardia 5 months later. (c) 4-chamber long-axis image from a mildly symptomatic 54-year-old man without conventional sudden risk factors, normal ejection fraction (60 %), and extensive, transmural LGE involving the distal posterior septum, apex, and lateral free wall (arrows) encompassing 36 % of LV mass. One year after implantable cardioverter-defibrillator (ICD) placement, this patient received an appropriate ICD shock for rapid monomorphic ventricular tachycardia. (d) 4-chamber long-axis image from a 29-year-old man with extensive LGE involving large portions of ventricular septum (arrows) encompassing 32 % of LV mass. Over the follow-up period, he developed the end-stage phase of HCM (EF <50 %) associated with progressive heart failure symptoms (NYHA class III), currently under consideration for heart transplantation
Related posts:
Stay updated, free articles. Join our Telegram channel
Full access? Get Clinical Tree
