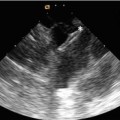
Fig. 3.1
Typical CMR examination in adult congenital heart disease (Image courtesy of Han Kim, MD, Duke University Medical Center)
Our institution’s protocol begins with localizer images to center the patient in the magnet and to obtain basic views on which follow-up imaging can be planned. We then perform electrocardiogram (ECG)-gated cine imaging and start by obtaining a short axis stack of images from the apex through the atria. We image through the atria rather than stopping at the base of the ventricles in order to look for atrial septal defects, venous connection anomalies, or baffle leaks/obstructions (i.e., post-atrial switch, post-Fontan). A cine four-chamber view of the heart is obtained next, and a stack of the images from the posterior surface of the heart through the great arteries is performed (alternatively, a series of images in a true axial plane, rather than oriented to the axis of the heart, can be performed). Two- and three-chamber cine images of the left ventricle and a two-chamber image of the right ventricle from an anterior perspective allowing visualization of inflow through the tricuspid valve and outflow out the pulmonary valve are performed next. En face views of the aortic and pulmonary valves are planned off double orthogonal images of the left and right ventricular outflow tracts, respectively. These images are later used for planning flow analysis. Cine imaging is then followed by morphology imaging. Stacks of non-gated black blood and bright blood images (preferably single shot) are obtained through the heart and associated vessels in the axial, sagittal, and coronal planes for both sequences. A gated contrast angiogram of the appropriate anatomy may be performed with gadolinium-based contrast. Contrast-enhanced and non-contrast angiograms will be discussed in much more detail in a subsequent chapter.
Following the administration of gadolinium contrast, delayed enhancement imaging can be performed. Following the contrast-enhanced angiogram, single-shot balanced steady-state free precession (bSSFP) delayed enhancement imaging with a long inversion time (inversion time = 600 ms) is performed in the short and long axis to evaluate for thrombus. During the waiting time to perform delayed enhancement imaging with a null myocardium, velocity-encoded flow analysis can be performed at appropriate locations. Single-shot SSFP delayed enhancement imaging in the short and long axis is then performed with the inversion time set to null normal myocardium. If there is a high index of suspicion for coronary artery disease (CAD) or concern for CAD on the single-shot SSFP delayed enhancement imaging, then segmented gradient echo delayed enhancement images are obtained by taking a stack of images through the ventricles. Whole-heart coronary artery angiography can also be performed as indicated.
Morphology Imaging
Multi-slice morphology imaging is an essential component of the CMR evaluation of ACHD. Our institution typically performs morphology imaging following cine imaging; however, in circumstances where the diagnosis is unknown or scanning time may be limited, it is often advisable to begin the examination with morphology imaging. In patients with complex congenital heart disease, initial localization of the heart and associated structures within the chest is essential. Morphology imaging sequences allow for the single-shot acquisition of large amounts of anatomical information in a relatively short period of time without the need for breath holds. Multi-slice morphology imaging provides contiguous images through the chest which is essential for defining relationships of cardiac structures to one another. Multi-slice image sequences in the axial, sagittal, and coronal planes are generally recommended.
Morphology imaging can be performed with black blood or bright blood imaging (Fig. 3.2). Both modalities can be performed or the modality which produces the best image in that particular patient can be used. Black blood imaging consists of pulse sequences designed to null the blood pool to improve visualization of surrounding structures [6]. Conventional spin echo, fast (turbo) spin echo, and half-Fourier single-shot turbo spin echo (HASTE) are common black blood imaging sequences. All black blood imaging sequences are ECG gated. Fast spin echo is most commonly used to obtain high-resolution, single-slice images using a breath hold. HASTE imaging, on the other hand, is used to obtain multi-slice images of the chest in a relatively short period of time and without a breath hold. These images are acquired in a short amount of time; however, the resulting images have less spatial resolution and signal-to-noise ratio. Conversely, because of the short imaging time, respiratory and cardiac motion artifacts are minimized. Black blood imaging should be performed prior to the administration of gadolinium contrast because the shortened T1(and TI) that results from contrast impairs complete suppression of the blood signal [7]. These characteristics make HASTE imaging an ideal modality for a rapid survey of the chest and cardiovascular structures.
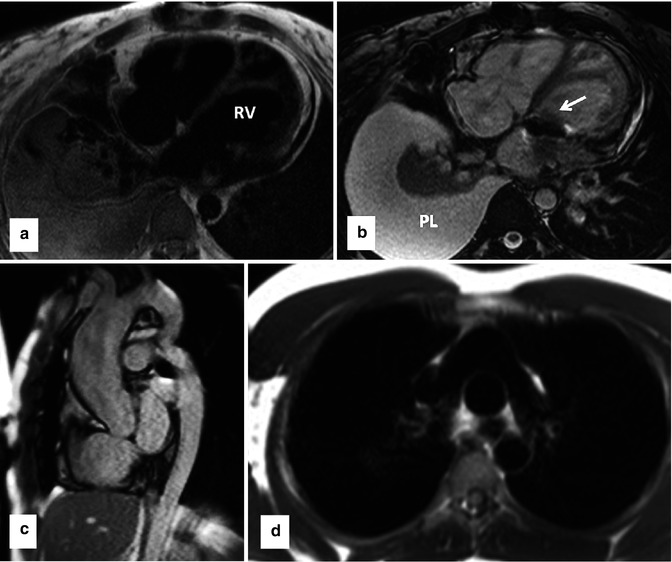
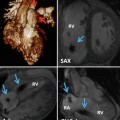
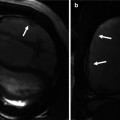
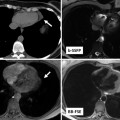
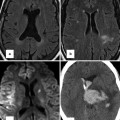
Fig. 3.2
Examples of clinical use of single-shot black blood (double IR-HASTE) and bright blood (bSSFP) sequences in standard body projections. These sequences can provide great amount of anatomical and pathological information in congenital heart malformation which can be used for better implementation of subsequent sequences for a comprehensive MR examination. (a) Axial black blood and (b) corresponding bright blood views in a patient with congenitally corrected transposition of the great arteries. Note the L-looped morphologic (systemic) right ventricle which is characterized by thickened moderator band. The two sequences are complementary and together can provide added information. In this example the prosthetic tricuspid valve (arrow) and left pleural effusion (PL) are easier to appreciate on bright blood image. (c) Bright blood sagittal image of a patient with coarctation of the aorta. (d) Black blood axial image of patient with complete transposition of great arteries following arterial switch operation. Typical appearance of main pulmonary artery anterior to the ascending aorta is shown. IR-HASTE inversion recovery half-Fourier single-shot turbo spin echo, bSSFP balanced steady-state free precession
Multi-slice bSSFP is usually used for “bright blood” imaging of cardiovascular structures. bSSFP morphology sequences use an imaging engine similar to cine MR SSFP that has been altered to produce a stack of images that progresses through space. This is different from cine MRI images that produce a moving image in a single plane [7]. bSSFP morphology sequences result in a bright blood pool. Artifacts with this sequence can be problematic in ACHD patients with flow or metal artifacts. Multi-slice bSSFP images can be performed before or after the administration of contrast. These images do not require a breath hold and allow for the rapid acquisition of images of the chest (non-ECG gated) in multiple planes.
When interpreting morphology images in ACHD, it is important to first define cardiac position and situs. Congenital heart disease patients with heterotaxy syndromes have abnormalities of organ positioning, including abnormal cardiac position and looping. Morphology imaging is essential in these patients to begin to describe the positions of organs within the chest and abdomen. Next, systemic and pulmonary venous anatomy should be defined. This allows for the identification of patients with systemic venous abnormalities such as a persistent left superior vena cava, interrupted inferior vena cava with azygous continuation, retroaortic innominate vein, and abnormal drainage of the right superior vena cava. Morphology imaging also allows for an evaluation of the patency of these vessels, which is important in a patient population which often requires procedures involving venous cannulation. Assessment of the pulmonary venous anatomy can allow for the identification of anomalous pulmonary venous return and an initial screening for pulmonary vein stenosis.
Morphology imaging also allows for an initial assessment of atrial, ventricular, and great artery morphology (Fig. 3.2a, b). Once this is defined, atrioventricular and ventriculo-arterial relationships can be described. The aorta can be evaluated for abnormalities of sidedness and branching. An initial assessment of the aorta can be performed for aneurysm, dissection, and coarctation (Fig. 3.2c). Many ACHD patients have main and/or branch pulmonary artery stenosis. Morphology imaging allows for the initial assessment of pulmonary artery anatomy (Fig. 3.2d).
Morphology imaging also allows for visualization of noncardiac findings within the chest. It is important to evaluate the mediastinum and lung fields for abnormalities such as pulmonary abnormalities, masses, and infiltrates. The thorax and spine can also be evaluated for bone and soft tissue abnormalities.
In summary, morphology image provides a large amount of anatomical information in multiple planes. This can be performed quickly and without a breath hold. This can allow for rapid diagnosis and it can be used for planning more detailed subsequent imaging during the CMR examination.
Cine Imaging/Functional Assessment
Cine MRI produces a movie of the beating heart in a single prescribed plane. The movie of the beating heart allows for the evaluation of valvular and ventricular function and shunt detection. Cine MRI images can also be obtained in contiguous slices to understand anatomical interrelationships and details. All of these components are critical to the evaluation of ACHD patients. As a result cine MRI is a workhorse of the CMR examination of ACHD patients.
The most common imaging engine used for Cine MRI is ECG-gated bSSFP. ECG-gated bSSFP produces an image at a defined slice position by acquiring data at particular frames of the cardiac cycle over several heartbeats [7]. This produces a cinematic movie of the beating heart at the slice position [6]. bSSFP imaging sequences are relatively short and can be performed with a breath hold to minimize respiratory motion artifacts. Parallel imaging with SENSE (sensitivity encoding) can result in even shorter imaging times [8]. bSSFP images have excellent contrast between the myocardium and blood pool which makes them ideal for ventricular functional assessment. The bSSFP blood-myocardium contrast is mainly secondary to a large difference in T2/T1 relaxation ratio. This ratio is generally high for blood pool and fat (bright) and low for the myocardium (relatively dark) [9].
Cine MRI can also be performed with a fast gradient-recalled echo (GRE) imaging engine. Prior to the emergence of bSSFP, GRE was the primary cine MRI sequence. ECG-gated GRE also produces a moving image by acquiring data at particular frames in the cardiac cycle. GRE relies on the inflow enhancement of blood (time-of-flight effect) to produce contrast between the blood pool and myocardium [6]. Compared to SSFP, GRE has inferior signal-to-noise ratio, less adaptability to parallel imaging resulting in longer acquisition times, and lower temporal resolution.
In ACHD patients, bSSFP is often the preferred cine MRI imaging modality. The high signal-to-noise ratio results in improved blood-endocardial interface and allows for more accurate volumetric measurements and functional assessment. The adaptability of parallel imaging leads to faster imaging and shorter breath holds. The superior temporal resolution leads to a smoother or “less jerky” reproduction of cardiac motion. On the other hand, bSSFP cine imaging is susceptible to dark band flow artifacts. This can often be overcome by frequency shifts or shim adjustment [6] (Fig. 3.3). ACHD patients can be especially susceptible to bSSFP-off resonance artifacts because of flow disturbances (i.e., post-Fontan operation). Sometimes these artifacts cannot be reduced by the usual troubleshooting. Alternatively in these cases, cine GRE can be used to overcome these limitations.
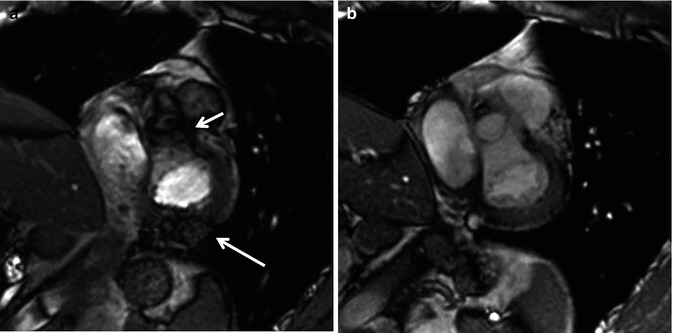
Fig. 3.3
Artifacts in balanced steady-state free precession (bSSFP). (a) Dark band and off-resonance artifacts (arrows) are corrected by frequency shift adjustment. Note clear view of the aortic valve and posterior wall of the left ventricle after corrections (b)
Anatomic Definition and Valvular Assessment
Cine MRI is very useful for anatomic definition in the ACHD patient. Cine MRI can be obtained in any prescribed plane which is helpful in imaging patients with challenging anatomy. The unlimited nature of imaging planes is one of the main advantages of cine MRI over echocardiography. Cine MR images can be obtained in contiguous slices or “stacks” of images. This is analogous to a “sweep” in an echocardiography plane. This allows for the improved understanding of the relationships of cardiac structures in patients with complex anatomy.
Short axis images of the heart can be obtained by planning a cross section of the heart perpendicular to the long axis of the left ventricle. A “stack” of these short axis images can be created from the cardiac apex through the base of the ventricles (Fig. 3.4). In ACHD patients, it may be prudent to continue this stack through the atria to look for atrial septal defects (ASD) or to assess atrial baffles in patients who have had atrial switch operations. Short axis images of the ventricles are used predominantly to assess for ventricular wall motion abnormalities and to quantify ventricular volumes, mass, and ventricular function (see section “Functional Assessment” below). Short axis cine images can also be used to define ventricular morphology, assess for ventricular or atrial septal defects, and evaluate atrioventricular valve morphology and function.
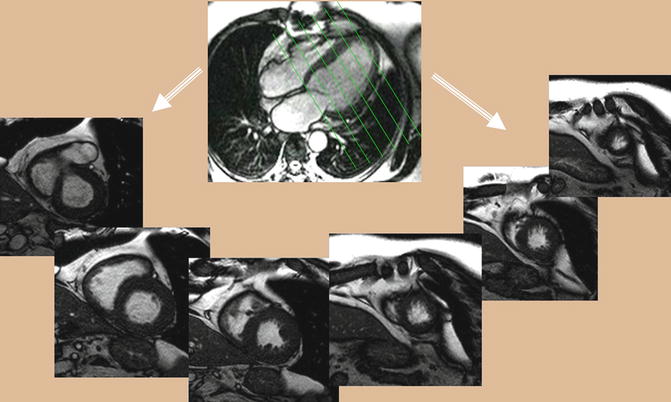
Fig. 3.4
Balanced steady-state free precession (bSSFP). Stack of short axis cine series will be obtained from long axis single-shot scanograms
Axial or axial oblique images of the heart can be obtained to produce a “four-chamber” view of the heart (Fig. 3.5). Most commonly, this image is obtained at the level of the atrioventricular valves. This allows for definition of cardiac sidedness, atrioventricular relationships, ventricular morphology and function, and atrioventricular valve morphology and function. A stack of these images can be obtained from the inferior surface of the heart superiorly through the great arteries. This facilitates understanding the interrelationships of cardiac structures. These axial or axial oblique images can also be used for volumetric measurements and ventricular functional assessment.
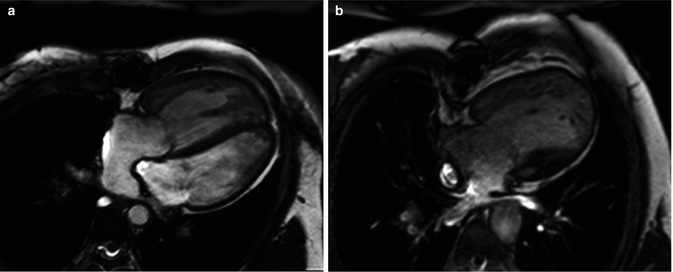
Fig. 3.5
Axial balanced steady-state free precession (bSSFP) provides a four-chamber view of the heart. (a) A patient with complete transposition of the great arteries following an atrial switch operation. (b) A patient with hypoplastic left heart syndrome following a Fontan operation
Long axis cine images of the ventricles can also be obtained. A “two-chamber long axis view” of the left ventricle and left atrium is planned off the previously obtained short axis and four-chamber views. This allows for visualization of the left ventricular and mitral valve function. A “three-chamber long axis view” of the left ventricle, left atrium, and left ventricular outflow tract is also obtained (Fig. 3.6). This image is planned from the short axis and “four-chamber” views. This is analogous to a parasternal long axis view in echocardiography and allows for visualization of left ventricular, mitral valve and aortic valve function. An image prescribed parallel to the left ventricular outflow tract (and the aortic root) in the three-chamber view produces an image of the left ventricular outflow tract viewed from an anterior perspective (coronal plane). Using this view and the three-chamber view, an “en face” image (through plane) of the aortic valve can be planned by prescribing double orthogonal planes of the aortic valve. This allows for visualization of aortic valve morphology and function and allows for planning future flow assessment (Fig. 3.7).
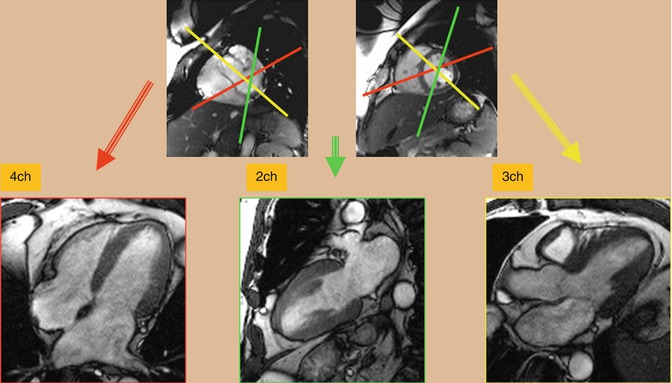
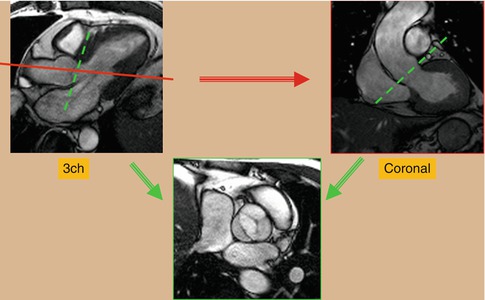
Fig. 3.6
Balanced steady-state free precession (bSSFP). Cardiac long axis views including four-chamber (4ch), two-chamber (2ch), and three-chamber (3ch) can be obtained from the stack of short axis images. Angles are shown in this image. Axial images can be obtained as a reference to facilitate plane adjustment
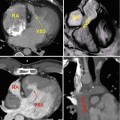
Fig. 3.7
Cine balanced steady-state free precession (bSSFP) technique for en face image of a bicuspid aortic valve. Using a three-chamber (3ch) reference image, an image is prescribed parallel to the left ventricular outflow tract (red line plane) to obtain a coronal view of the aortic root. From these two reference images, transaxial view of the aortic valve will be obtained (green planes)
Assessment of the right heart structures is particularly important in congenital heart disease patients who often have right ventricular pathology [10]. A long axis cine image of the right ventricle can be obtained by prescribing an imaging plane which bisects the tricuspid valve, right ventricle, and right ventricular outflow tract. This produces an image showing the inflow and outflow of the right ventricle. This allows visualization of the tricuspid valve, right ventricular outflow tract, pulmonary valve, and right ventricular morphology and function (Fig. 3.8). This image can then be used to prescribe and create a sagittal oblique image of the right ventricular outflow tract and pulmonary valve (Fig. 3.8). This is particularly important in patients with pulmonary stenosis or regurgitation, particularly in patients with a transannular patch repair of tetralogy of Fallot. The long axis view of the right ventricle and perpendicular sagittal oblique can then be used to prescribe a double orthogonal image of the pulmonary valve creating an en face image of the pulmonary valve. This can be used to evaluate pulmonary valve function and morphology and to plan for future flow assessment.
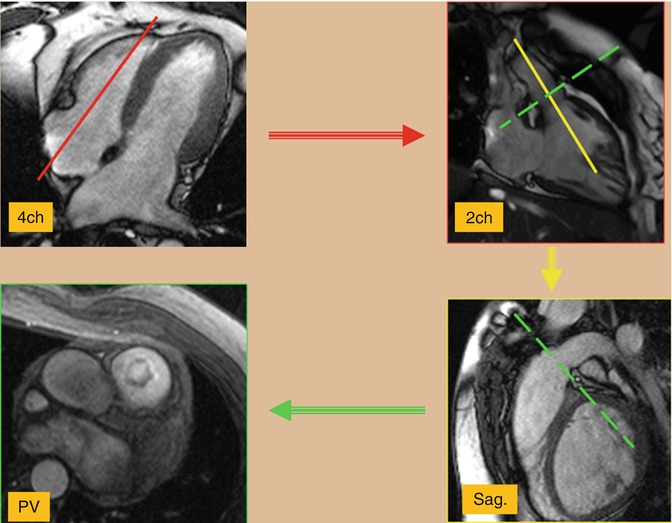
Fig. 3.8
Cine balanced steady-state free precession (bSSFP) technique for the right ventricle views. Using a four-chamber (4ch) view and two-chamber (2ch) view of the right ventricle will be obtained (red plane) which shows the inflow/outflow tracts of the right ventricle. This image can then be used to prescribe (yellow plane) and create a sagittal (sag.) oblique image of the right ventricular outflow tract and pulmonary valve. Using these two right ventricular views cross-sectional images of the pulmonary valve (PV) can easily be prescribed
The cine MR imaging described above constitutes the standard cine imaging used in adult congenital heart disease patients at our institution. Circumstances occasionally require the expanded use of cine images. Patients with atrioventricular valve disease such as Ebstein’s anomaly often require en face imaging of the atrioventricular valves. This provides anatomic definition and functional assessment. Many patients with congenital heart disease will often have branch pulmonary artery disease. In these patients, a stack of axial oblique images through the main and branch pulmonary arteries can be obtained to better identify branch pulmonary artery disease (Fig. 3.9a). Patients who have undergone atrial switch operations have complex atrial anatomy with the pulmonary venous return baffled to the right-sided mitral valve and the systemic venous return baffled to the left-sided tricuspid valve. It can be challenging to image the atrial anatomy in these patients. A stack of coronal oblique images through the atria can allow for evaluation of baffle leaks and obstruction. A sagittal oblique image visualizing the superior and inferior limbs of the systemic venous baffle can also be helpful. Sinus venosus atrial septal defects can be difficult to visualize by standard cine MRI. A bicaval or sagittal oblique view showing the relationship of the superior and inferior vena cava to the atrial septum can be useful in visualizing these defects [11] (Fig. 3.9b). Secundum atrial septal defects are much more common than sinus venosus atrial septal defects. Our institution performs imaging of secundum atrial septal defects by visualizing the atrial septal defect in a four-chamber view of the heart. A perpendicular image of the defect is then obtained producing a short axis view. Both of these images are then used to create an en face view of the atrial septal defect. This image can be used to visualize the size, location, and rims of the defect. A velocity-encoded through plane image of the atrial septal defect can be obtained by copying this image position and then used to quantify the left-to-right shunt (discussed further in velocity-encoded imaging) [12] (Fig. 3.10).
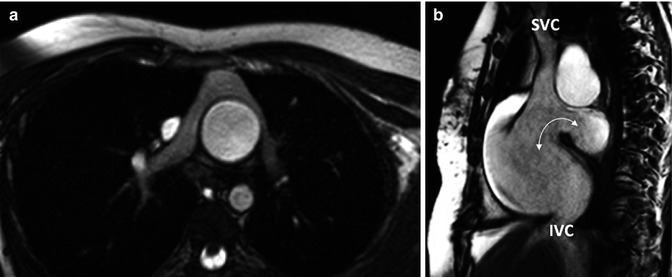
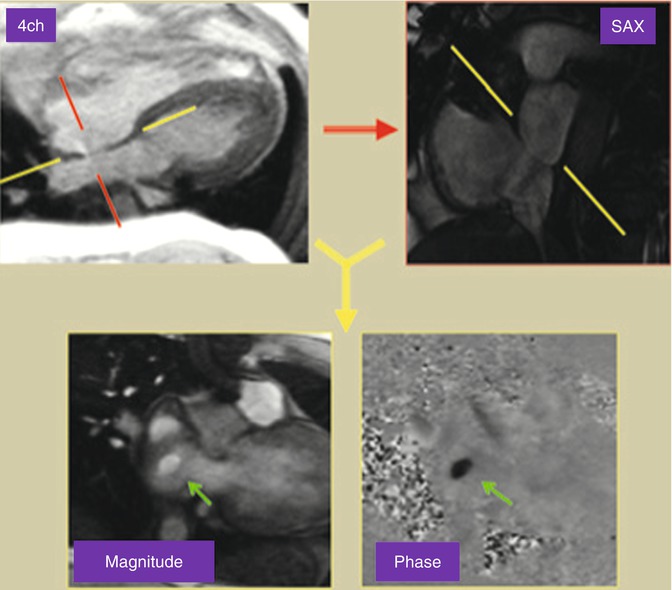
Fig. 3.9
Cine balanced steady-state free precession (bSSFP) technique. (a) Axial image of patient with complete transposition of great arteries following arterial switch operation. (b) bSSFP sagittal (bicaval) view of the atrial septum in a patient with a sinus venosus atrial septal defect (arrow). SVC superior vena cava, IVC inferior vena cava
Fig. 3.10
Phase-contrast MRI through plane image looking at the atrial septum from the right atrium in a patient with a secundum atrial septal defect
Ventricular Volumes/Functional Assessment
Assessing ventricular function is crucial to the CMR evaluation of the patient with ACHD. There are numerous reasons for ventricular dysfunction in these patients. Patients with single-ventricle hearts present one extreme of this spectrum. Those with two functional ventricles can have unique loading conditions, both from pressure and volume loading. ACHD patients have often undergone multiple interventions, placing them at risk for ventricular dysfunction. As these patients continue to age, their incidence of coronary artery disease increases, therefore elevating their risk of ventricular dysfunction.
Multiple measurements have been used to assess global ventricular systolic function. These assessments of systolic function, however, do not necessarily equate to measurements of contractility. They are dependent on ventricular loading conditions (preload and afterload) and often heart rate. One of the most widespread measurements of systolic ventricular function is ejection fraction. Volumetric measurements of the ventricle in diastole and systole are made and used to calculate the stroke volume and ejection fraction: ejection fraction % = (end-diastolic volume − end-systolic volume)/end-diastolic volume. In echocardiography, this is performed by obtaining double orthogonal views of the left ventricular long axis. Most commonly, the modified Simpson’s rule or method of disks is used to calculate ventricular volumes [13]. This requires an adequate imaging window with good contrast between the blood pool and myocardium. In ACHD patients who have often had many prior interventions, these conditions often do not exist. bSSFP cine MRI can often overcome these limitations. Echocardiography also provides limited echocardiographic windows of the right ventricle, making volumetric measurements difficult. bSSFP cine MRI can overcome this limitation by allowing for complete visualization of the right ventricular cavity, measurement of ventricular volumes, and the calculation of ejection fraction (Fig. 3.11).
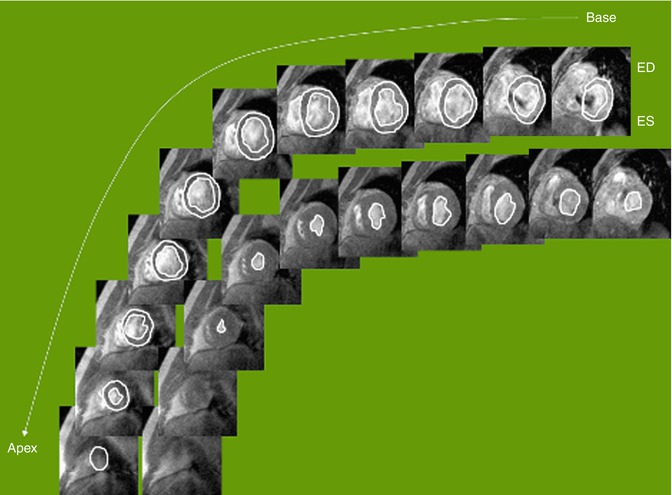
Fig. 3.11
Tracing of cine balanced steady-state free precession (bSSFP) images for ventricular function analysis. Cardiac MR allows for precise and reproducible quantification of wall thickness, ventricular mass, volumes (Courtesy of WJ Manning MD, Harvard Medical School). ED end diastole, ES end systole
Ventricular volumes and ejection fraction can be measured from a stack of cine MR images in a short axis or axial plane [8, 14]. The ventricular volumes are traced in end diastole and end systole through the entire ventricle (Fig. 3.11). One must be careful to outline only the ventricular cavity. At the level of the atrioventricular valve, the base of the ventricle can move in and out of the plane of the image as the heart moves with the cardiac cycle. This can result in portions of the atria being included in the most basal slice. Ventricular cavity is distinguished from atrial by the shortening of ventricular myocardium during systole. It is also imperative that one be consistent in the inclusion or exclusion of papillary muscles and trabeculations in diastolic and systolic measurements. The ventricular volumes are calculated from the product of the cross-sectional area of the cavity and the thickness of the image slice (prescribed by the user). Volumes are summated to calculate ventricular end-diastolic and end-systolic volumes. An ejection fraction is then calculated from the ventricular volumes. Myocardial mass can be measured by tracing the epicardial border in diastole, subtracting the endocardial volume, and multiplying by the specific gravity of myocardium, 1.05 g/mm3 [8]. Ventricular volumes and ejection fraction have been validated in animal models and patients [15–17]. Several studies have compared cine MRI measurements of ventricular volumes and ejection fraction to echocardiography and SPECT and have found that cine MRI has greater reproducibility and accuracy [18–20].
Ventricular volumes, mass, and ejection fraction can be compared to published normal values [21, 22]. One group of ACHD patients which have received a great deal of attention in this regard are patients with repaired tetralogy of Fallot [14, 23–27]. Historically, repair of tetralogy of Fallot has involved transannular patch relief of pulmonary stenosis [28–30]. This relieves right ventricular outflow tract obstruction, but results in pulmonary insufficiency. Pulmonary insufficiency can lead to right ventricular dilation and failure. Pulmonary valve replacement is the treatment of choice; however, the timing of replacement is controversial [31]. bSSFP cine MRI measurement of right ventricular volumes and ejection fraction has been proposed and used as one of many criteria in determining timing of pulmonary valve replacement [25, 26, 31].
Cine MRI can also be used for the evaluation of segmental wall motion abnormalities. This is analogous to the evaluation of the left ventricle in the parasternal short axis by echocardiography. The 17-segment model of the left ventricle can be applied and used to classify segmental wall motion abnormalities [32]. Wall motion is classified as normal, hypokinetic, dyskinetic, or akinetic. Areas of abnormal wall motion can be consistent with infarcted myocardium. Combining cine MRI with stress testing can allow for the identification of inducible ischemia (see section “Stress Imaging). ACHD patients can also have abnormal segmental wall motion as a result of patch material and injury from prior interventions, bundle branch block, and a pressure- or volume-loaded right ventricle.
Diastolic function describes the compliance of the ventricles. The gold standard for diastolic function is invasive measurement of ventricular end-diastolic pressure. Cardiac imaging modalities, including CMR, have used indirect data such as atrioventricular valve inflow and pulmonary vein flow patterns, atrial size, and myocardial velocities to assess diastolic function. Phase-contrast analysis of tricuspid and mitral valve inflow and pulmonary venous flow can be performed and used in the assessment of ventricular diastolic function [33, 34]. One group of particular interest in ACHD is repaired tetralogy of Fallot and restrictive right ventricular filling. This is diagnosed by the presence of end-diastolic forward flow on phase-contrast analysis of flow in the main pulmonary artery (Fig. 3.12). This finding has been correlated with worse pulmonary regurgitation and quality of life [35, 36]. Analysis of myocardial deformation by myocardial tagging or velocity vector imaging (VVI) can also be used to assess regional and global diastolic function. These modalities are discussed further below.
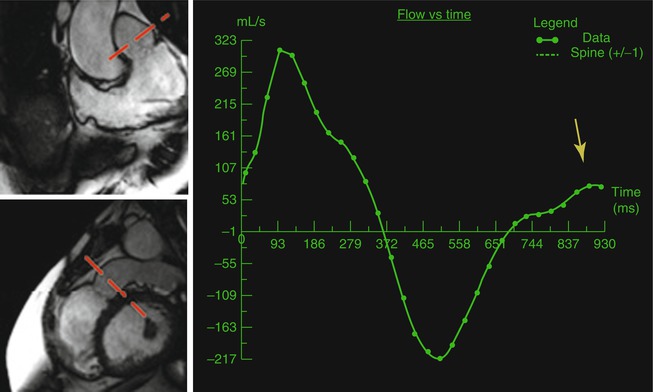
Fig. 3.12
Repaired tetralogy of Fallot and pulmonary regurgitation. Phase-contrast MRI flow diagram of the pulmonary valve is obtained using two orthogonal cine views of the right ventricle outflow tract (marked by red planes). There is end-diastolic forward flow (yellow arrow) which is indicative of restrictive right ventricular physiology
Myocardial Deformation
Within the field of cardiac imaging, there have been a number of recent developments in ventricular mechanics and myocardial deformation. Indices such as strain and strain rate can be evaluated. Myocardial strain is defined as a change in myocardial tissue length. Myocardial strain rate is defined as the rate of change in the length of myocardial tissue over time [37, 38]. These indices allow for assessment of global and regional myocardial function in longitudinal, circumferential, and radial directions. Echocardiographic modalities such as speckle tracking and VVI have been used for these measurements. CMR can also be used for assessment of myocardial deformation and offers some advantages over echocardiography. CMR is not limited by poor echocardiographic windows, and CMR allows for a superior blood pool to endocardium interface which aids in making these measurements.
Myocardial tagging is the gold standard for myocardial deformation evaluation by CMR. This involves superimposing lines or grids on the myocardium and following the subsequent deformation of these lines through the cardiac cycle on a cine MR image [39–43]. This is usually performed before the administration of contrast and requires a unique sequence which applies a prepulse to apply lines and grids [39]. Image acquisition is performed by using a cine MR imaging engine. Post-processing is then performed using an automated harmonic phase analysis (HARP) [39, 42, 43]. Myocardial tagging does have disadvantages in that it requires sequences which are not part of the standard CMR examination and the post-processing is time consuming.
More recently, VVI has emerged as an alternative modality for evaluating myocardial deformation by CMR. This modality involves loading a cine MRI image into vendor-specific software (TomTecTM) and tracing the epicardial and endocardial borders of the ventricle and following these locations throughout the cardiac cycle (Fig. 3.13). VVI then uses a hierarchical algorithm to generate values of regional and global myocardial performance [44]. An advantageous feature of VVI, when compared to myocardial tagging, is that VVI does not require specific sequences. Following the CMR examination, DICOM data of cine MR images can be loaded into the software and analysis performed. A disadvantage of CMR VVI is that the mid-myocardium is not evaluated.
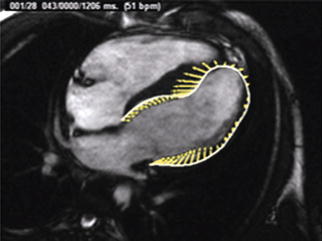
Fig. 3.13
VVI analysis of a cine balanced steady-state free precession (bSSFP) four-chambered view. Yellow lines shows ventricular deformity
The application of these myocardial tagging and VVI to ACHD patients is in its infancy. ACHD patients could benefit from this type of imaging because they frequently have regional myocardial dysfunction. Further study in this area could eventually lead to improved understanding of ventricular function in these patients.
Phase Contrast MRI
Hemodynamic assessment is an essential component of imaging patients with ACHD. These patients are at risk for valvular regurgitation and stenosis, arterial and venous stenosis, and intracardiac and extracardiac shunting. One of the strengths of echocardiography has been the use of Doppler technology in this role. CMR can provide excellent image quality with cine and morphology imaging, but, to match the comprehensive utility of echocardiography, a modality for hemodynamic assessment is essential. Phase-contrast CMR (PC-CMR) fills this role [45].
PC-CMR is based on the principle that moving protons, as compared to stationary protons, will experience a phase shift when exposed to a gradient in the direction of flow [7]. A gradient echo imaging engine is used to produce an image in which signal intensity is proportional to flow velocity. The flow in the direction of the applied gradient is white and the flow in the opposite direction is black (Fig. 3.10). Stationary tissue appears null or gray. A retrospective ECG-gated GRE cine imaging engine is used to apply phase contrast throughout the cardiac cycle. Velocity can then be graphed as a function of time [46]. Most commonly, PC-CMR is performed in the through plane, or perpendicular to the direction of flow (Fig. 3.12). The integrated product of the velocities and cross-sectional area of the flow column determines the flow rate. Integration of the area under the curve allows for measurement of forward and reverse volume [46]. In plane phase contrast imaging, which is parallel to the direction of the gradient field can also be used. This is not ideal for quantification of flow but can allow for visualization of the location of maximal flow acceleration (Fig. 3.14).
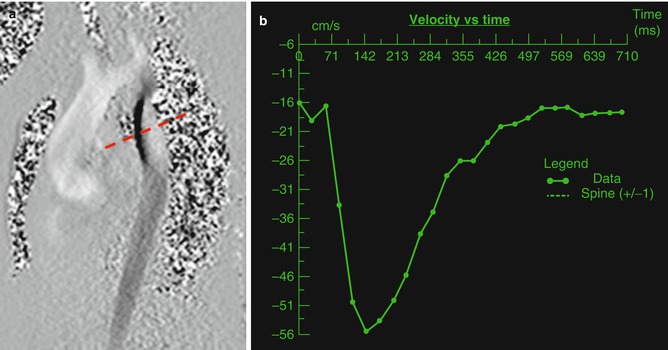
Fig. 3.14
(a) In plane phase image of the aortic arch in a patient with coarctation of the aorta. Note the dephasing (dashed red line) in the area of the coarctation of the aorta. (b) Time velocity diagram of a through plane image of the descending aorta distal to the area of stenosis (dark line) showing increased velocity
PC-CMR is applied in the through plane by first setting the imaging plane perpendicular to the vessel or valve to be assessed. A cine MRI image is first obtained perpendicular to the area of interest by using double orthogonal views (Fig. 3.13). The location of the cine image is copied as the image location to be used for phase-contrast CMR. The velocity encoding threshold (VENC) is then set. If the velocity of flow in the image exceeds the VENC, then aliasing of flow will occur, and the protons which exceeded the VENC will then be assigned a negative signal, thereby compromising the accuracy of the measurement [47]. It is also essential to set the VENC close or slightly above to the true maximal velocity. The greater the VENC exceeds the true maximal velocity of the image, the less accurate the measurement [6]. Determining the correct VENC can be time consuming and difficult for a breath-holding patient. When the maximal velocity is unknown, the VENC will be set at what is thought to be an appropriate level and the sequence will be run without a breath hold. If aliasing occurs, sequences will be run without a breath hold until the correct VENC is determined. A breath-hold sequence with the appropriate VENC is then performed and this is used for measurements. Alternatively, a sequence with multiple averages can be used in free-breathing patients. The finished sequence is then evaluated at a separate workstation using a vendor-specific clinical work station.
Shunting
Many ACHD patients, both repaired and unrepaired, have intracardiac or extracardiac shunting. This shunting can be left to right, right to left, or mixed. When discussing cardiac shunting, the relationship of pulmonary and systemic flow is usually expressed as a Qp/Qs (Qp = pulmonary flow, Qs = systemic flow). When Qp/Qs exceeds 1, pulmonary flow exceeds systemic flow and systemic-to-pulmonary or left-to-right shunting exists. On the contrary when Qp/Qs is less than 1, pulmonary flow is less than systemic flow and pulmonary-to-systemic flow or right-to-left shunting exists. Left-to-right shunting results in normal oxygen content, symptoms of pulmonary overcirculation, and, ultimately, Eisenmenger’s physiology. Right-to-left shunting results in diminished oxygen content.
In clinical practice, the gold standard for the measurement of Qp/Qs and intracardiac shunting has been the Fick equation determined by invasive oximetry. Qp/Qs can also be determined by echocardiography; however, this method is dependent on good echocardiographic windows [13]. Echocardiographic determination of Qp/Qs does not directly measure flow but assumes that the flow is equal throughout the flow column. Echocardiography also is limited in that the measurement of the diameter of the vessel is obtained at a different time than the Doppler evaluation of flow velocity [7]. PC-CMR can overcome these limitations in that CMR is not limited by echocardiographic windows, flow across a vessel is directly measured, and the cross-sectional area and velocity measurement are obtained simultaneously [7]. PC-CMR determination of Qp/Qs has compared well with Doppler echocardiography and volumetric assessment of right and left ventricular stroke volume [48–51]. PC-CMR has also been found to agree with the Fick equation in patients with left-to-right shunt who underwent simultaneous PC-CMR and cardiac catheterization [52–56].
With PC-CMR, Qp is usually measured at the main pulmonary artery or pulmonary valve. This is especially useful in the setting of an atrial septal defect, ventricular septal defect, or partial anomalous pulmonary venous return. In the setting of additional sources of pulmonary blood flow such as a patent ductus arteriosus, aorticopulmonary collaterals, and surgical aorticopulmonary shunt, alternative strategies are required. Flow in the patent ductus arteriosus or surgical aorticopulmonary shunt can be measured directly and added to the main pulmonary artery flow to calculate Qp. Flow in both branch pulmonary arteries distal to the patent ductus arteriosus or surgical shunt can be measured and added to calculate Qp (assuming that the measurement is made proximal to any branch points of the right and left pulmonary arteries) [56]. Flow in all pulmonary veins can also be measured and added to measure Qp.
Qs is usually measured at the ascending aorta or aortic valve. Qs can also be obtained by measuring flow in the superior vena cava and inferior vena cava and adding the two. In patients with patent ductus arteriosus, aorticopulmonary surgical shunts, or aorticopulmonary collaterals, Qs can be obtained by performing PC-MRI in the descending aorta distal to the area of left-to-right shunting and in the superior vena cava before the entrance of the azygous and adding the two [57, 58].
There has been increased interest in the assessment of left-to-right shunting from aorticopulmonary collaterals in the setting of single-ventricle physiology and tetralogy of Fallot [57, 59–61]. Whitehead et al. and Glatz et al. have quantified aorticopulmonary flow in single-ventricle patients with one of two methods: in one method, aorticopulmonary flow = aorta − (SVC + IVC) and in the other method aorticopulmonary flow = (LPV − LPA) + (RPV − RPA) [57, 59, 60]. Tetralogy of Fallot patients with pulmonary atresia and aorticopulmonary collaterals also present a unique approach to PC-MRI. The clinical course and surgical timing are often determined by the amount and distribution of pulmonary blood flow. Historically, many of the most complex patients with this disease were not offered surgical repair, and some of these patients have survived to adulthood with profound cyanosis [62]. Grosse-Wortmann et al. described a method of quantifying pulmonary blood flow with PC-CMR in these patients which would predict postoperative right ventricular systolic pressure. They determined Qs by measuring flow in the descending aorta distal to all collateral vessels and added this to the SVC flow. They calculated Qp by direct measurement or by subtracting descending aortic flow from ascending aortic flow [61].
There are also multiple methods for calculating Qp/Qs in patients with atrial septal defects [12, 54, 63]. A widely used method is to measure pulmonary blood flow at the level of the pulmonary valve or main pulmonary artery and Qs at the aortic valve or ascending aorta. Our institution has described an alternative method which had better correlation with Qp/Qs calculated by the Fisk equation. This method involves obtaining an en face view of the atrial septal defect by planning from double orthogonal views. A PC-CMR through plane image is performed in this position. This allows for visualization of the size of the defect, additional defects, and determination of defect rims (Fig. 3.10). Quantification of flow through the defect can then be performed. Qp is calculated by adding QASD to Qs. Qs is measured in the ascending aorta [12].
Regurgitation
Valvular dysfunction and regurgitation is a frequent finding in ACHD. Some common diagnoses in which regurgitation can be seen are bicuspid aortic valve, Ebstein’s anomaly, and repaired tetralogy of Fallot. One of the more widespread uses of CMR in the evaluation of ACHD has been the assessment of pulmonary valve regurgitation and right ventricular dilation in repaired tetralogy of Fallot [64, 65]. PC-CMR, in addition to cine MRI, is essential to the assessment of the severity of regurgitation. In plane PC-MRI can be used to visualize regurgitant jets. This can allow for subjective assessment of regurgitation severity and assist with determination of the mechanism of regurgitation. Semilunar valve regurgitation can be assessed by through plane PC-CMR at the level of the valve or great artery proximal to the first branch. Forward and reverse volumes are measured. A regurgitant fraction is then calculated by using the equation: Regurgitant fraction = reverse volume/total forward volume. When performing PC-CMR at the level of the valve, inaccuracies can occur when the plane of the regurgitant jet is eccentric and at an angle to the imaging plane. Because of this our institution frequently performs PC-CMR within the associated great artery: ascending aorta proximal to the innominate artery for the aortic valve and main pulmonary artery for the pulmonary valve (Fig. 3.12). When assessing aortic insufficiency, it can be beneficial to perform PC-CMR in the descending aorta. The presence of flow reversal can be used to help assess severity.
Quantification of atrioventricular valve regurgitation is also an important component of the PC-CMR assessment of the ACHD patient. Atrioventricular valve regurgitation can be measured directly by aligning a through plane PC-CMR image at the level of the plane of the valve. The forward and reverse volume can be measured and regurgitant fraction calculated: Regurgitant fraction = reverse volume/forward volume. This method can be problematic as it can often be difficult to align the PC-CMR with the plane of the valve and regurgitant jet. In the absence of semilunar valve regurgitation, atrioventricular valve regurgitant fraction can be calculated by dividing the reverse volume (directly measured) by the ventricular stroke volume. This can also be done by measuring the forward volume in the associated semilunar valve or great artery and the ventricular stroke volume. Regurgitant fraction of the atrioventricular valve can then be calculated by using the following equation: Regurgitant fraction = (ventricular stroke volume − forward volume of semilunar valve)/ventricular stroke volume.
Stenosis
Valvular stenosis is a frequent finding in ACHD. Pulmonary stenosis, tetralogy of Fallot, bicuspid aortic valve, and repaired atrioventricular septal defects are common diagnosis with valvular stenosis. PC-CMR semilunar valve assessment is accomplished by performing a through plane image at the level of the valve leaflet tips. To ensure accuracy, it is imperative to set the VENC at the minimum value above which aliasing occurs. On the phase-contrasted image, the semilunar valve outflow should be traced to include all of the pixels in the outflow column, but no others. The peak velocity of the flow can then be measured. The modified Bernoulli equation, pressure gradient = 4v 2, can then be applied to calculate a gradient across the valve. Previous studies have revealed correlation with spectral Doppler echocardiography and cardiac catheterization [66, 67].
Evaluation of atrioventricular valve stenosis can also be performed by PC-CMR [68]. Mitral and tricuspid valve stenoses are frequent findings in a number of ACHD constellations. PC-MRI of the atrioventricular valve is accomplished with a PC-CMR image at the level of the atrioventricular valve leaflet tips [68]. The VENC should again be set properly to the minimum value above which no aliasing occurs. The inflow of the phase-contrast image can be traced, the peak velocity measured, and a mean velocity calculated from the area under the curve. Atrioventricular valve stenosis is commonly reported as a mean gradient, and the modified Bernoulli equation can be used to calculate this gradient [13].
Evaluation of arterial stenosis is critical in patients with branch pulmonary artery stenosis and coarctation of the aorta. ACHD patients, especially those with tetralogy of Fallot and transposition of the great arteries following arterial switch, frequently have branch pulmonary artery stenosis. Branch pulmonary artery stenosis can be measured directly with PC-CMR. A PC-MRI image perpendicular to the long axis of the vessel can be done at the level of the stenosis and a peak velocity and gradient calculated. Flow evaluation of the proximal branch pulmonary arteries can be performed. The flow and forward volume into each branch pulmonary artery can be measured. These values can be compared to each other and to the main pulmonary artery. The percentage of flow to each lung can be calculated. This is analogous to a nuclear lung perfusion scan and studies have confirmed that this modality correlates well with nuclear lung perfusion measurements [69, 70]. Patients with coarctation of the aorta, both repaired and unrepaired, require PC-CMR appraisal of stenosis. It is often advisable to perform in plane PC-CMR in a plane visualizing the aortic arch in an orthogonal sagittal plane with a relatively low VENC. This can allow for visualization of the area of most severe stenosis as identified by the area of maximal aliasing (Fig. 3.14a). A through plane image can be planned at this location and a peak velocity calculated [71]. Through plane PC-CMR can also be performed in the descending aorta. A patient with more severe stenosis can have a flow pattern with diminished amplitude and antegrade flow in diastole (Fig. 3.14b). Collateral volume can be quantified by measuring forward volume in the descending aorta below the level of obstruction and collaterals and proximal to the area of the stenosis. The proximal value is then subtracted from the distal value and the collateral volume calculated [72–76].
Venous stenosis can also be assessed with PC-CMR. Stenosis of the superior vena cava (SVC) can be a complication of surgical repair of superior sinus venosus atrial septal defects. A PC-CMR perpendicular to the long axis of the SVC can allow for measuring the peak and mean velocity across the vessel. Stenosis of the superior systemic limb of the atrial baffle in a transposition of the great arteries patient can also occur and can be evaluated in this manner [77]. Pulmonary venous stenosis can also be a complication of ACHD. Double orthogonal PC-CMR at the orifice of the pulmonary veins can allow for detection of stenosis [78, 79]. This imaging plane is often best planned by using an angiogram. The area under the flow curve can be integrated and mean velocity and gradient calculated.
Related posts:
Stay updated, free articles. Join our Telegram channel

Full access? Get Clinical Tree


