Fig. 6.1
Representation of sound waves. Amplitude is the maximum extent of an acoustic oscillation, measured from a position of equilibrium. Wavelength (λ) is the distance between successive sound wave crests and represents one sound wave cycle. Frequency is the number of cycles per 1 s (in this example, 2) and is measured in Hertz (Hz). Propagation velocity (not depicted above) is the speed at which an acoustic signal travels through a medium
US waves interact with internal tissue structures via reflection, refraction, and attenuation. Reflection consists of specular and scattered varieties. Specular reflection occurs when US waves interact with anatomic structures with a lateral dimension larger than the wavelength of US, such as tissue interfaces or valve leaflets. The US reflects off of these tissue boundaries and returns to the transducer. The amount of sound wave that returns to the transducer (i.e., the signal strength) depends on the angle of reflection between the tissue interface and the transducer. The optimal angle with the maximal amount of reflected US occurs when the tissue interface is perpendicular to the transducer. When the tissue interface is parallel in alignment to the transducer, no US wave returns to the transducer and signal dropout occurs. Scattered reflection results in the characteristic speckle pattern of tissues seen on US images. These speckles are the result of constructive and destructive US interference backscattered from Rayleigh scatterers, which are anatomic structures with a lateral dimension smaller than the wavelength of US. Signals produced by scattered echoes are considerably lower in comparison to specular echoes, because the overall percentage of energy reflected back to the US transducer is much lower due to their considerably smaller size.
Refraction occurs when US waves travel from one tissue to another tissue with different acoustic impedances. Acoustic impedance (Z) is an inherent characteristic of tissues and depends on the density of the tissue (p) and the propagation velocity of US within that tissue (c):Z = pc
This difference in acoustic impedances encountered by the US wave as it crosses from one tissue interface to another causes the beam to deviate at an angle away from its original straight line path. As impedance increases, more US will be reflected, and this deviation can lead to “double image” artifacts.
Attenuation occurs when signal strength is lost, either due to reflection, scattering, or absorption. Absorption is the conversion of US to heat, which is consequently absorbed by the body tissues. Air is a significant source of signal attenuation given its high acoustic impedance. Any air between the transducer and cardiac structures results in significant signal attenuation. For this reason, a water-soluble gel is used to form an airless contact between the transducer and the patient’s skin, greatly facilitating the transfer of sound waves into and out of the body. The lungs are also filled with air, and careful manual positioning of the transducer is required to obtain adequate imaging of cardiac structures while avoiding the lung fields, especially in patients with hyperinflated lung conditions such as COPD, mechanically assisted ventilation, and pneumothorax.
Piezoelectricity
The piezoelectric crystal within the US transducer acts as both a signal transmitter and signal receiver. Most current commercial transducers use ceramics for the piezoelectric material. When an alternating electric current is applied to the piezoelectric crystal, it rapidly vibrates, emitting a high-frequency US as it expands and contracts. The transducer emits a short burst of US, lasting 1–6 μs, called the pulse length. The transducer then enters into a receiver mode referred to as “dead time,” waiting for reflected US waves to return. The combined duration of a single pulse length time and dead time is known as the pulse repetition frequency. When a reflected US wave returns to the crystal, it induces the crystalline generation of an electric current that is detected. This transmit-receive cycle is repeated temporally and spatially, and the differences in time delay of the reflected sound waves received by the transducer are used to generate the US image. To create a 2-dimensional echocardiogram sector image, the transducer must emit and receive at repetition rates of 3,000–5,000 times/s.
Ultrasound Imaging
The simplest type of US imaging is based on the alternating pulsed transmission and reception along a single US beam. This is used in M-mode imaging, when the image obtained along a single US beam is recorded over time in what is sometimes referred to as the “ice pick” view (Fig. 6.2a). A phased array sector scanner must be used to obtain the familiar 2-dimensional (2D) echo images. In phased array scanners, numerous small piezoelectric crystals are interconnected electrically and arranged in an array. Each crystal is connected to an electrode, which enables each crystal to transmit and receive US signals. The electrical excitation of each crystal within the array is timed such that excitation for every crystal does not occur simultaneously but rather in a timed sequential excitation pattern, allowing the US beams to be “steered” through a sector arc to generate a 2D image (Fig. 6.2b).
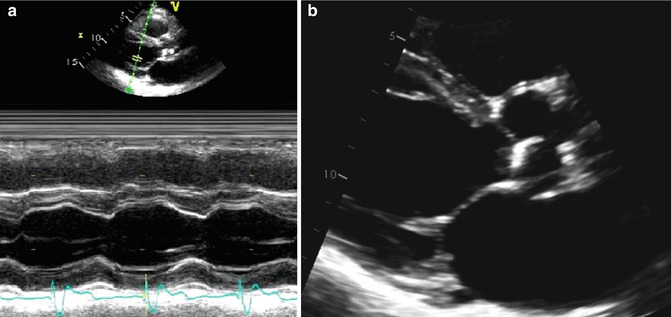
Fig. 6.2
M-mode and 2-dimensional echo imaging. (a) Demonstrates an M-mode (motion mode) tracing of the left ventricle. M-mode is an ultrasound representation of the depth of echo-producing interfaces in a single sampling line, displayed as a function of time. (b) Demonstrates a 2-dimensional ultrasound image of the same left ventricle through combining of images acquired from multiple ultrasound beams in a phased array
During the transmission of US waves, the frequency of the original wave may be altered by nonlinear tissue interactions. These interactions result in the generation of new frequencies that were not present in the original transmitted US beam. These new frequencies are integer multiples of the original signal and are known as harmonic frequencies. If the original sound wave has a frequency of f, the harmonic frequencies are 2f, 3f, etc. The original US beam undergoes significant attenuation as it propagates through the patient’s tissue but generates new harmonic waves with higher-frequency oscillations than the original US beam. These higher-frequency waves have higher spatial resolution and increase in strength as the US wave penetrates the body. Harmonic frequencies are optimal at depths of 4–8 cm which is ideal for imaging cardiac structures. Additionally, strong US waves create strong harmonic frequencies, while weak US waves produce almost no harmonic frequencies. In tissue harmonic imaging, the reflected signal from the original US beam is suppressed, and the harmonic frequencies are used to construct the image. The development of tissue harmonic imaging has been instrumental in significantly improving echo image quality, particularly in the visual assessment of endocardial borders.
Doppler Echocardiography
Doppler echo is the detection of signals from anatomic structures with a lateral dimension smaller than the wavelength of US. Doppler echo is integral in the echocardiographic measurement of blood velocities, tissue velocities, and in newer techniques measuring ventricular torsion and strains. For a stationary anatomic structure, any US waves that strike the anatomic structure and reflect back to the transducer will have the same frequency as the originally transmitted US beam. If the anatomic structure is in motion in a direction away from the transducer, the frequency of the reflected beams will be lower than the originally transmitted frequency. If the anatomic structure is moving toward the transducer, the frequency of the reflected beams will be faster than the originally transmitted signal frequency. This is the same sound wave phenomenon observed when a train moving toward an observer has a high-pitched whistle, which then changes to a low-pitched whistle as the train travels away from the observer. The difference in frequencies between the originally transmitted frequency and the reflected, returning frequency is known as the Doppler shift. In echo, it is possible to calculate the velocity of blood as it travels through cardiac structures by detecting the Doppler shift from the scattered echo’s reflected from the thousands of blood cells located within the US beam. The velocity of the moving blood cells can be calculated using the equation:V = c(Fs – Fτ)/ (2Fτ ‑cosθ)
F τ is the transmitted frequency, F s is the frequency of the signal returning from the blood, c is the velocity of sound waves in blood (1,540 m/s), and cosθ is the intercept angle between the US beam and the direction of blood flow. In cardiac applications, care must be taken to align the transducer parallel to the direction of blood flow so that cosθ = 1. Although small angle deviations typically result in minor underestimations of blood velocity, an angle deviation of 60° between the US beam and the direction of blood flow can result in a 50 % underestimation of blood velocity.
There are three types of Doppler interrogations performed during a typical echocardiogram study: continuous wave (CW) Doppler, pulse wave (PW) Doppler, and color Doppler (Fig. 6.3). In CW Doppler, two crystals are used. One crystal is set to continuously transmit an US signal, and the other crystal is set to continuously receive return signals. Along the single US beam, every Doppler shift is recorded simultaneously and displayed in graph format as velocity versus time. The advantage of this method is that high velocities can be measured accurately due to the continuous US signal transmission and data reception. In contrast to CW Doppler which samples all velocities along the beam length, PW Doppler allows for the measurement of velocity at a prespecified sample depth. A pulse of US frequency is transmitted to the sample site, and after a specific time period, the receiver detects the reflected signal. The specified time interval is determined by the time it takes the US to reach the sample depth and return and is called the pulse repetition frequency. Color flow imaging is conceptually analogous to PW Doppler, but instead of a single sample point, numerous sample points along multiple sampling lines are obtained. By combining data points among the different sample sites, mean blood flow velocities are calculated and a 2D image of blood flow is constructed. By convention, flow toward the transducer is depicted in red, and flow away from the transducer is depicted in blue. A third color, typically yellow or green, may be used to indicate “variance” or excessive variation in velocity within the sample points to represent nonlaminar or high-velocity blood flow.
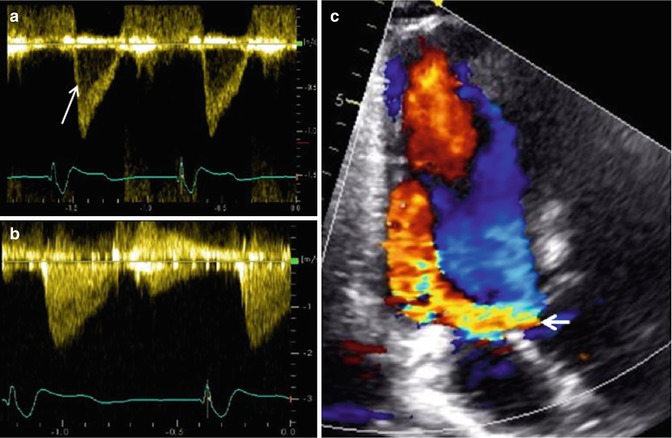
Fig. 6.3
Examples of Doppler echo imaging. (a) Shows pulse wave Doppler of a sample site within the left ventricular outflow tract in a normal heart, demonstrating a narrow band of laminar spectral output (arrow). (b) Shows the continuous wave Doppler of the same left ventricular outflow tract demonstrating all of the various velocities encountered by the ultrasound beam, including the narrow band noted in the pulse wave Doppler example in (a). (c) Shows color Doppler over the left ventricular outflow tract demonstrating a large, diastolic, regurgitant jet (arrow) in a patient with severe aortic regurgitation
Echo Application in Congenital Heart Disease
The incorporation of echo into the evaluation of CHD has changed the course of management for patients born with heart defects [3–5]. Prior to widespread use of 2D echo, diagnosis and follow-up evaluation of CHD was done primarily by history, physical exam, chest X-ray, electrocardiogram, and cardiac catheterization. There is still no replacement for a detailed history and physical exam, but a detailed anatomic and hemodynamic evaluation is necessary upon initial diagnosis to properly plan for both initial intervention and subsequent follow-up care. Cardiac catheterization historically had been the only diagnostic tool to acquire anatomic, functional, and hemodynamic data to guide management. While the information derived from catheterization was incredibly valuable, its invasive nature and lack of portability remained its biggest disadvantages [6, 7]. Technological advances have allowed the incorporation of US imaging as a noninvasive method of evaluating patients with CHD. The high temporal and spatial resolution of echo enables it to provide accurate and comprehensive anatomic and functional diagnostic assessments that, in turn, guide the management and follow-up of patients. For a large proportion of patients, a high-quality echo study provides sufficient information to recommend specific surgical or percutaneous therapies without the need for more invasive diagnostics [8, 9]. Today, it is rare for patients with even the most complex cardiac defects to require catheterization prior to initial surgery.
2-Dimensional Echocardiographic Imaging in Congenital Heart Disease
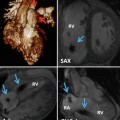
Cardiac pathological studies have resulted in the development of a structured framework for describing and communicating CHD lesions. The heart is a complex 4-dimensional (4D) structure that moves in both time and space. Since most imaging modalities are displayed on a 2D screen, the 3D and 4D reconstruction must occur in the human mind to fully appreciate the pathophysiology. In fact, the development and application of 3D echo in CHD is largely founded on how sonographers and echocardiographers are already mentally interpreting image slices and formulating these 3D and 4D images. In order to establish a clear and consistent way of describing the myriad of CHD lesions and the immense intralesion variability, pathologists in the past developed the segmental approach for the description of CHD [10, 11]. The Van Praagh’s developed the three-level cardiac segmentation approach, which includes:
1.
Visceroatrial situs
2.
Ventricular looping
3.
Great artery relationship
Each segment is designated by a letter, which delineates their position in space (Fig. 6.4). The segmental approach provides a uniform method of describing basic cardiac anatomy. Once segmentation has been established, additional attention is then paid to describing the individual connections between respective segments and describing the specific features within each segment (i.e., chamber size, valve architecture, great vessel caliber, and course). The end result is a consistent way of describing all aspects of the cardiac anatomy, providing a way for individuals to piece together any defect even before performing or reviewing any imaging study.
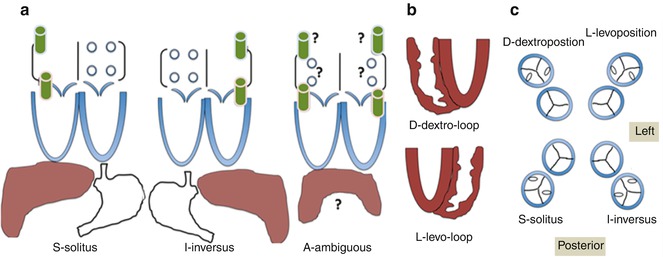
Fig. 6.4
Schematic illustration of the segmental approach to describing cardiac anatomy. Analysis begins with evaluation of visceroatrial situs (a) with consideration of the anatomic positioning of the abdominal viscera (liver, spleen, stomach), inferior systemic venous drainage (i.e., IVC or azygous or hemiazygous continuation), and atrial anatomy (including which chambers receive systemic and pulmonary venous drainage). Segmental description continues with delineation of ventricular looping (b; D- vs. L-looping) and ends with description of the anatomic relationship of the great arteries to each other (c). Each segment is labeled with a letter designation as listed in each panel
Given the superior temporal and spatial resolution of echo, the 2D “sweep” of the anatomy begins the process of combining anatomic evaluation and connection. The use of short clips in single planes to evaluate a single valve or structure is of limited utility in the CHD population given the lack of ability to create a 3D mental picture of the heart. The incorporation of “sweeps” to the evaluation of cardiac anatomy applies to standard transthoracic and transesophageal approaches in CHD echo.
Echo “sweeps” for the imaging of CHD involve pivoting the transducer in standard views to obtain a series of imaging slices that provide left-to-right, superior-to-inferior, and superficial-to-deep contour. The combination of sweeps in all standard views can then be used to generate mental or computer-processed 3D depictions of cardiac structures. Sonographers utilize typical subcostal, parasternal, apical, and suprasternal notch windows to acquire these sweeps. Occasionally, alternate windows and modified views need to be utilized, particularly in cases of unusual cardiac positioning, dextrocardia, or anomalous, aberrant, or hypoplastic vascular structures.
In TEE, sweeps are obtained by rotating the transducer along its axis, raising or lowering the probe tip to various levels within the upper gastrointestinal tract, and flexing the transducer tip along its fulcrum, thereby acquiring image slices at a certain level and orientation of the transducer within the chest (Fig. 6.5). Similar to transthoracic imaging, these slices are then integrated mentally or through image processing to yield 3D depictions of structures.
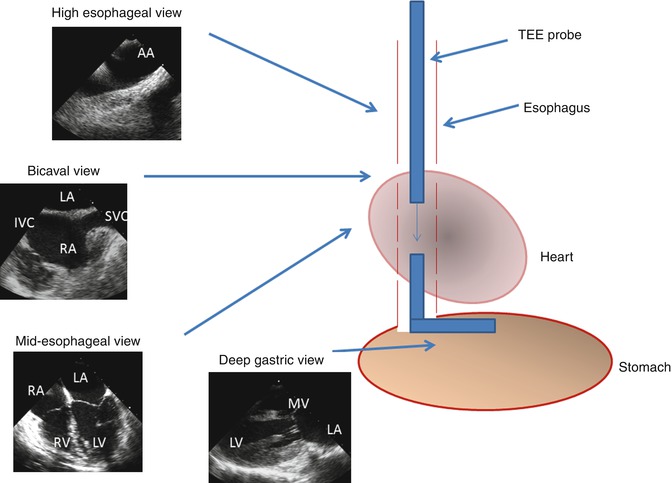
Fig. 6.5
Schematic of transesophageal echo (TEE) imaging. During TEE imaging, the imaging probe is placed down the esophagus and oriented to obtain 2- and 3-dimensional images along with color and spectral Doppler tracings. The transducer tip can be rotated to obtain orthogonal views from a single location within the esophagus. The probe is also advanced or withdrawn to acquire images at varying depths within the esophagus. The probe tip can also be flexed and placed into the stomach for deep gastric imaging. AA aortic arch, SVC superior vena cava, IVC inferior vena cava, LA left atrium, RA right atrium, LV left ventricle, RV right ventricle, MV mitral valve
Transthoracic Echocardiography in Congenital Heart Disease
Transthoracic echo (TTE) remains the primary diagnostic tool complementing history and physical examination in the evaluation of CHD, owing largely to its portability and high spatial and temporal resolution. Infant and child heart disease is often easily imaged with few limitations. However, as the patient grows, so do the soft tissues and lungs, which will limit resolution of imaging and the ability to find adequate echo windows. US does not travel through air, so any lung that overlies cardiovascular structures will obscure the image, rendering the structure indecipherable. Furthermore, disorganized scar tissue, for example, following cardiac surgery, and bone will obscure imaging and limit the reader’s ability to accurately comment on the cardiovascular structural details.
As with standard adult echo, CHD echo incorporates views from the parasternal, apical, and suprasternal notch locations on the chest. Orthogonal views are obtained by rotating the transducer 90°. In addition, CHD echo incorporates a greater emphasis on the subcostal or subxyphoid views obtained by placing the transducer just below the xyphoid process, in the epigastric space, utilizing the liver to improve image quality. Sweeps are performed by pivoting the transducer at each site and in each orthogonal projection. The following paragraphs review the standard TTE views with accompanying TTE images of CHD lesions to provide the reader with examples of what is best seen and imaged from various positions along the chest and epigastrium.
The subcostal view provides excellent imaging of the heart with CHD. Combined orthogonal views from this location give the echocardiographer a comprehensive overview of the entire heart (Figs. 6.6 and 6.7). Caval and pulmonary venous return, visceral and atrial situs, ventricular looping, and outflow tract arrangement are all demonstrable from this position. The presence of an interrupted inferior vena cava and either azygous or hemiazygous venous continuation is best viewed from the subcostal location. Additionally, the atrial septum is best profiled by virtue of the more perpendicular imaging plane relative to the septum’s spatial lie. The ventricular sizes and intraventricular septum are well profiled, and all four valves and the outflow tracts are seen, permitting one to determine ventricular looping and great arterial relationship, along with a basic description of the intersegmental connections. The subcostal short-axis view is valuable in assessing vena caval size and flow characteristics, descending aortic flow, and inferiorly draining anomalous pulmonary veins. In palliated single-ventricle patients, the subcostal short-axis view also provides an excellent way to assess the IVC flow through the Fontan connection (Fig. 6.8).
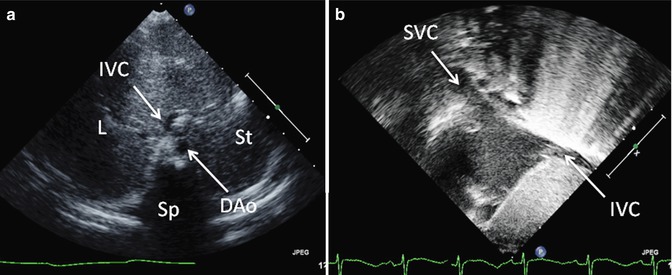
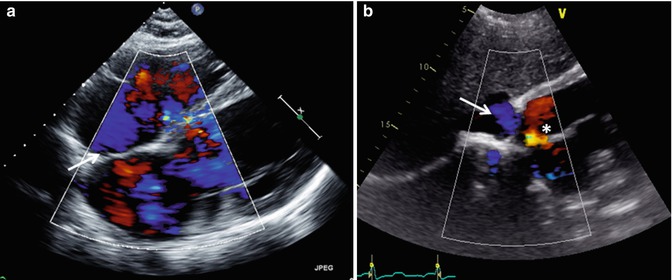
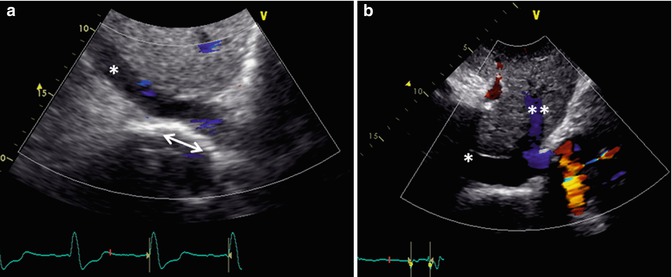
Fig. 6.6
Transthoracic imaging from the subcostal view. (a) Depicts a sweep at the subxyphoid process from caudal, posterior, and deep in the abdomen up to the heart which is cranial, anterior, and superficial. The sweep shows visceral situs with the descending aorta (DAo) leftward of the spine (Sp), the inferior vena cava (IVC) anterior and rightward to the aorta, the liver (L) positioned to the patient’s right, and the stomach (St) on the patient’s left. Collectively, these structures define visceral situs solitus. (b) Depicts additional subcostal imaging in an orthogonal plane to demonstrate superior and inferior vena caval (SVC, IVC) return to the morphologic right atrium, helping to confirm atrial situs solitus
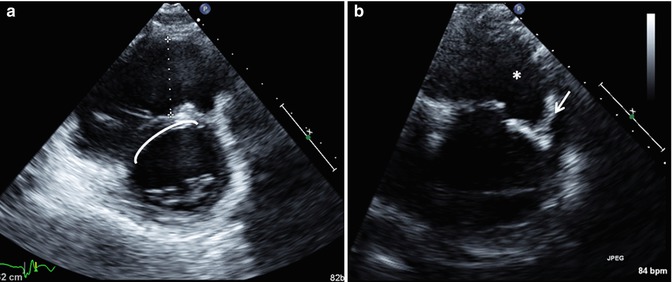
Fig. 6.7
Transthoracic echo imaging from the subcostal view. (a) Demonstrates a subcostal long-axis slice in an adult with an unrepaired ventricular septal defect. Comprehensive imaging was necessary to ensure lack of other associated defects prior to performing surgical defect closure. Subcostal views offer the best plane for imaging the atrial septum as the plane of imaging is nearly perpendicular to the septum, resulting in the clearest delineation of its structure. In this example, 2-dimensional and color Doppler imaging demonstrate an intact atrial septum (arrow). (b) Demonstrates subcostal long-axis imaging in an adult patient with palliated single-ventricle congenital heart disease (pulmonary atresia, intact ventricular septum, hypoplastic right ventricle). Two-dimensional and color Doppler imaging show low-velocity flow from the IVC to an extracardiac Fontan conduit (arrow). In addition, an atrial level defect from prior atrial septectomy is noted with bidirectional shunting on color Doppler imaging. Left-to-right shunting is noted in the image above
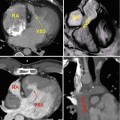
Fig. 6.8
Transthoracic echo imaging from the subcostal view in Fontan patients. (a) Demonstrates a subcostal short-axis slice showing a normal-sized inferior vena cava that is anastomosed directly to an extracardiac Fontan conduit (bidirectional arrow). Color Doppler demonstrates low-velocity flow through the cava and conduit. The conduit appears more echo-bright on 2-dimensional imaging compared to normal vascular or cardiac tissue. (b) Demonstrates a similar subcostal slice in a Fontan patient palliated with a variant of an atriopulmonary Fontan. Marked dilation of the inferior vena cava and hepatic veins (**) is noted. Low-velocity color flow is again noted consistent with passive venous return to the pulmonary arteries
The parasternal view provides excellent imaging of the ventricles and, in particular, the left ventricle. Tricuspid and mitral valve architecture are well delineated. The ventricular septum is profiled extremely well given the perpendicular relationship between the imaging plane and septal lie (Fig. 6.9). Depending on body habitus, the right ventricle may be imaged to varying degrees, and one can appreciate chamber size, wall thickness, and systolic function. The ventricular outflows and semilunar valves are imaged well, providing the sonographer with excellent opportunities to assess for congenital and postoperative status of these structures. The parasternal short-axis views allow for imaging of the atrial septum and pulmonary veins when sweeping near the base of the heart; however, this can be limited. The right ventricular outflow, main pulmonary artery, and proximal branch pulmonary vessels are well profiled from the short-axis view. Finally, the right ventricular size is better visualized from the short-axis view, and septal motion is easily assessed in this imaging plane (Fig. 6.10).
Get Clinical Tree app for offline access
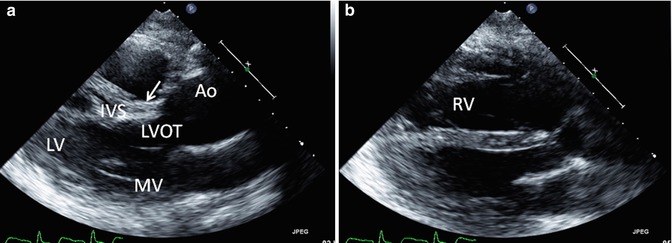
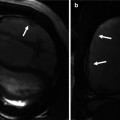
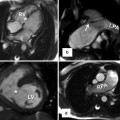
Fig. 6.9
Transthoracic echo imaging of a young adult with repaired tetralogy of Fallot. Images from the parasternal long-axis view are shown. (a) Shows a more posterior angled imaging plane, profiling the left ventricle (LV), mitral valve (MV), ventricular septum (IVS), and left ventricular outflow tract (LVOT) to the ascending aorta (AAo). The patch used to close the ventricular septal defect can be seen (arrow) without gross 2-dimensional evidence of a residual defect. The ascending aorta is severely dilated. (b) Shows a more anterior imaging plane in the same transthoracic view by “sweeping” the ultrasound probe from deep to superficial along the chest wall. In this view, the right ventricle (RV) is well profiled and noted to be significantly dilated with a chamber size that is nearly twice that of the left ventricle, frequently the consequence of right ventricular outflow tract and pulmonary valve pathology
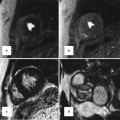
Fig. 6.10
Transthoracic imaging using the parasternal short-axis sweep in a patient with repaired tetralogy of Fallot. (a


Related posts:
Stay updated, free articles. Join our Telegram channel
Full access? Get Clinical Tree
