Image Fusion
Charles R. Meyer
Richard L. Wahl
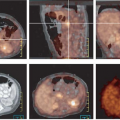
Functional imaging with positron emission tomography (PET) is normally performed as a tomographic technique designed to trace a specific biological process with a process-specific radiotracer. The tomographic images, as well as the whole-body projection images provided by PET, are generally diagnostically valuable on their own. However, PET imaging evolved initially as a “stand alone” nuclear method capable of visualizing this important functional information but displaying relatively little anatomic information. Although PET imaging devices display functional information in an anatomically correct context, the visualization of normal anatomy is substantially limited. As PET radiotracers became more and more specific for a given process, often only that process accumulated a disproportionately large amount of the radiotracer relative to background, making lesion detection easily possible, but lesion localization a much more approximate undertaking. For example, the highly targeted PET agents like fluorodeoxyglucose (FDG) accumulate so avidly to lesions that it can sometimes be difficult to determine precisely where the tracer-avid lesion is located anatomically. In some instances, precise anatomic localization is not possible as there is not sufficient radiotracer uptake into surrounding normal tissues. Thus, the ability to perform diagnostic imaging is compromised by the lack of anatomic correlative data. The use of image fusion, in the form of “anatometabolic” images for PET fused with magnetic resonance imaging (MRI) or computed tomography (CT) was shown feasible using software techniques in early studies of PET oncologic imaging (1). Software approaches to image fusion are quite valuable and are in widespread utilization, but can be limited if there is substantial patient motion between studies in nonrigid areas of the body. This type of problem is substantially addressed by obtaining the anatomic and functional images in close temporal proximity, often using dedicated in-line hybrid imaging devices such as PET/CT. This chapter reviews the varying approaches to producing fused anatomic/functional (anatomolecular) images.
PET/CT
Prospective “Hardware” Registration and Motion Artifact
Combined PET/CT came into existence because of the obvious diagnostic value of precisely combining functional and anatomic data for diagnostic purposes, which was first shown by software approaches. In addition, because the number of photons associated with CT far exceeded those available from an isotope source, CT supports both the fast acquisition and the computation of a low noise attenuation map for PET emission data, allowing PET to be quantitatively accurate in most instances. Typically the CT attenuation map is segmented into air, bone, soft tissue, water, fat, and possibly other components such as metal and contrast agents and is then used to attenuation-correct PET emission data, assuming no relative motion between the two data sets (1). As this correction is multiplicative (i.e., the PET emission data are multiplied by the appropriate path length related terms), the results become “baked in” to the resulting emission reconstruction. The process is highly problematic if there is misregistration between the two data sets, CT attenuation and PET emission, typically due to physiological or undetected frank patient motion. Nowhere are the results of such misregistration more visible than in the attenuation-corrected emission scans of older PET/CT machines seen in coronal cross section, where the CT acquisition was slow enough to catch the dome of the liver at two or more separate respiratory positions during the scan (see Chapter 4, Fig. 4.7 lower panel). Due to the multiplicative process it should be no surprise that the resulting attenuation corrected emission PET shows the same disarticulated liver segments as those captured in the CT scan, although we know that the same effects do not exist in the emission data from shallow respiration collected over three 40-minute periods. Such effects are not as visible in the newer scanners primarily due to the higher speed of CT scanning, but the insidious appearance of perfect registration is still omnipresent. Other organ locations are also affected by respiration (e.g., the prostate can move as much as 1 cm cranially caudally between full inspiration and expiration) (2). Undetected patient motion can occur between the CT attenuation and PET emission scans. If a patient repositions his or her head between the two scans, the resulting head and neck emission scan may appear to show high lymph node uptake where the attenuation correction is applied to data collected with little or no actual attenuation. If the interpreting physician suspects a motion-induced intensity artifact in the emission scan he or she can compare the geometry between reconstructions of the CT and uncorrected PET emission scan for differences as well as the presence of relative local uptake differences, but unfortunately such comparisons are likely to occur only if there is sufficient suspicion of misregistration. Otherwise misregistration effects, if
present, may not be detected by visual inspection of the apparently beautifully registered CT and PET attenuation-corrected emission data sets. Indeed, while the mechanical alignment of PET and CT devices in inline PET/CT scanners allows registration accuracy in the millimeter to submillimeter range, it is not possible to achieve this level of registration accuracy in most living patients due to physiological and voluntary positional differences seen between PET and CT during image acquisitions, which do not occur simultaneously with any of the commercial PET/CT scanners currently manufactured.
present, may not be detected by visual inspection of the apparently beautifully registered CT and PET attenuation-corrected emission data sets. Indeed, while the mechanical alignment of PET and CT devices in inline PET/CT scanners allows registration accuracy in the millimeter to submillimeter range, it is not possible to achieve this level of registration accuracy in most living patients due to physiological and voluntary positional differences seen between PET and CT during image acquisitions, which do not occur simultaneously with any of the commercial PET/CT scanners currently manufactured.
Retrospective Registration
Before PET/CT machines, registration of PET and CT data sets as well as those of other modalities occurred through the use of automatic and semiautomatic registration algorithms. There is a continuing need to register multimodal data combinations other than just PET/CT and single-photon emission computed tomography (SPECT)-CT and the number of combinations may be more than just two (e.g., MR-PET-SPECT). Additionally, there may be a need to register multiple interval examinations to carefully describe lesion growth. Because there are several excellent reviews on the genesis of registration (3,4,5), only superficial highlights will be emphasized here.
Metrics of Registration Accuracy
Before 1995 most registration problems were treated as isomodal (of the same modality) or were made similar by preprocessing to extract surfaces, edges, crest lines, and so forth so that cost functions (so named because they should be minimized), such as sum of square error, could be used. In 1995 three research groups nearly simultaneously gave birth to multimodality registration using image intensities directly via information theoretic objective functions (so named because they should be maximized), such as mutual information, or cost functions, such as entropy (6,7,8). These information-based theoretic measures proved to be very robust against issues such as missing data or differences in point spread function and are now popular in many registration methods found today. Even in isomodality registration, mutual information-based objective functions play an important role in easily handling unexpected differences in the data sets due to differences in phase of contrast injection and/or presence or absence of oral contrast agents in the gut.
Geometric Degrees of Freedom
Geometric degrees of freedom (DOF) are determined by the morphology of the problem that is trying to be solved. If there is an interest in registering the head of the same patient over multiple interval examinations, the problem is simplified to that of registering a rigid body (i.e., just rotation and translation are required), unless there are suspected temporal differences in the brain structures. For three spatial dimensions (3D) there are three translation and three rotation parameters, for a total of six parameters (i.e., six DOF). If in addition isotropic registration is allowed the DOF become seven. If shearing and scaling on each axis is allowed in addition to rotation and translation, there are now 12 parameters (or 12 DOF) for this linear, often called “affine” transform. Although more than six DOF is no longer a rigid body geometry problem, up to and including 12 DOF is still a linear solution (i.e., straight lines are still straight after this transform). Although little in the human body except bony structures and the effects of gradient shearing encountered in echo planar diffusion MRI acquisitions can be handled exactly by linear transforms (rigid body is a subset of linear transforms), many small regional deformations can be well approximated by full affine transforms (e.g., liver motion as a function of shallow respiration) (9).
In general the solution to registration problems in the human body (i.e., same patient with different poses), and certainly across different patients, requires warping (i.e., more than 12 DOF). In this registration domain there are many approaches as well. Geometric interpolants (i.e., functions that are computed to represent the best warping deformations between two poses of the same object) vary from:
Solutions to, or approximations of the Navier-Stokes equation for viscous flow where the DOF approach the number of voxels in the reference data set (10,11),
Harmonic series (e.g., the discrete Fourier or cosine transform where the DOF equals the number of nonzero coefficients) (12),
Polynomials described by maximum variation order (13),

Stay updated, free articles. Join our Telegram channel

Full access? Get Clinical Tree


