Fig. 12.1
The two rows, referring to an individual patient with primary cervical cancer, show texture maps for FDG (metabolic marker) and Cu-ATSM (hypoxia marker) alone and overlapping texture maps of the two markers [37]
These features were shown to predict response in cancers of the cervix [34], esophagus [48], head and neck [49], and lung cancer [50]. MaZda is a dedicated software for image feature analysis [51]. An example of PET different feature extraction from head and neck cancer is shown in Fig. 12.2.


Fig. 12.2
A pretreatment PET scan of a head and neck cancer case of a patient who died from disease after radiotherapy treatment. (a) The head and neck tumor region of interest (brown) and the gross tumor volume (GTV) (green) were outlined by the physician. (b) An IVH plot, where I x and V x parameters are derived. (c) A texture map plot of the GTV heterogeneity through intensity spatial mapping
12.2.2 Dynamic PET Features
These features are based on kinetic analysis using tissue compartment models and parameters related to transport and binding rates [52]. In the case of FDG, a three-compartment model could be used to depict the trapping of FDG-6-phosphate (FDG6P) in tumor [53, 54]. Using estimates from compartmental modeling, glucose metabolic uptake rate could be evaluated. The uptake rate and other compartment estimates themselves could form “parameter map” images, which previously described static features, and could be derived from as well (see Chap. 14).
Glucose metabolic rate was correlated with pathologic tumor control probability in lung cancer [55]. Thorwarth et al. published interesting data on the scatter of voxel-based measures of local perfusion and hypoxia in head and neck cancer [56, 57]. Tumors showing a wide spread in both showed less reoxygenation during a course of radiotherapy and had lower local control. A rather interesting approach to improve the robustness of such features is the use of advanced 4D iterative techniques; an example is given in Fig. 12.3. Further improvement could be achieved by utilizing multi-resolution transformations (e.g., wavelet transform) to stabilize kinetic parameter estimates spatially [58].


Fig. 12.3
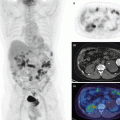
An abdominal dynamic FDG-PET/CT kinetic analysis. The figure shows the three-compartment parameter map (K 1 , k 2 , k 3 ) model assuming irreversible kinetics (k 4 = 0), blood volume component (bv = K 1 /k 2 ), and K FDG net influx rate constant (Ki). In this case, the parameters were obtained using a 4D iterative technique (compared with simple differential methods) by estimation directly from the sinogram domain
12.3 Extension to PET/CT and PET/MR
Combining information from multiple modalities allows for better utilization of complementary features from different images. For instance, several studies have indicated that inter- and intra-observer variability of defining the tumor extent could be reduced by using PET/CT or PET/MR. Researchers in lung cancer reported reduced variability when using CT with PET for target definition [3, 10]. Furthermore, a study of fractionated stereotactic radiotherapy for meningioma patients demonstrated improved target definition by combining physiological information from PET, anatomical structure from CT, and soft tissue contrasts from MRI, resulting in alterations of the original contour definitions in 73 % of the cases [59]. However, this visual approach for integrating multimodality imaging information is prone to observer subjectivity and variations as contrasted to single image analysis as discussed later.
The PET imaging features presented as static metrics in Sect. 12.2.1 could be applied equally to PET/CT or PET/MR, where instead of SUV, Hounsfield units are used in the case of CT, and T1w or T2w images, for instance, could be used in the case of MRI, for instance, using its weighted relaxation times or proton density pixel intensities. In the case of dynamic MRI acquisitions, the corresponding pharmacokinetic models would be applied to extract the parametric maps such as extended Tofts model [60], which is also a three-compartment model, and extracted parameters include the transfer constant (K trans), the extravascular-extracellular volume fraction (ve), and the blood volume (bv).
However, among the most challenging issues in multimodality imaging is the fusion of multiple imaging data from different scanners. This is typically carried out through a geometric transformation, i.e., image registration. This could be solved greatly using integrated hardware systems such as PET/CT scanners or PET/MRI scanners; otherwise, software solutions need to be deployed. These software solutions could be divided into rigid or deformable registration techniques [61]. In our previous work, we have developed several tools for this purpose such as MIASYS [62] and DIRART [63]. https://sites.google.com/a/umich.edu/ielnaqa/home/software-tools.
MIASYS is a dedicated open-source software tool developed in MATLAB for multimodality image analysis. The software tool aims to provide a comprehensive solution for 3D image segmentation by integrating automatic algorithms, manual contouring methods, image preprocessing filters, post-processing procedures, user-interactive features, and evaluation metrics. The implemented methods include multiple image thresholding, clustering based on K-means and fuzzy C-means (FCM), and active contours based on snakes and level sets. Image registration is achieved via manual and automated rigid methods [62].
DIRART is also an open-source software implemented in MATLAB to support deformable image registration (DIR) for adaptive radiotherapy applications. Image registration in this regard computes voxel mapping between two image sets and is formulated as an optimization problem in which the solution is found by maximizing a similarity metric between the two images (e.g., mutual information). DIRART contains 20+ deformable image registration (DIR) algorithms including 12 different optical flow algorithms, different demon algorithms, and four level set algorithms. It also supports interface to ITK so that ITK DIR algorithms can be called from within DIRART. Currently five ITK DIR algorithms are supported, including demon algorithms and B-spline algorithms. In addition, the newer inverse consistency algorithms to provide consistent displacement vector field (DVF) in both forward and backward directions are implemented [63].
12.4 Application of PET in Radiotherapy
In the following, we discuss the application of PET to radiotherapy with focus on two cases, contouring of tumor/organs at risk in treatment planning and outcome prediction for clinical decision-making using radiomics.
12.4.1 Biological Target Definition Using PET
Medical image segmentation is a process to separate structures of interest in an image from its background or other neighboring structures. It is a necessary prerequisite step for many medical imaging applications in radiology and radiation therapy. These applications may include automatic organ delineation, quantitative tissue classification, surface extraction, visualization and image registration, etc. [64, 65]. For instance, Pham and coworkers divided segmentation algorithms into eight different categories: thresholding, region growing, classifiers, clustering, Markov random field models, artificial neural networks, deformable models, and atlas-guided approaches. In our work on PET-guided treatment planning in radiotherapy, we presented a comparative survey of the current methods applied for tumor segmentation [66, 67]; an example in head and neck cancer using different segmentation algorithms is presented in Fig. 12.4.


Fig. 12.4
Example of different PET segmentation methods of head and neck cancer. The methods include 40 % of SUVmax (SUVmax40) and the methods of Nestle, Black, Biehl, and Schaefer. This is in addition to the level set technique (active contour), the stochastic EM approach (EM), the FCM algorithm (FCM), and the FCM-SW variant of the FCM algorithm (FCM-SW). The 3D contour defined on the macroscopic tumor specimen is used as the reference for assessing the performance of the different segmentation techniques (From Zaidi et al. [66])
There are several commercial and academic software tools that support different segmentation algorithms. In general, commercial software packages have better implementations with a user-friendly interface for manual and semiautomatic segmentation methods, but often lag behind the latest development in the field. In contrast, academic software packages, such as ITK [68], BioImage Suite [69], MIPAV [70], ImageJ [71], and 3D slicer [72], may tend to be oriented toward single-modality applications and less friendly in handling multimodality images as proposed here.
Most automatic algorithms attempt to utilize image intensity variations or image gradient information. However, for low-contrast images, many of these algorithms tend to provide suboptimal solutions that are not clinically acceptable. For such cases, it has been demonstrated that if multiple images are available for the same object (the same image modality or different image modalities), all the available complementary information can be fed into the segmentation algorithms to define the so-called biophysical target [73]. Thus, the segmentation algorithms would benefit from the complementary information from different images, and consequently the accuracy of the final segmentation results could be improved. Similar approaches have been applied for detecting blood-wall interface of heart ventricles from CT, MRI, and ultrasound images using a snake deformable model [74], for classifying coronary artery plaque composition from multiple contrast MR images using K-means clustering algorithm [75], and for defining tumor target volumes using PET/CT/MR images for radiotherapy treatment planning by using a multivalued deformable level set approach as in our previous work. Mathematically, such an approach is a framework that could be thought of as a mapping from the imaging space to the “perception” space as identified by the radiologists [73]:

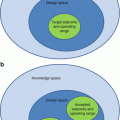
where  is the mapping function from the different imaging modalities to the target space parameterized by λ, which represents users’ defined set of parameters representing the prior knowledge. This framework is highlighted in Fig. 12.5.


(12.1)
 is the mapping function from the different imaging modalities to the target space parameterized by λ, which represents users’ defined set of parameters representing the prior knowledge. This framework is highlighted in Fig. 12.5.
Fig. 12.5
Biophysical target as generated from multimodality imaging by combining anatomical and functional information
The robust image segmentations methods are based on deformable models, which are geometric representations of curves or surfaces that are defined explicitly or implicitly in the imaging domain. These models move under the influence of internal forces (contour curvature) and external forces (image boundary constraints) [76, 77]. The level set is a state-of-the-art variational method for shape recovery [76, 78–80]. They were originally developed in curve evolution theory to overcome the limitations encountered in parametric deformable models (e.g., snakes [81]) such as initialization requirement, generalization to 3D, and topological adaptation such as splitting or merging of model parts. Our generalization to multimodality imaging is based on redefining the concept of a boundary as a logical or “best” combination of multiple images by learning and incorporating expert’s knowledge on subregional or even voxel levels. An example showing combination of PET/CT in lung cancer is shown in Fig. 12.6 using a multivalued level set algorithm [73].


Fig. 12.6
Joint estimation of lung PET/CT target/disease volume. (a) A fused PET/CT displayed in CERR with manual contouring shown of the subject’s right gross tumor volume. The contouring was performed separately for CT (in orange), PET (in green), and fused PET/CT (in red) images. (b) The MVLS algorithm was initialized with a circle (in white) of 9.8 mm diameter, an evolved contour in steps of ten iterations (in black), and the final estimated contour (in thick red). The algorithm converged in 120 iterations in few seconds. The PET/CT ratio weighting was selected as 1:1.65. (c) MVLS results are shown along with manual contour results on the fused PET/CT. Note the agreement of the fused PET/CT manual contour and MVLS (dice = 0.87). (d) MVLS contour superimposed on CT (top) and PET (bottom) separately
In another example the PET/CT images were taken from patients with cervix cancer. The PET image was sharpened using a deconvolution approach [82]. The 40 % maximum SUV (standard uptake value) thresholding is adopted in many institutes to estimate gross tumor volume for cervix cancer patients due to the high target to background ratio of these tumors in PET and the difficulty to distinguish their boundary in CT. In Fig. 12.7, the active contour algorithm is initialized with a circle (in white) of 15.9 mm diameter around the PET lesion. The evolved contour took ten iterations (in blue) and the final estimated contours (in thick black) are shown. The algorithm converged in just 30 iterations. This fast convergence could be attributed in part to the almost spherical shape of the tumor and the sharpness of the gradient. It is noticed that the results of the algorithm match the PET ground truth (99 %) as delineated by an experienced nuclear medicine radiologist. Hence, the delineation results were explained mainly by PET in this case, although information from CT could still be used to steer the algorithm, if desired.


Fig. 12.7
A 3D generalization of multivalued level set (MVLS) algorithm in the case of PET/CT cervix. The MVLS algorithm is initialized with a sphere (in white) of 15.9 mm diameter, a curve evolution in steps of ten iterations (in magenta), and the final estimated contour (in thick blue). The algorithm converged in 30 iterations. MVLS estimated contour superimposed on CT. MVLS estimated contour superimposed on PET
12.4.2 PET Radiomics
The extraction of quantitative information from imaging modalities and relating information to biological and clinical endpoints is a new emerging field referred to as “radiomics” [32, 33]. Traditionally, quantitative analysis of FDG-PET or other PET tracer uptake is conducted based on observed changes in the standard uptake value (SUV). For instance, decrease in SUV postirradiation has been associated with better outcomes in lung cancer [83, 84]. However, SUV measurements themselves are potentially pruned to errors due to the initial FDG uptake kinetics and radiotracer distribution, which are dependent on the initial dose and the elapsing time between injection and image acquisition. In addition, some commonly reported SUV measurements might be sensitive to changes in tumor volume definition (e.g., mean SUV). These factors and others might make such approach subject to significant intra- and inter-observer variability [25, 26, 34].
Radiomics consist of two main steps, extraction of static and dynamic features as discussed in Sect. 17.3 and outcome modeling as presented in the following. Outcomes in oncology and particularly in radiation oncology are characterized by tumor control probability (TCP) and the surrounding normal tissue complication probability (NTCP) [85, 86]. A detailed review of outcome modeling in radiotherapy is presented in our previous work [87]. DREES is a dedicated software tool for modeling of radiotherapy response [88]. In the context of image-based treatment outcome modeling, the observed outcome (e.g., TCP or NTCP) is considered to be adequately captured by extracted image features [34, 89]. We will highlight this approach using classical logistic regression.
Logistic modeling is a common tool for multi-metric modeling. In our previous work [90, 91], a logit transformation was used:


