Chapter 7
Image Processing and Display
After completing this chapter, the reader will be able to perform the following:
1. Define all the key terms in this chapter.
2. State all the important relationships in this chapter.
3. Explain histogram analysis, automatic rescaling, and lookup tables and their role during computer processing to create a quality digital image.
4. Differentiate among the vendor-specific types of exposure indicators.
5. Compare and contrast the types of display monitors used for diagnostic interpretation and image reviewing.
6. Identify the important features of monitors that may affect the quality of the displayed image.
7. Explain the difference between luminance and luminance ratio.
8. Recognize postprocessing functions, including electronic collimation, window level and width, subtraction, contrast enhancement, edge enhancement, and smoothing.
9. Define the acronyms PACS, DICOM, and HL7.
10. Explain how the latent image is converted to a manifest image during automatic film processing.
11. State the developing and fixing agents used in chemical processing.
12. List the sequential stages and systems needed to process a quality radiographic film image.
13. State methods to maintain the archival quality of film radiographs.
14. Discuss the role of chemical replenishment, temperature control, and silver recovery during film processing.
15. State the requirements for darkroom safelights, temperature, and humidity control.
Digital Image Processing
Histogram Analysis
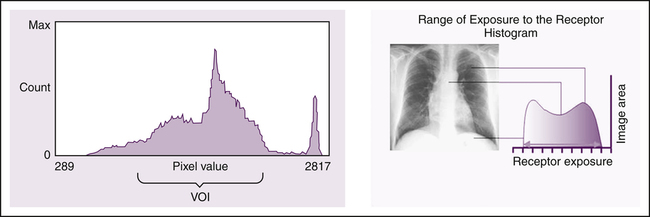
Histogram analysis is an image processing technique commonly used to identify the edges of the image and assess the raw data prior to image display. In this method, the computer first creates a histogram of the image (Figure 7-1). A histogram is a graphic representation of a data set. A data set includes all the pixel values that represent the image before edge detection and rescaling. This graph represents the number of digital pixel values versus the relative prevalence of the pixel values in the image. The x-axis represents the amount of exposure, and the y-axis represents the incidence of pixels for each exposure level. The computer analyzes the histogram using processing algorithms and compares it with a preestablished histogram specific to the anatomic part being imaged. This process is called histogram analysis. The computer software has stored histogram models, each having a shape characteristic of the selected anatomic region and projection. These stored histogram models have values of interest (VOI), which determine the range of the histogram data set that should be included in the displayed image.
 Important Relationship
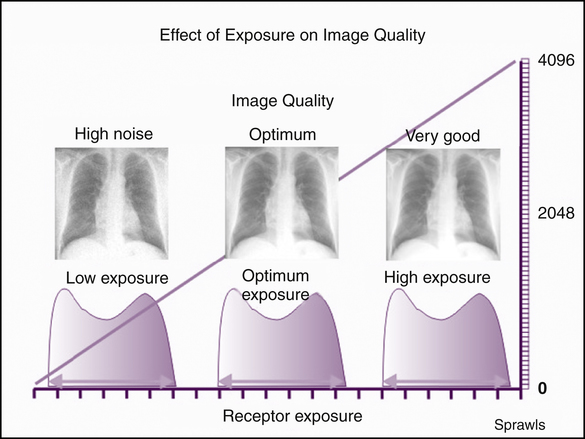
Histogram analysis is also employed to maintain consistent image brightness despite overexposure or underexposure of the IR. This procedure is known as automatic rescaling. The computer rescales the image based on the comparison of the histograms, which is actually a process of mapping the grayscale to the VOI to present a specific display of brightness (Figure 7-2). Although automatic rescaling is a convenient feature, radiographers should be aware that rescaling errors occur for a variety of reasons and can result in poor-quality digital images.
Exposure Indicator
An important feature of digital image processing is its ability to create an image with the appropriate amount of brightness regardless of the exposure to the IR. As a result of the histogram analysis, valuable information is provided to the radiographer regarding the exposure to the digital IR. The exposure indicator provides a numeric value indicating the level of radiation exposure to the digital IR. Currently, exposure indicators are not standardized among various digital imaging equipment in use today; however, the industry is working toward standardization of the exposure indicator. See Table 7-1 for a list of CR vendor-specific exposure indicators.
TABLE 7-1
Computed Radiography Vendor-Specific Exposure Indicators
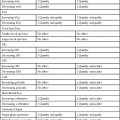
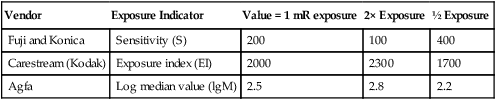
| Vendor | Exposure Indicator | Value = 1 mR exposure | 2× Exposure | ½ Exposure |
| Fuji and Konica | Sensitivity (S) | 200 | 100 | 400 |
| Carestream (Kodak) | Exposure index (EI) | 2000 | 2300 | 1700 |
| Agfa | Log median value (lgM) | 2.5 | 2.8 | 2.2 |
 Important Relationship
Lookup Tables
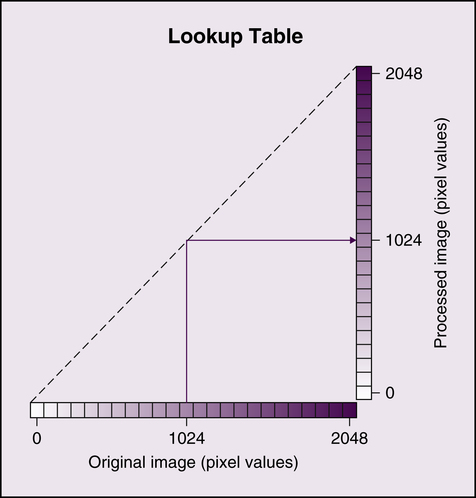
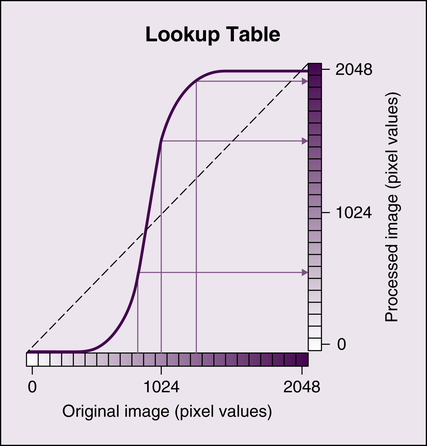
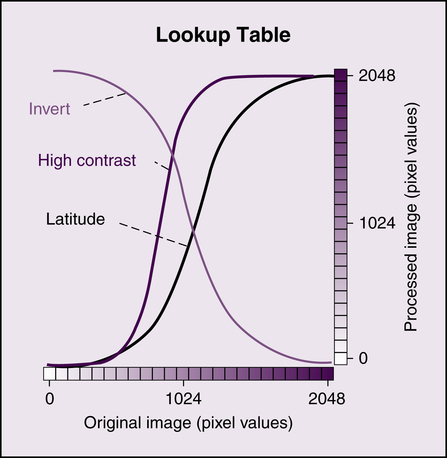
Following histogram analysis, lookup tables provide a method of altering the image to change the display of the digital image in various ways. Because digital IRs have a linear exposure response and a very large dynamic range, raw data images exhibit low contrast and must be altered to improve visibility of anatomic structures. Lookup tables provide the means to alter the brightness and grayscale of the digital image using computer algorithms. They are also sometimes used to reverse or invert image grayscale. Figure 7-3 visually compares pixel values of the original image with a processed image. If the image is not altered, the graph would be a straight line. If the original image is altered, the original pixel values would be different in the processed image and the graph would no longer be a straight line but might resemble a characteristic curve for radiographic film (Figure 7-4).
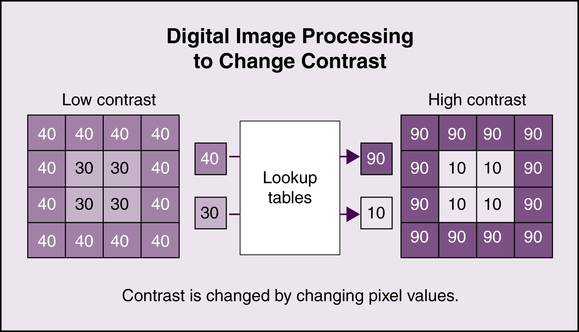
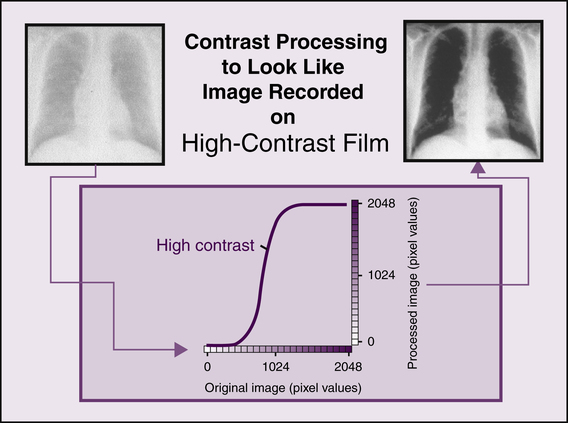
For example, each pixel value could be altered to display the digital image with a change in contrast. New pixel intensities would be calculated that result in the image being displayed with higher contrast (Figure 7-5). Figure 7-6 shows the original image, the graph following changes in the pixel values, and the processed higher contrast image. Lookup tables provide a method of processing digital images in order to change the brightness and contrast displayed (Figure 7-7).
 Important Relationship
Image Display
Display Monitors
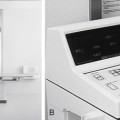
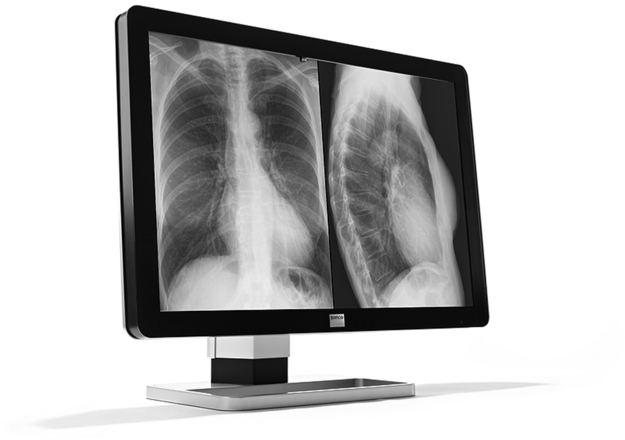
As discussed previously, the quality of the digital image is affected by its acquisition parameters and subsequent computer processing. In addition, the quality of the digital image is affected by the performance of the display monitor. The quality of display monitors may not be equal among all those used for viewing of digital images. Monitors used by radiologists for diagnostic interpretation, referred to as primary, must be of higher quality than the monitors used only for routine image review. However, the radiographer’s monitor should be of sufficiently high quality in order to discern all the image quality characteristics accurately before sending the image to the radiologist for diagnostic interpretation. Display monitors used for diagnostic interpretation are typically monochrome high-resolution monitors and can be formatted as portrait or landscape and configured with one, two, or four monitors (Figure 7-8). A display monitor having diagonal dimensions of 54 cm (21 inches) is adequate to view images sized 35 × 43 cm (14 × 17 inches).
Types of Monitors
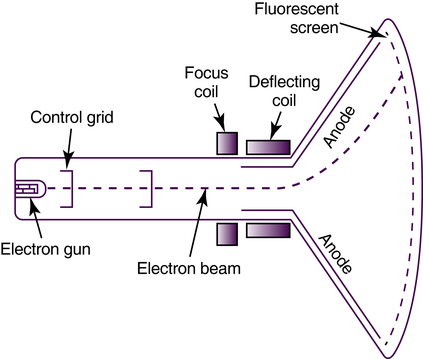
A CRT monitor creates an image by accelerating and focusing electrons to strike the faceplate composed of a fluorescent screen (Figure 7-9). Because the image is scanned on the screen in lines, the number of lines affects the quality of the image displayed. It is recommended that CRT monitors scan at least 525 lines per  of a second. The major components of the CRT monitor are the electron gun encasing a cathode, focusing coils and deflecting coils, and the anode. This type of display monitor typically has a curved faceplate, and its dimensions are deeper.
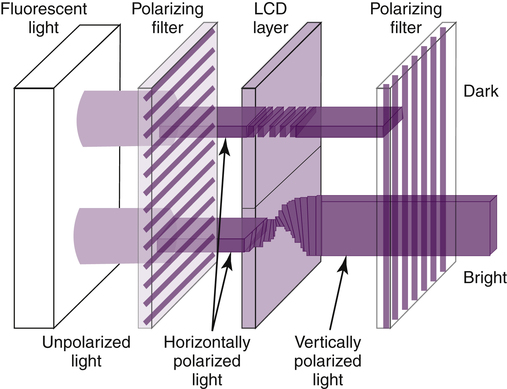
The LCD monitor passes light through liquid crystals to display the image on the glass faceplate. Additional components include a source for the electrical signal and light waveforms and polarizing filters (Figure 7-10). The electrical signals can vary the light waveforms that pass through the crystals for viewing on the faceplate. The LCD monitor has a flat faceplate, and its dimensions are thinner.