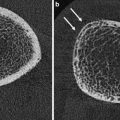
Fig. 1
HR-pQCT. Normal morphology and pathologic examples of the ultradistal tibia. a Normal tibial bone microstructure in a middle-aged woman; b + c postmenopausal osteoporosis; d premenopausal osteoporosis; e young patient with post-traumatic paralysis of lower limbs; f postmenopausal women with type-2 diabetes mellitus and fractures; g renal osteodystrophy; h healing insufficiency fracture; i osteogenesis imperfecta (Sillence type 1)
Somewhat surprisingly, the interpretation of longitudinal HR-pQCT studies has been challenging (Burghardt et al. 2010c, d; Li et al. 2010; Seeman 2010; Seeman et al. 2010; Macdonald et al. 2011a; Rizzoli et al. 2012). Only a few studies have used data acquired at multiple imaging centers (Seeman et al. 2010). As with DXA, the utility of HR-pQCT to address important questions related to the epidemiology of osteoporosis, the antifracture efficacy of certain drugs, and the development of normative databases for clinical assessment of skeletal health requires scalability of imaging parameters to standardized multicenter data pools. In particular, cross-calibration procedures are needed to account for sources of intrinsic data variability between scanners and time points. To address these issues, Burghardt et al. proposed the use of structure- and composition-realistic anthropomorphic phantoms constructed from static cadaveric bone tissue (Burghardt et al. 2012). Based on phantom measurements at nine different imaging centers, they reported inters-canner variability comparable in magnitude to short term in vivo reproducibility reported elsewhere (MacNeil and Boyd 2007; Kazakia et al. 2008). Resembling reproducibility results from single scanner studies, densitometric measures were also highly reproducible in this multiscanner study [root mean square coefficient of variation (RMSCV) approximately 1 %]. Likewise, geometric and microstructural measures were less precise (4–6 % RMSCV). Sources of error were found to be variable and scanner specific, including differences in resolution and signal-to-noise ratios, geometric, and density calibration, or related to post-processing factors. Among other caveats in longitudinal HR-pQCT studies, the assumption of a fixed bone matrix mineralization has to be considered. Many drugs with proven antifracture efficacy significantly affect tissue mineralization which could per se lead to small, false positive increases in vBMD, and the derived structural parameters such as relative trabecular bone volume (BV/TV), trabecular thickness, or trabecular separation (Boivin et al. 2000; Roschger et al. 2010).
2.3.1 μ-CT
Micro-computed tomography (μ-CT) is a high-resolution imaging technique for small objects such as bone biopsies (Muller 2002). It does not allow in vivo imaging of human bone tissue but has been widely used as a validation tool for techniques such as HR-pQCT (Cohen et al. 2010; Liu et al. 2010c) or HR-MRI (Bauer et al. 2009; Bae et al. 2012). The spatial resolution of μ-CT reaches up to a few micron, therefore imaging of trabecular structures is well feasible (trabecular diameter = approx. 100–200 μm). μ-CT does not only allow for 3D (global) morphometry of bone samples but also provides access to structural properties of individual trabeculae [e.g. Stauber and Muller 2006; Scaling Index Method (SIM)] (Fig. 2). Morphometric indices are determined by using a direct 3D approach (Hildebrand et al. 1999) and typically include (BV/TV), trabecular thickness (TbTh), trabecular separation (TbSp), trabecular number (TbN), connectivity density (Conn.D), and the structure model index (SMI). μ-CT and other high-resolution techniques that provide even higher spatial resolution (e.g. synchrotron imaging) have become essential tools that support various scientific disciplines such as osteology, tissue engineering (Peyrin 2011), anthropology (Benazzi et al. 2011), geophysics, and material testing. For more details on μ-CT and its state of the art use, the reader is referred elsewhere (Muller 2002; Bouxsein et al. 2010)
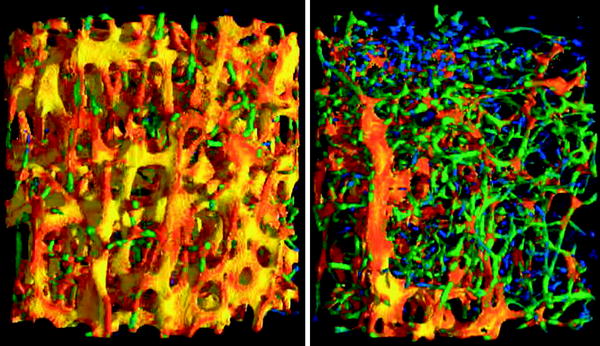
Fig. 2
3D visualization of μCT scans of a healthy (left) and an osteoporotic (right) vertebral specimen. The dimensionality of every single trabecula is color coded, as determined by the scaling index method: rods are blue and green, plates are red and yellow
3 Magnetic Resonance Imaging
Like in CT, technical innovations have pushed the limits in high-resolution magnetic resonance imaging (HR-MRI). With phased array coils, parallel imaging, stronger gradients, and magnets as well as improved pulse sequences and postprocessing software, clinical scanners provide an in vivo spatial resolution close to the diameter of single trabeculae (Techawiboonwong et al. 2005; Krug et al. 2006; Phan et al. 2006; Wehrli 2007). Ultra short TE imaging opens the possibility to directly visualize cortical bone. Additionally, even functional parameters like bone marrow perfusion can be assessed by MRI. However, difficulties in standardization, fluctuations in image quality have impeded broader use and often lead to HR-pQCT being the preferred imaging modality for the noninvasive assessment of bone microarchitecture (Bauer and Link 2009; Ito 2011).
3.1 High Resolution-Magnetic Resonance Imaging of Trabecular Bone
Compared to CT, mechanisms of image generation differ completely in high resolution-magnetic resonance imaging (HR-MRI). It lacks ionizing radiation, an advantage both for clinical screening and scientific studies. On the other hand, one must be aware that trabeculae appear as signal voids within the high-intensity fatty bone marrow—not the mineralized tissue itself is visualized by conventional MRI, but only an artifact due to the very short T2 relaxation time and off-resonance effects at the bone—bone marrow interfaces. The appearance of these signal voids is determined by many imaging parameters: gradient echo sequences, longer TE, and higher field strengths increase susceptibility artifacts, and consequently the overestimation of the trabecular thickness and bone volume fraction (Majumdar et al. 1995; Bauer et al. 2009). Thus, a similar acquisition technique is essential to compare trabecular bone measurements across different patients and studies (Fig. 3).
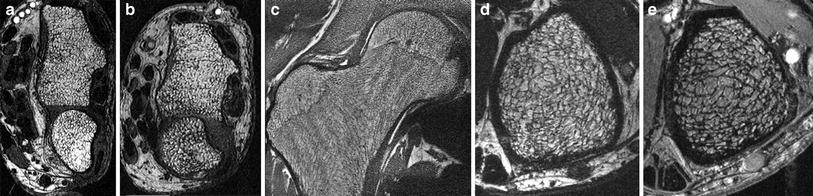
Fig. 3
HR-MRI of trabecular structure, visualized at 3T (a–d) and 7T (e), at the distal radius (a, b), the proximal femur (c), and the distal tibia (d, e). Differences between postmenopausal women without (a) and with (b) vertebral fractures are obvious
HR-MRI has mostly been performed in the peripheral skeleton, as these sites are easily accessible with small coils, contain a high amount of trabeculae and the bone marrow consists of fat, resulting in high bone–bone marrow contrast. However, using SNR efficient sequences, high magnetic field strength (3 Tesla), and phased array coils, HR-MRI has been shown to be feasible at the proximal femur, a skeletal site frequently affected by osteoporotic fractures (Krug et al. 2005). However, spatial resolution was limited, and persistent hematopoietic bone marrow obscured the visualization of single trabeculae in some patients at the femoral neck. Comparing trabecular bone architecture at the distal radius and tibia, Wehrli et al. could demonstrate treatment effects and age-related changes only at the lower extremity, suggesting that the distal tibia might be the best site to measure bone microarchitecture by HR-MRI techniques currently available (Wehrli et al. 2008) (Fig. 3).
Many ex vivo studies demonstrated a high correlation between biomechanical strength and MR-derived measures of trabecular structure at different skeletal sites (Majumdar et al. 1996; Hwang et al. 1997; Pothuaud et al. 2002; Ammann and Rizzoli 2003; Link et al. 2004). In most studies, the combination of density measurements with parameters of the trabecular architecture yielded best results and significantly improved correlations of BMD alone. In vivo, many cross-sectional and longitudinal HR-MRI studies have been conducted (Majumdar et al. 1999; Cortet et al. 2000; Wehrli et al. 2001; Laib et al. 2002; Link et al. 2002; Rietbergen et al. 2002; Boutry et al. 2003; Benito et al. 2005; Chesnut et al. 2005; Ladinsky et al. 2008). Postmenopausal women with and without osteoporotic insufficiency fractures were better separated using MR-derived structure measures compared to BMD alone (Link et al. 1998; Majumdar et al. 1999; Cortet et al. 2000; Wehrli et al. 2001). Similar results were obtained for HR-MRI in hypogonadal men, patients with renal osteodystrophy, and patients with cardiac and renal transplants (Link et al. 2000, 2002; Link 2002; Benito et al. 2003; Wehrli et al. 2004). Treatment effects and age-related changes were quantified in longitudinal studies and demonstrated the feasibility of HR-MRI to reproducibly quantify changes of trabecular architecture noninvasively and without ionizing radiation (Rietbergen et al. 2002; Benito et al. 2003; Chesnut et al. 2005; Wehrli et al. 2008; Folkesson et al. 2011).
3.2 Magnetic Resonance Imaging of Cortical Bone
While vertebral fracture risk is determined predominantly by trabecular bone architecture, cortical bone geometry, thickness, and porosity are important predictors for hip fractures. Cortical bone can be assessed, visualized, and quantified in several ways by MRI. Several studies focused predominantly on geometric parameters (Woodhead et al. 2001; Sievanen et al. 2007). They showed that MRI provides a feasible tool for the assessment of cortical bone at the femur and may be of clinical utility in assessing hip fragility, as the thin cortical bone at the narrowest location of the femoral neck could be delineated precisely and accurately with a standard clinical 1.5 T MRI device (Gomberg et al. 2005; Sievanen et al. 2007). In other studies, osteoporotic patients with vertebral or femoral fractures could be distinguished based on proximal femur geometry and femoral geometry improved the prediction of bone strength in biomechanical studies (Beck et al. 1990; Alonso et al. 2000; Gnudi et al. 2004; Louis et al. 2010). A more sophisticated approach to characterize cortical bone is the visualization and quantification by ultrashort echo time pulse sequences (UTE) (Du et al. 2011; Krug et al. 2011; Rad et al. 2011; Bae et al. 2012; Biswas et al. 2012). Due to the short T1 and T2* relaxation times of bone tissue, such special sequences are needed to retrieve any signal from bone tissue (Reichert et al. 2005). Despite the challenging pulse sequence design, studies showed that a quantification of bone water content is possible and correlates with cortical porosity and biomechanical properties (Bae et al. 2012; Biswas et al. 2012). Also treatment effects could be detected (Anumula et al. 2010). However, the significance of these findings is not completely understood and future research will have to study cortical porosity using both MR and HR-pQCT, what may be interesting in particular in diabetic patients (Burghardt et al. 2010b; Patsch 2012) or patients with renal osteodystrophy.
3.3 Functional Magnetic Resonance Imaging
The viability of bone relies on bone cells, mineralized tissue properties, and bone marrow function. Several diseases, as diabetes mellitus, immobility, and glucocorticoid therapy are associated with high bone marrow fat fraction and increased fracture risk (Rosen and Bouxsein 2006). Thus, MR spectroscopy and dynamic contrast-enhanced MR perfusion imaging have been used to investigate bone marrow composition and function (Schellinger et al. 2004; Griffith et al. 2005, 2006, 2008; Shen et al. 2007 ). MR perfusion showed a decrease in vertebral marrow maximum enhancement and enhancement slope in patients with low BMD. An increase in marrow fat content measured with spectroscopy was also associated with lower BMD.
4 Basic Principles of Quantifying Bone Structure in High-Resolution Bone Imaging
4.1 Image Preprocessing
To calculate quantitative parameters of trabecular or cortical bone, the processing of images usually consists of several steps, like normalization or binarization, resolution enhancement, registration, and segmentation. To ensure a high degree of reproducibility, human interaction has to be limited to a minimum and each step needs to be standardized (Newitt et al. 2002; Valentinitsch et al. 2012). Different morphometric analysis techniques have been applied with the most common approaches yielding a reproducibility of 2–4 % for MRI and <4.5 % for HR-pQCT parameters (Ouyang et al. 1997; Newitt et al. 2002b; Gomberg et al. 2004; MacNeil and Boyd 2007; Burghardt et al. 2010a; Baum et al. 2012). In case of HR-pQCT, prior to the application of a fixed segmentation threshold, a smoothing and edge enhancement procedure is performed on grayscale images. Afterwards, the periosteal contours are drawn in a semiautomatic manner. In case of MRI, registration can be included in the image acquisition already. Resolution enhancement usually is performed before images are binarized with a dual reference thresholding technique that uses the signal intensity of the cortex as a reference (Majumdar et al. 1995). Segmentation of the trabecular bone compartment is mostly done either manually or semiautomatically (Mueller et al. 2006; Phan et al. 2006; Wehrli 2007). A more recent approach used in HR-pQCT is fully automated (Valentinitsch et al. 2012).
4.2 Morphometric Parameters
In high-resolution bone imaging, standard morphometric parameters are named in analogy to those used in microscopy-based, static histomorphometry (Parfitt et al. 1987). In HR-pQCT, parameters of bone microstructure are mostly derived from compartment-specific bone density. Specifically, BV/TV is derived from trabecular vBMD assuming a fixed mineralization of 1,200 mg HA/cm3 for compact bone. Tb.N and network heterogeneity are directly measured by 3D distance transformations (Hildebrand and Ruegsegger 1997). Tb.Th (in μm) and Tb.Sp (in μm) are derived from Tb.N and/or trabecular density using stereological standard relations assuming a plate-model geometry (Laib et al. 1998).
4.3 Advanced Parameters
HR-pQCT also provides morphologic measures of cortical bone including cortical porosity (Burghardt et al. 2010a; Nishiyama et al. 2010). Although cortical porosity is increasingly recognized as a pathomorphologic surrogate of poor bone quality (Holzer et al. 2009; Burghardt et al. 2010c, d; Zebaze et al. 2010), it remains to be stressed that noninvasive imaging techniques only capture relatively large pores (>82 μm) (Nishiyama et al. 2010).
Parameters describing trabecular shape and anisotropy can also be estimated in vivo. They include measures of the surface curvature or the differentiation of plates and rods by decomposition technique-based analyses (Boutry et al. 2003; Pothuaud et al. 2004; Liu et al. 2010a, b; Pialat et al. 2012). The anisotropy and preferred orientation of the trabeculae were first quantified by the mean intercept length method (MIL) in histological sections (Whitehouse 1974). In ex vivo applications, 3D techniques such as the scaling vector method or gabor filtering have been proposed to quantify trabecular orientations (Monetti et al. 2005).
While most of these measures require a binarization of the grayscale image data, several methods have been proposed to account for the partial volume effects due to the limited spatial resolution in MDCT and MRI and use the full grayscale data. Autocorrelation functions and fuzzy logic methods were used to determine parameters of scale and connectivity, while the SIM was used to determine the dimensionality of the single trabeculae as a parameter of shape (Mueller et al. 2006; Räth et al 2008; Monetti et al. 2011; Sidorenko et al. 2011). These parameters demonstrated benefits regarding the prediction of biomechanical strength in particular for osteoporotic bone (Räth et al 2008).
MDCT, HR-pQCT, and HR-MRI data can also be subjected to FE modeling. FE modeling is a well-established biomechanical computation method that yields loading scenario-specific, image-based estimates of bone strength (e.g., ultimate force required to fracture upon a certain type of fall) (Newitt et al. 2002a; Chevalier et al. 2010; Genant et al. 2010; Rajapakse et al. 2012) (Fig. 4). HR-pQCT-based μ-FE analyses have been shown to discriminate men and postmenopausal women with and without fragility fractures independent of BMD (Boutroy et al. 2008; Vilayphiou et al. 2010, 2011). MDCT-based FEA better estimated proximal femoral strength as compared to DXA and explained differences between men and women (Keyak et al. 2011). Also treatment effects were characterized by FE analysis (van Rietbergen et al. 2002; Jayakar et al. 2012; Keaveny et al. 2012). In experimental studies, very high correlations (R² > 0.93) were observed between biomechanical experiments and FE analysis by combining bone density and measures of trabecular anisotropy (Trabelsi et al. 2011). By separately modeling cortical and trabecular bone, such high correlations were also observed in resolution regimes available by in vivo MDCT imaging (Eswaran et al. 2009; Pahr and Zysset 2009) .
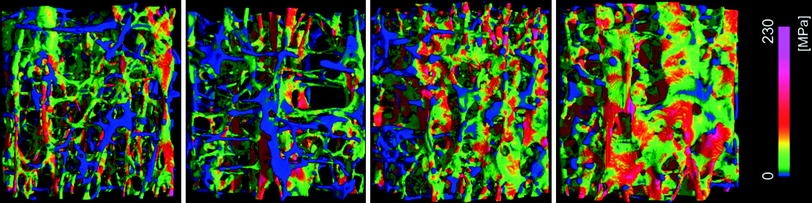
Fig. 4
Color-coded local van-Mises stress in four different vertebral bone samples scanned by μ-CT as determined by FEA
5 Conclusion
In conclusion, flat-panel CT, HR-pQCT, and HR-MRI provide novel, noninvasive, and accurate options for the quantification of bone microarchitecture. Although current research focusing on potential clinical applications seems promising, both techniques are still limited to research use. The results of high-resolution imaging studies should be interpreted with respect to technical caveats of these techniques.
6 Key Points
High-resolution imaging techniques allow the noninvasive quantification of bone microarchitecture in research settings.
HR-pQCT involves very low radiation doses but dedicated scanners are needed.
HR-MRI is a technically challenging method which is somewhat hard to standardize, but allows the quantification of trabecular microarchitecture noninvasively without ionizing radiation.
Advanced structural and biomechanical metrics of trabecular and cortical bone structure are promising research parameters for the quantification of drug effects and patient-specific fracture risk.Related posts:

Stay updated, free articles. Join our Telegram channel

Full access? Get Clinical Tree