Fig. 7.1
Hydrogel scleral buckle. Axial CT image shows a bulky soft tissue attenuation structure encircling the right globe (arrows). There is a punctate calcification associated within the buckle medially. Silicone oil is present within the globe
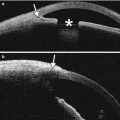
Fig. 7.2
Hydrogel scleral buckle on ultrasound. B-mode ultrasound image shows a nearly anechoic structure adjacent to and slightly indenting the posterior globe (arrows)
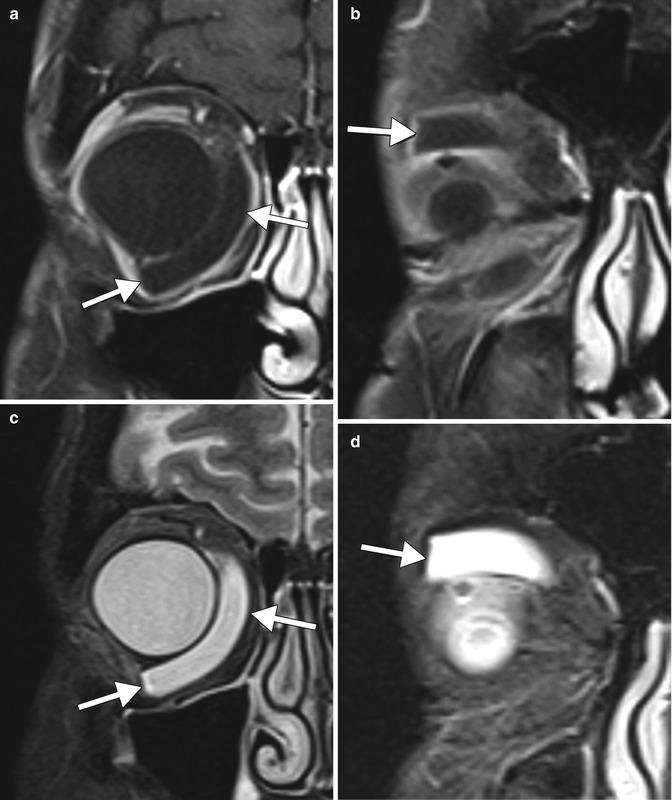
Fig. 7.3
Segmental hydrogel scleral buckle. Coronal fat-suppressed post-contrast T1-weighted (a, b) and fat-suppressed T2-weighted (c, d) MR images show a semicircular right scleral buckle in the medial orbit (arrows). The device has similar signal characteristics as fluid
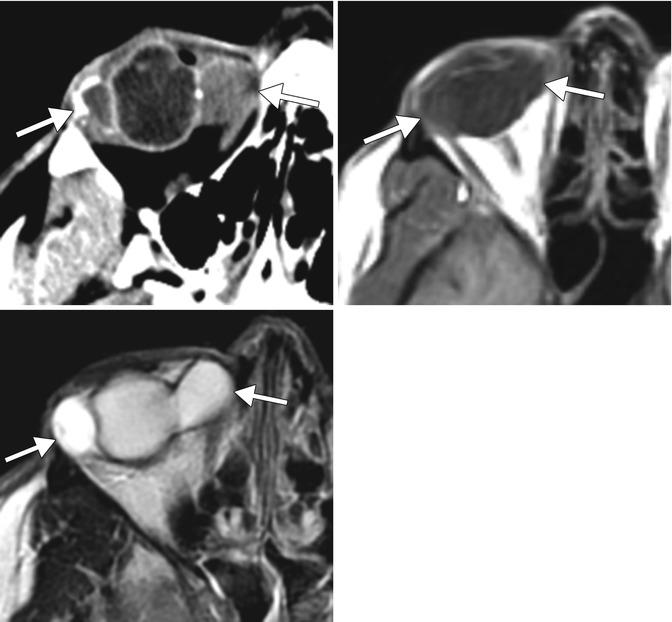
Fig. 7.4
Hydrated hydrogel scleral buckle with mass effect. Axial CT image (a) shows a markedly expanded buckle with associated rim calcifications. Axial T1-weighted (b) and axial T2 (c) images show that the expanded scleral buckle has signal characteristics similar to that of fluid
Fig. 7.5
Fragmented and migrated hydrogel scleral buckle. Axial CT image shows posterolateral displacement of a portion of the swollen scleral buckle with rim calcifications (arrow)
Currently, silicone exoplants are almost exclusively used for scleral buckling. These are available as either solid silicone rubber or porous sponges. The solid silicone elements are noncompressible compared to the silicone sponges which, because of the multiple air cells, deform when under pressure. On B-scan ultrasound, silicone scleral buckles are hyperechoic (Fig. 7.6). On CT, the solid rubber silicone scleral buckle appears hyperattenuating (Fig. 7.7), while the silicone sponge scleral buckles are hypoattenuating, similar to air (Fig. 7.8). Solid silicone bands are occasionally used in combination with the silicone sponge elements (Fig. 7.9). Silicone scleral buckles are MRI compatible and appear hypointense on all sequences (Fig. 7.10).
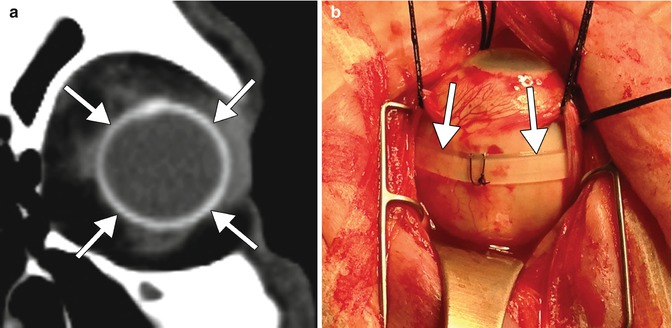
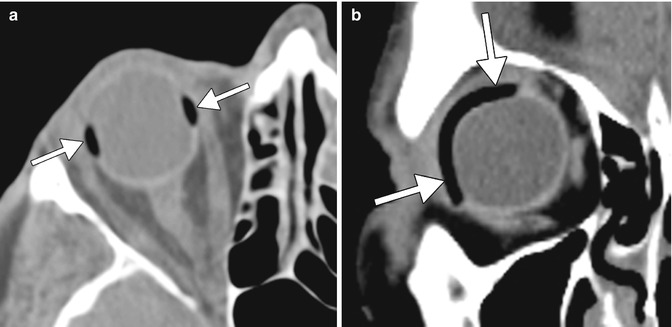
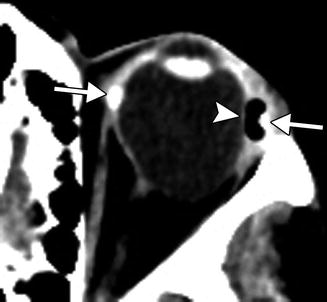
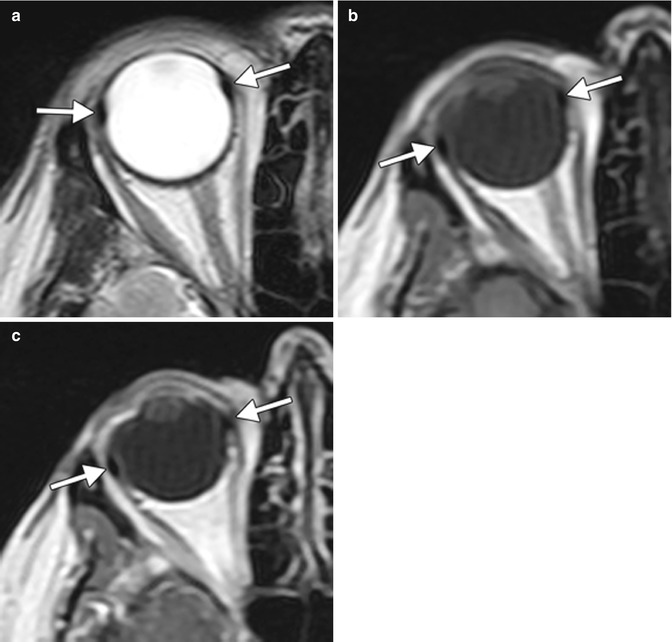
Fig. 7.6
Silicone scleral buckle depicted on ultrasound. B-mode ultrasound image shows a hyperechoic scleral buckle mildly indenting the globe (arrow), as intended (Courtesy of Karen Capaccioli and Lois Hart)
Fig. 7.7
Silicone rubber scleral buckle depicted on CT and intraoperatively. Coronal (a) CT image shows the hyperattenuating implant encircling the globe (arrows). Intraoperative photograph (b) shows a scleral buckle in situ (arrows)
Fig. 7.8
Encircling and segmental silicone sponge scleral buckles depicted on CT. Axial CT image (a) shows the low attenuation device encircling the scleral buckle that mildly indents the right globe (arrows). Axial CT image in a different patient (b) shows the low-attenuation segmental device partially encircles the temporal aspect of the right globe (arrows)
Fig. 7.9
Combined encircling silicone rubber and segmental silicone sponge scleral buckles depicted on CT. Axial CT image shows a thin high attenuation band that encircles the right globe (arrow) and a thicker high-attenuation buckle along the superomedial quadrant of the right globe (arrowhead)
Fig. 7.10
Encircling silicone scleral buckle depicted on MRI. Axial T2-weighted (a), T1-weighted (b), and post-contrast T1-weighted (c) MR images show the non-enhancing hypointense scleral buckle encircling the right globe (arrows)
An uncommon but serious complication of scleral buckling is infection. Acute infections associated with silicone scleral buckles may show diffuse scleral thickening and preseptal soft tissue swelling with enhancement on imaging (Fig. 7.11). Scleral thickening may decrease as infection improves in response to appropriate antibiotic therapy. On imaging, silicone sponge has low attenuation when not infected and high attenuation in the presence of infection. In cases of chronically infected scleral buckles, the sclera may be thickened around the buckle, but with scleral melting under the buckle. Salient findings on MRI include increased T2 signal intensity and corresponding enhancement in the preseptal and postseptal tissues of the orbit and thickening of the sclera (Fig. 7.12). Most often the infected scleral buckle needs to be surgically removed to adequately treat the infection.
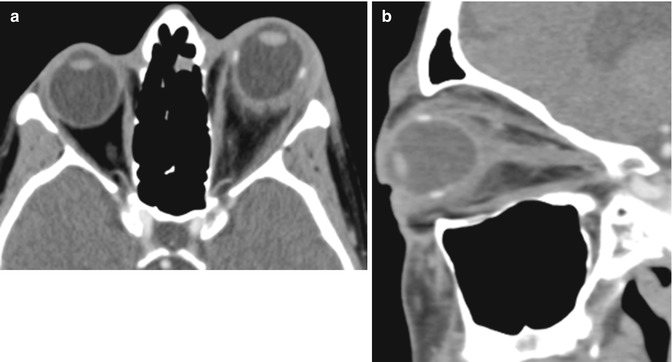
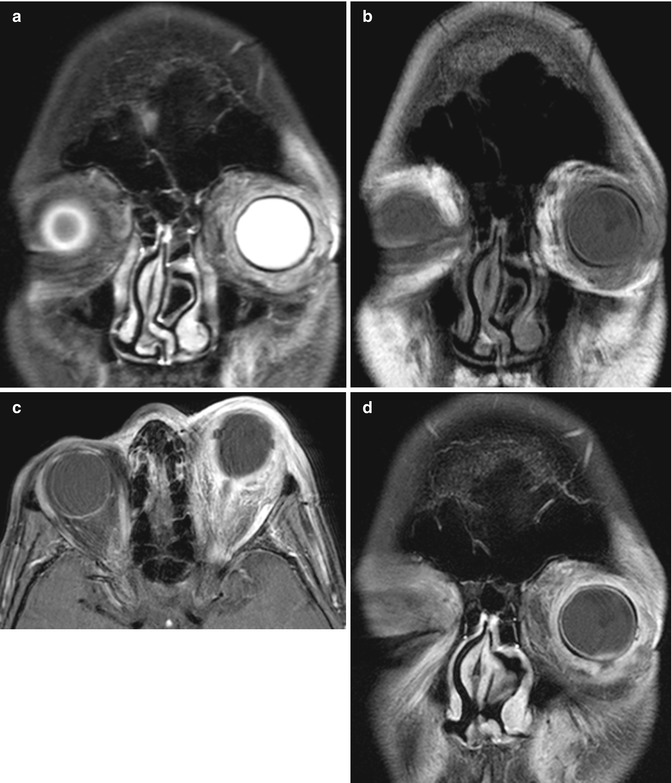
Fig. 7.11
Infected scleral buckle depicted on CT. Axial (a) and sagittal (b) CT images show proptosis of the left globe with preseptal edema and scleral thickening associated with a hyperattenuating left silicone scleral buckle
Fig. 7.12
Infected scleral buckle depicted on MRI. Coronal T2-weighted (a), coronal T1-weighted (b), and axial (c) and coronal (d) fat-suppressed T1-weighted MR images show proptosis with preseptal and postseptal inflammatory changes in the left orbit, particularly surrounding the scleral implant, which is hypointense on all sequences
Imaging, particularly with ultrasound, is useful for characterizing the position of the scleral buckle and associated complications.
7.3 Vitrectomy
Vitrectomy is another option for surgical repair of retinal detachment. During a vitrectomy, the vitreous gel is removed from the posterior segment of the eye using an instrument which provides high-speed cutting and aspiration. Removal of the vitreous gel eliminates the tractional forces on the retinal break and the retina as a whole. After removal of the vitreous, the fluid in the eye is exchanged for air; at the same time, the subretinal fluid is removed by aspiration, thereby reattaching the retina. In complicated retinal detachments, it is not always possible to remove the subretinal fluid with suction alone. Laser or cryopexy is applied around the retinal breaks to seal them. At the conclusion of the case, the eye is filled with an agent to tamponade the retinal breaks, preventing further passage of fluid through the breaks into the subretinal space until the chorioretinal scar from laser or cryopexy fully develops. Either gas (perfluoropropane, C3F8, or sulfur hexafluoride, SF6) or silicone oil may be chosen for tamponade. The intraocular gas is slowly reabsorbed into the bloodstream and replaced with fluid produced by the ciliary body while the silicone oil remains in the eye until surgically removed at a later date.
During the postoperative period, the intraocular gas is readily depicted on CT by the presence of an air-fluid level within the globe (Fig. 7.13). On MRI, there is corresponding low signal intensity on T1- and T2-weighted sequences (Fig. 7.14). On ultrasound, the gas appears as echogenic foci with associated ring-down artifact (Fig. 7.15). The intraocular gas is gradually reabsorbed into the bloodstream and the space it occupied becomes fluid-filled.
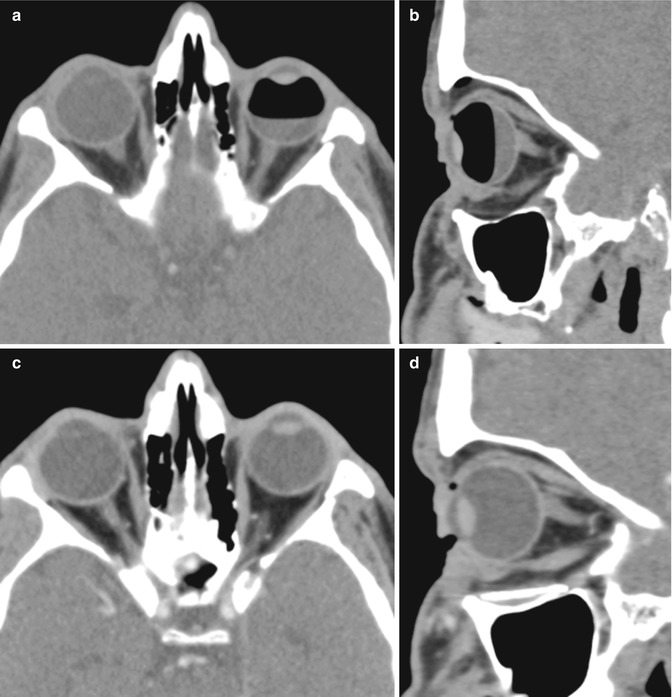
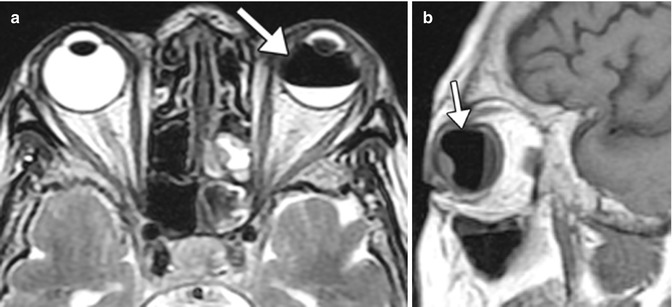
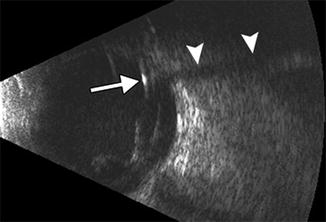
Fig. 7.13
Intraocular gas depicted on CT. Initial postoperative axial (a) and sagittal (b) CT images show a gas-fluid level within the left globe. Follow-up axial (c) and sagittal (d) CT images show the globe is now filled with fluid
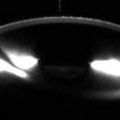
Fig. 7.14
Intraocular gas depicted on MRI. Axial T2-weighted (a) and sagittal T1-weighted (b) MR images show an anti-dependent signal void within the left globe (arrows), which represents the gas
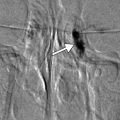
Fig. 7.15
Residual intraocular gas tamponade depicted on ultrasound. B-mode ultrasound image shows a hyperechoic focus (arrow) with associated ring-down artifact and acoustic shadowing (arrowheads), resulting from a residual bubble of gas (Courtesy of Karen Capaccioli and Lois Hart)
7.4 Intraocular Silicone Oil
The presence of silicone oil can impede sonographic evaluation. Therefore, CT or MRI may be required to evaluate the orbital contents in such cases. Alternatively, intraocular silicone oil may be encountered incidentally on imaging of the orbits or brain performed for unrelated reasons.
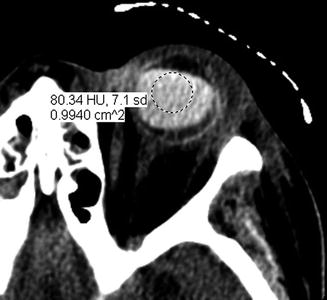
Intraocular silicone oil has unique imaging characteristics. On CT, the substance demonstrates high attenuation, typically 80–130 HU, depending upon the preparation (Fig. 7.16). On MRI, the appearance of silicone oil is variable, usually appearing as intermediate signal on T1-weighted sequences and as high signal on T2-weighted sequences, with no internal enhancement (Fig. 7.17). Consequently, the imaging features can mimic hemorrhage. However, the presence of chemical shift artifact, which manifests as bright and dark bands at the margins of the silicone oil, is helpful for differentiating silicone oil from hemorrhage. Elimination of the chemical shift artifact on MRI can be achieved with selective saturation of the silicone resonance, which can otherwise improve evaluation of the globe.
 Introduction to Approaches and Modalities in Postoperative Orbital Imaging
 Imaging After Cornea Surgery
 Imaging of Strabismus and Craniofacial Malformation Surgery
 Imaging After Orbital and Intraocular Oncology Therapies
 Ophthalmic Imaging and Neuroimaging of the Effects of Glaucoma Treatment
 Imaging After Oculoplastic Surgery


Related posts:
Introduction to Approaches and Modalities in Postoperative Orbital Imaging
Imaging After Cornea Surgery
Imaging of Strabismus and Craniofacial Malformation Surgery
Imaging After Orbital and Intraocular Oncology Therapies
Ophthalmic Imaging and Neuroimaging of the Effects of Glaucoma Treatment
Imaging After Oculoplastic Surgery
Stay updated, free articles. Join our Telegram channel
Full access? Get Clinical Tree
