(6.1)
Equation 6.1 gives the relationship between the number of contour boxes (N), the corresponding box size (λ), the box-counting fractal dimension parameter (D), and a proportionality constant (k).
An example of the application to trabecular bone can be observed in Fig. 6.1.


Fig. 6.1
Box-counting algorithm applied to boundaries of trabecular bone
The tortuosity, τ, characterizes the sinuosity of a structure. Geometrically, it is defined as the ratio between the geodesic distance and the Euclidean distance (L G/L E). The concept can be observed in Fig. 6.2. This approach allows to quantitatively classify the tortuosity of any non-regular structure, such as trabecular bone or chaotic vessels feeding a malignant tumor. Therefore, a structure is considered as tortuous if τ > 1 [3].


Fig. 6.2
Difference between Euclidean and geodesic distances in a filamentous structure
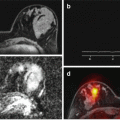
These methods can be applied to quantitatively evaluate tumor irregularity, either the tumor itself or any of its characteristics, like the different enhancement regions [8], or the tortuous and irregular feeding vessels (Fig. 6.3).


Fig. 6.3
Vascular characterization of rectal cancer. In (a), inverted grayscale image of a maximum intensity projection (MIP) reconstructed from a dynamic contrast-enhanced MR (DCE-MR) sequence. In (b), segmentation of the main vascular input to the tumor. In (c), grayscale. In (d), binarized image ready for the application of 2D tortuosity and fractal analysis techniques. For this case, D = 1.43 and τ = 1.58
6.4 Texture Biomarkers
Biological tissue composition and organization present a high variability depending on the organ and function in which their cells are specialized. Many tissues have an isotropic distribution, not being formed by elements aligned in a specific space direction, such as fat that can be considered as an isotropic tissue. Some others, however, have a clear arrangement in fiber bundles, such as muscle or white matter. Pathologic tissues like tumors are in most cases highly heterogeneous, combining regions with necrosis, edema, infiltration, hypoxia, and many other biological phenomena. In fact, tumor heterogeneity is considered to provide valuable prognosis information [9]. Different tissue regions can be analyzed by image processing techniques looking for mathematical descriptors of the grayscale pixel intensities, also called texture analysis. Also in the touch sense, the texture-based techniques allow for the characterization of the tissues from medical images in terms of uniformity, smoothness, granularity, and roughness.
Stay updated, free articles. Join our Telegram channel

Full access? Get Clinical Tree


