Fig. 2.1
Healthcare cycle and imaging biomarkers’ main hallmarks
Radiology approaches are based on the interaction of energy and living organisms to analyze tissue noninvasively, revealing properties relevant to detection, diagnosis, prognosis, or response to therapy. The data sets produced by the different imaging modalities are the end point of multiple, interdependent components that may be analyzed qualitatively or quantitatively. By extracting important information from images beyond our usual interpretation, radiologists will participate in the healthcare cycle through mastery of technology, clinical acumen, and attention to patient safety [16].
Imaging seems ideally suited to flourish as a quantitative science. A clinical image is inherently quantitative, as it is a matrix of numbers [28]. Quantitative imaging biomarkers extract and measure objective biological characteristics from any type of medical images [6]. The term radiomics is synonymously used for the development of methods to extract quantitative features which convert single images into mineable high-dimensional data and the subsequent analysis of these data for decision support [10]. The main characteristics of imaging biomarkers are that these tissue properties are resolved both in space, through parametric images, and in time, as response maps. As medical imaging does not destroy the evaluated samples, test-retest evaluations are feasible, allowing the repetition of experiments and measurements as frequently as desired.
Each voxel in a computer-derived image represents both the location and the value of a specific calculated parameter (morphological, biological, response) obtained by the application of mathematical or simulation models to the source images. These synthetic parametric maps represent the new paradigm in clinical radiology and should be considered as virtual biopsies, showing different morphological and biopathological abnormalities. These quantitative images assess the presence and the degree of a condition relative to normal findings. Imaging biomarkers are subrogated, spatially and temporally resolved, in vivo biopsies. Imaging biomarkers provide information related to the individual patient’s biological situation and clinical problems. It should be emphasized that imaging biomarker analyses are subrogated to the different underlying processes, strictly showing correlations but not cause-effect conditions [10]. Even more, the diagnostic information derived from these imaging-based measurements is often nonspecific, and the knowledge of the molecular or biological mechanisms remains implicit or unknown.
Biomarkers can be classified as prognostic, if accuracy of patient diagnosis or prognosis is improved; predictive, if the most beneficial treatment can be defined; response, when the beneficial outcomes can be shown after treatment; and monitoring, to detect relapse or toxicity [6].
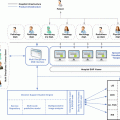
Technology and scientific biological discoveries have changed the way radiology is performed today. The multidisciplinary interaction between medicine and computer science, which falls within the field of biomedical engineering, focuses on the disease’s hallmarks that should be evaluated and on the proper way to do it in every clinical scenario. New acquisition techniques and new mathematical models are continuously being developed to accurately simulate the in vivo physiobiological status of a tissue. The final objective is to assure that the microscopic in vitro, macroscopic in vivo, and virtual in silico realities match to enforce the role of imaging in the major decisions of the healthcare cycle (Fig. 2.1). Imaging biomarker must be acquired in quality controlled and technologically stable equipments, to avoid sources of variability in the acquisition process, under safety conditions for the patients. They must be widely available, reproducible, and standardized in their main acquisition parameters and signal analysis and modeling. Finally, they must be validated in terms of precision and clinical efficacy. All these aspects will be discussed in this chapter.
In the era of personalized and precision medicine, imaging biomarkers provide specific information that helps in the decision-making process to achieve a definitive diagnosis, select the best treatment, and accurately evaluate treatment response [11]. To do it precisely, image-driven computing and data mining tools are applied to the analysis of biological systems to explore how the disease affects the different human organs and systems. Therefore, research and innovation in radiology involve multidisciplinary knowledge and team networking. Personalized and evidence-based guidelines will require a multidisciplinary approach to integrate relevant scientific and technological advances and provide expert guidance [12].
The radiologist’s role in multidisciplinary teams is to evaluate the evidence and interpret the radiology data in the context of other genetic or health-related data. Tailoring therapy to the individual characteristics of the specific disease requires quantitative information and knowledge of the biological signals associated to the specific disease process. To be used in preclinical and clinical decision-making, imaging biomarkers must be appropriately validated for use as surrogate end points for the application at issue. This pathway must fulfill some conditions, including that the biomarker is closely coupled to the target disease; the detection and measurement of the biomarker is accurate, reproducible, and feasible over time; and the measured changes over time are closely linked to the therapeutic effect and the end points [27].
Quantitative imaging biomarkers, as precision medicine tools, are expected to improve routine clinical care and speed the development of new treatments. Scientific and regulatory communities have embraced biomarkers as acceptable surrogate end points for clinical trials, fostering their widespread use in medicine [13]. Imaging biomarkers also aim to demonstrate the phenotypic manifestations of diseases, even when the genotype and penetrance are known, contributing to phenome-wide association studies [11].
2.2 Pipeline Development of Imaging Biomarkers: The Hypothesis
Understanding a disease and the way it is actually managed in a critical way is crucial to success in innovative projects. The radiologist and participating physicians need to know which are the facts whose knowledge will help improve early diagnosis, better phenotype the patient, or select the most adequate treatment. These aspects (Fig. 2.1) must be clearly defined, together with their correlation with the different biological and physiological changes, in order to properly assess the role of imaging for each individual healthcare cycle.
Academic institutions and research companies are establishing centers for translational and preclinical research designed to accelerate the discovery and adoption of imaging biomarker technology. Therefore, defining the appropriate pipeline for biomarker development and implementation is critical for success [5, 9, 21, 22].
Implementation of an imaging biomarker has several consecutive steps before it can be used as an innovative information tool in clinical settings. The different pipeline phases in biomarkers’ elaboration resemble those of the development in the pharmaceutical business [6, 26]. The definition of the target hallmark, source images, analytical methodology, and type of measurements are essential aspects that must be considered before studying a specific aspect in a given disease. Integrating an imaging biomarker into clinical practice needs conceptual consistency, technical reproducibility, adequate accuracy, and meaningful appropriateness.
The path to biomarker development, expansion, and subsequent implementation involves a number of consecutive phases described below (Fig. 2.2) [10, 21, 22, 26]. The development of a biomarker involves not only the validation of its relationship with the objective reality to which it is surrogated, either structural or physiological, but also the monitoring of its overall validity. Biomarkers need to follow all the developmental, validation, and implementation phases before clinical approval.

Fig. 2.2
The stepwise development of imaging biomarkers
The proof of concept tries to demonstrate that a specific biological hallmark or pathological abnormality might be evaluated using imaging and computational techniques. It can be also considered as the hypothesis to be tested and the main clinical objective or treatment improvement related to this innovative idea. As an example, nonalcoholic steatohepatitis is a condition that involves liver steatosis and inflammation, leading to chronic liver disease and cirrhosis. There is a need to measure liver steatosis and inflammation at the same time, as both biomarkers are synergic toward parenchymal fibrosis progression. It seems that a multivariate combination of a multiecho chemical shift-encoded sequence, giving a T1-T2* corrected estimation of fat deposit, together with a diffusion-weighted MR using the intravoxel incoherent motion model, giving an estimation of the amount of inflammation, might be a useful multivariate prognostic biomarker of steatohepatitis early diagnosis and grading [21, 22].
The proof of mechanism is needed to define the expected relationship between the extracted virtual imaging parameter and the relevant disease target that is under evaluation, both in magnitude and direction. In this sense, linearity in the relationship can be considered as the ability to provide measured quantity values that are directly proportional to the value of the measurand. As an example, if the R2* measurements, corrected by T1 and spectral fat-confounding variables, can measure the liver iron content in an accurate way, even in the presence of large deposits also by initial signal (S0) decay correction, this biomarker should be used to evaluate the response to treatment in hemochromatosis, as iron depletion will be related to a significant decreased and even disappearance of the liver iron deposits.
Defining both proofs, concept and mechanism, is extremely important as they represent the main hypothesis that has to be proven and tested with the subsequent steps. New methods and measures have to be compared to the known ground truth. Reference methods are the approaches or procedures widely recognized as the best available to determine the true state of disease under evaluation. Quantitative reference standards are values, generally accepted as having small measurements of uncertainty, that are used as a basis for comparison by using a reference method. The values obtained through imaging biomarkers need to be compared to known real, or truth, values. The relationships between measured and true values may be proportional, nonproportional, or even nonconstant or nonlinear. In some situations, measuring ranges or intervals should be defined as the range of the measurand in which bias, linearity, and precision are within acceptable bounds, although other ranges will not have this reliable proportion [29]. An example is liver iron concentration in hemochromatosis, as large deposits will hinder an accurate measurement due to the extremely low liver signal.
Defining which are the gold standards to which the biomarkers have to be compared is an extremely important aspect with huge relevance on the final validation process. Most studies agree to use core biopsy and pathology analysis as the gold standard to evaluate most biomarkers. However, pathology has some drawbacks and biases. Pathological studies are an ex vivo analysis, with no information on in vivo dynamic processes, as some biological pathways cannot be evaluated in pathological ex vivo samples. Biopsy is invasive, being associated to morbidity and even mortality. Even more important, biopsy is not feasible for research studies as ethics limits sample repeatability, and follow-up biopsies might not be possible as the biopsied tissue is partially destroyed.
Biopsy has sampling bias due to tissue and disease heterogeneity in distribution and grade, being subject to individual variability assessment with inter- and intra-subject discrepancies. Intrinsic tumor properties, such as the intra- and intertumoral heterogeneity, combined with interpatient heterogeneity, introduce a high grade of complexity in treatment planning. This is the main reason for single-tumor biopsy failure to assess tumor aggressiveness, treatment appropriateness, and tumor resistance. However, imaging biomarkers can evaluate tumor phenotypic heterogeneity when biopsy has limitations in assessing the genetic intratumoral differences.
Pathologic analysis is frequently based on semiquantitative grading and scoring, and not on continuous data, measuring subjective changes and percentages but not quantities, as digital quantitative pathology is still developing. If imaging biomarkers prove to be surrogate findings, they also could provide confirmatory information to support histopathologic findings [10]. Confirmation of disease measurements is often not reliable or even impossible also at autopsy.
In comparison to pathology, clinical outcomes might be more appropriate in some circumstances. Patient’s survival or time to progression may be more appropriate end points in cancer-related evaluations as prognostic outcomes. In this way, the relationship between perfusion permeability at the periphery of brain glioblastomas and patient survival seems more relevant than the pathological proof of tumor infiltration [25].
It is critical to recognize that all reference methods have some general biases. Measurement uncertainties can be present as there might not be a single right answer in those cases with a heterogeneous distribution of the biological hallmark. As tumors and lesions are nonhomogeneous in their phenotypic, physiologic components and genomic aspects, histogram-based analysis of the evaluated parameters may be more appropriate than normal statistical descriptors, such as the mean. Also, researchers have to consider the problem of short-term intrinsic variability, as in vivo biological examinations might be influenced by physiological changes in the subject and the lesion over time. As an example, liver stiffness for fibrotic evaluation in chronic diseases is subject to the patient’s fasting state.
2.3 Image Acquisition and Preparation for Analysis
Appropriate source images are essential for the extraction of useful biomarkers. The best image modality and protocol have to be defined for each biomarker and imaging modality.
Image acquisition (Chap. 4) must provide the best and more reproducible images, standardized by the radiological community after image quality and signal stability validation studies. The target organ must be studied with sufficient coverage and spatial resolution. The best compromise between spatial and temporal resolution requirements must be discussed for each biomarker to fit the analysis requirements. Data quality has to be checked regarding signal- and contrast-to-noise ratios, spatial resolution, temporal resolution, artifacts, and reproducibility. Periodic image quality control must be performed to assure data stability and quality over time. There have been multiple efforts to uniform the definition of acquisition and reconstruction standards [10].
Patient anonymization must be accomplished before the images are sent to any storage or computing server outside the hospital network. The pipeline must follow the principle of providing the minimum amount of confidential information, such as patient identifiers, to avoid the possibility of patient identification outside the hospital network. It is, therefore, necessary to accommodate the analysis of imaging data to DICOM image data stripped of identified headers and assigned a de-identified number [15].
To guarantee that the acquired images are optimal for the analysis, data processing and image preparation (Chap. 5) tools are needed to improve source image quality before the voxel-wise signal analysis step. General procedures include filters to reduce scattered noise and homogenize signal, as noise and heterogeneous signal distribution is a major confounding factor [17, 18]. Noise reduction techniques improve the entire signal modeling processes and must be always considered in the process of imaging biomarkers’ extraction. Artifacts should be also removed if possible as they introduce non-real data that will bias the signal analysis process. In most cases, there is a need to increase the spatial resolution of the acquired images and to enhance the detail of the tissues through super-resolution interpolation algorithms [2, 3]. The highest possible resolution is always recommended, as in trabecular bone 3D virtual model example.
Image registration methods transform different data sets into one spatial coordinate system. In dynamic acquisitions, where data is obtained over finite time periods, image coregistration through voxel repositioning must be performed to guarantee an accurate spatial coherence and ensure that the evaluated anatomical area is coherent in space in all the image series [8]. Registration is needed to be able to analyze and integrate the acquired data. A clear example is the voxel-by-voxel analysis of the dynamic series obtained after the intravenous administration of a contrast agent for tumor response evaluation, as respiratory and vascular movements displace the 3D data sets in every single acquisition.
Image segmentation is used to locate organs and lesions’ boundaries, labeling every pixel pertaining to a specific organ or lesion. Organ or lesion segmentation facilitates their analysis and the results visualization. Either a region of interest (ROI) or whole-organ maps (VOI, volume of interest) can be manually selected or extracted by automatic segmentation. Segmentation of images into VOIs such as lesion and normal organ is a crucial step for the subsequent informatics analyses. Manual segmentation by expert readers is often treated as ground truth, although it suffers from high interreader variability and is labor intensive [15]. Segmentation algorithms without user dependence are preferred over manual segmentations to minimize inter-subject variability. Segmentation of normal structures and organs, as well as well-defined lesions, can now be achieved with full automation. Advance segmentation of different subvolumes or habitats is more complex and requires knowledge of feature distribution. This process will be discussed later in the measurement and visualization section within this chapter.
2.4 Image Analysis and Feature Extraction
After image preparation, signal analysis and modeling (Chaps. 6 and 7) procedures have to be implemented to extract with the most appropriate computational processes the targeted identifications and required features from the acquired medical digital images. Static anatomical methods estimate tissue aspects related to the volume and shape of the tissues, topology, and co-occurrence matrix features for texture classification, while dynamic biological analysis assesses the different physical, chemical, and biological hallmarks (Fig. 2.3). As examples, cortical thickness and lung emphysema analyses are static methods, while fat and iron measurements or ADC quantification within the pancreas or perfusion-related D* measurements in the prostate are biomarkers obtained after biological dynamic modeling of the acquired data.

Fig. 2.3
Main types of imaging biomarkers
The calculated tissue properties, obtained from each voxel within the image-segmented framework, will demonstrate the spatial distribution of the biomarker by the use of 2D or 3D parametric images. In these color-coded maps, the pixels’ brightness represents the value of the specific biomarker in a color scale, showing the distribution of the parameter all over the evaluated tissue or organ. One successful representation is to show only those abnormal color-coded voxels overlaying the gray-scale anatomic reference image. The basic aspect of radiomics is the extraction of high-dimension feature data to quantitatively describe different attributes of the volume of interest within an organ, a lesion, or a subregion. Radiomics data are in a mineable form, allowing building descriptive and predictive models relating image features to phenotypes or genetic signatures.
Data mining with imaging biomarkers and radiomics data allows development of classification schemes, or models, to predict outcomes. These alone or in combination with additional information, such as demographic, clinical, liquid biopsy, or genomic data, will improve the clinical value of imaging biomarkers and radiomics analysis [10].
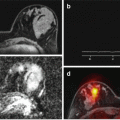
Combining multiple imaging quantitative parameters that reflect different aspects of pathophysiological processes will provide even newer insights into most diseases. Multivariate parametric images allow demonstrating the abnormal combination of biomarkers relevant to the evaluated pathways, reducing the amount and redundancy of the acquired data. The color of each voxel is determined by a multivariate function and shown habitats, reflecting the different microenvironments within the tissue. Some of the most popular multivariate statistical methods are linear regression, discriminant function analysis, and independent or principal component analysis. Statistics and pattern-recognition-based techniques may determine which computationally derived biomarkers, and with which weights, provide the most useful information about the clinical question or outcome being evaluated. The final output of the multiparametric analysis can be considered, mainly if specimen biomarkers are also included, as a nosologic image that shows on a pixel-by-pixel basis the probability of a pathological change or biological condition, expressed within an organ or lesion and relevant to the patient (Fig. 2.4).

Fig. 2.4
From image acquisition to biopathological multiparametric maps
In some cases, these surrogate end point clusters, including both imaging and nonimaging surrogates, may be better in predicting clinical outcomes than single surrogates, as disease outcomes are rarely the result of a single factor entirely encapsulated by one biomarker [26]. Multivariate, multidimensional, or multiparametric maps might demonstrate the disease’s hallmark presence and distribution, in a voxel-by-voxel basis, if the answer is complex enough to be represented by a single surrogate property. The basic philosophy is based in process engineering, capturing as much data as possible at the front end and use downstream database mining to identify the features with the highest prognostic value [19].
It is necessary here to clearly define the difference between multimodality and multiparametric analysis. In multimodality imaging, two or more imaging techniques are combined to compensate for the disadvantages of each imaging system while taking advantage of their individual strengths. Combination might be synchronous, at the same time, or metachronous, at different but close time points. In multimodality imaging, the voxel signal is a linear visualization of two different color palettes (i.e., PET-CT and PET-MR). Multiparametric imaging reflects the result of multidimensional data reduction and classifier model techniques applied to relevant parameters on a voxel-by-voxel basis to compensate for the disadvantages of single parameter-isolated analysis. The voxel signal tries to give a nosologic answer to the disease (Fig. 2.5). The combined radiologist’s subjective evaluation of two or more parameters and different images cannot be considered a multiparametric approach, although several of these notifications can be found in oncologic imaging papers, such as prostate cancer depiction.

 The Shift in Paradigm to Precision Medicine in Imaging: International Initiatives for the Promotion of Imaging Biomarkers
 Use Case II: Imaging Biomarkers and New Trends for Integrated Glioblastoma Management
 Pearls and Pitfalls in Gold Standards and Biological Correlation
 A Proposed Imaging Biomarkers Analysis Platform Architecture for Integration in Clinics
 Imaging Biomarker Model-Based Analysis
 Use Case III: Imaging Biomarkers in Breast Tumours. Development and Clinical Integration


Related posts:
The Shift in Paradigm to Precision Medicine in Imaging: International Initiatives for the Promotion of Imaging Biomarkers
Use Case II: Imaging Biomarkers and New Trends for Integrated Glioblastoma Management
Pearls and Pitfalls in Gold Standards and Biological Correlation
A Proposed Imaging Biomarkers Analysis Platform Architecture for Integration in Clinics
Use Case III: Imaging Biomarkers in Breast Tumours. Development and Clinical Integration
Stay updated, free articles. Join our Telegram channel
Full access? Get Clinical Tree
