Radiographic monitoring of posttreatment glioblastoma is important for clinical trials and determining next steps in management. Evaluation for tumor progression is confounded by the presence of treatment-related radiographic changes, making a definitive determination less straight-forward. The purpose of this article was to describe imaging tools available for assessing treatment response in glioblastoma, as well as to highlight the definitions, pathophysiology, and imaging features typical of true progression, pseudoprogression, pseudoresponse, and radiation necrosis.
Key points
- •
Various assessment guidelines for tumor progression, primarily designed for the purpose of phase 2 clinical trials, have been used over the course of the past several decades, with changes over time reflecting evolution in the approach to treatment and technological advances in imaging.
- •
Radiation necrosis and pseudoprogression are often thought of as 2 opposite extremes on the spectrum of radiation-induced injury, and imaging features may mimic disease progression.
- •
Pseudoresponse occurs in the setting of antiangiogenic therapy, and imaging findings include decreased contrast enhancement, edema, and permeability as early as 1 day after initiation of therapy.
- •
A multimodality approach to treatment response coupled with an understanding of the strengths and limitations of various imaging techniques is essential to accurate assessment of treatment response.
Introduction
Eighty percent of all malignant primary brain tumors diagnosed in the United States are gliomas. The current treatment paradigm for high-grade gliomas (grades III and IV) includes maximal surgical resection followed by concurrent adjuvant radiation and chemotherapy. The relatively recent addition of adjuvant chemotherapy with an oral alkylating agent, temozolomide, is based on pivotal data published in 2005 by Stupp and colleagues, which demonstrated a clinically meaningful and statistically significant overall survival benefit with minimal additional toxicity.
For patients with primary treatment failure or recurrence, the Food and Drug Administration approved the use of bevacizumab, an anti–vascular endothelial growth factor (VEGF) monoclonal antibody, in 2009. In addition, there are many experimental therapies currently under active investigation for patients with recurrent glioblastoma. These include immunomodulatory approaches, such as immune checkpoint inhibitors, tumor vaccines, chimeric antigen receptor (CAR)-modified T-cell therapy, and oncolytic virotherapy. Recently developed immune checkpoint inhibitors such as anti-CTLA-4 (ipilimumab) and anti-PD-1 (pembrolizumab and nivolumab) antibodies have demonstrated clinical efficacy in several solid tumors, with clinical trials for glioblastoma ongoing. Examples of viruses currently under investigation in patients with recurrent glioblastoma include an adenovirus expressing interleukin (IL)-12, a herpes simplex virus–1 replicating strain expressing IL-12, vaccine strains of the measles virus, an attenuated poliovirus vaccine, and a replicating retrovirus. Finally, alternating electric field therapy in which a portable device is attached to the scalp and delivers continuous low-intensity alternating electric fields has demonstrated prolonged progression-free and overall survival when used in combination with standard therapy. The device was approved in 2015 for the treatment of newly diagnosed glioblastoma and is expected to change the standard of care.
Tumor recurrence occurs in patients within a median of 6.7 months, with mean overall survival time of 14 to 16 months for glioblastomas. Radiographic monitoring of response is key, with a recent publication proposing a standardized reporting template for posttreatment glioma, including tumor genetics (isocitrate dehydrogenase [IDH], O 6 -methylguanine-DNA methyltransferase [MGMT] promoter) and treatment history. The purpose of this review was to detail the imaging appearance of 4 key diagnoses in posttreatment glioma surveillance: true progression, pseudoprogression, pseudoresponse, and radiation necrosis.
Conventional imaging: evolution of assessment criteria
Progression
Various assessment guidelines for tumor progression, primarily designed for the purpose of phase 2 clinical trials, have been used over the course of the past several decades. Changes over time reflect evolution in the approach to treatment and technological advances in imaging.
The Levin criteria was a numerical grading system introduced in 1977, and imaging features important to diagnosis included size of tumor, central lucency, degree of contrast enhancement, surrounding edema, and ventricle size. In 1990, the Macdonald criteria were published, relying heavily on maximal cross-sectional tumor measurements; these became the most widely used assessment guidelines for the ensuing 20 years. The 2-dimensional approach to lesion measurement of the Macdonald criteria was replaced with the application of unidimensional measurement in the Response Evaluation Criteria in Solid Tumors (RECIST) guidelines to gliomas, defining progression by at least a 20% increase in the sum of the diameters of all target lesions, with a maximum of 5 lesions targeted for measurement.
In 2010, the RANO (Response Assessment in Neurooncology) guidelines were introduced, and progression was defined based on imaging features as well as time from completion of chemoradiation (<12 weeks and >12 weeks); important factors in determining progression included enhancement outside of the radiation field, increase by 25% or greater in the sum of the products of perpendicular diameters between the first post-radiotherapy (RT) scan and the scan 12 weeks later, or clinical deterioration. The RANO guidelines additionally consider use of anti-angiogenics; increase in T2/fluid-attenuated inversion recovery (FLAIR) signal in nonenhancing lesions in such patients is indicative of disease progression. With the increased use of immunotherapy, the RANO in immunotherapy guidelines were introduced, which defined imaging criteria less than 6 months and more than 6 months after start of immunotherapy, given that there may be a latency period during which disease may actually worsen while the effective immune response evolves. Importantly, increase or decrease in steroid dose within 2 weeks of MR imaging assessment make disease progression nonevaluable according to the iRANO criteria. The modified RANO criteria were published in 2017 with increased focus on pseudoprogression, and with progressive disease determination based on at least 2 sequential studies, separated by 4 weeks, showing 25% or more increase in size; any new measurable lesion requires confirmation on a repeat study 4 weeks later, clear clinical deterioration, or lack of repeat evaluation due to deteriorating condition/death. The RANO criteria and subsequent modifications highlight the quandary behind many posttreatment glioma cases: both true disease progression and pseudoprogression can present with increased tumor enhancement. In fact, new enhancement seen within the radiation field within the first 12 weeks after treatment can never be definitively diagnosed as progression versus pseudoprogression based on the RANO guidelines.
The following sections cover both conventional and advanced imaging approaches to differentiating between these various entities.
Definition of pseudoprogression
Pseudoprogression is defined as radiographic evidence of disease progression, typically within 3 to 6 months posttreatment, followed by spontaneous resolution or improvement without additional treatment. Pseudoprogression may be accompanied by symptoms in 21% to 34% of patients with high-grade gliomas, but may be asymptomatic in patients with low-grade gliomas, particularly in the adult population. The pathophysiology of pseudoprogression is distinct from radiation necrosis, and likely relates to endothelial cell injury resulting in tissue inflammation and upregulation of VEGF leading to increased vessel permeability and edema, an effect potentiated by chemotherapy administration. In addition to high-grade gliomas, low-grade (World Health Organization [WHO] II) gliomas and WHO III (IDH mutant) gliomas also can demonstrate pseudoprogression. Studies have shown that ultimately, patients with pseudoprogression have better outcomes, presumably because pseudoprogression reflects an augmented response to treatment.
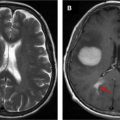
Early recognition of the concept of pseudoprogression in the setting of radiotherapy led to the suggestion that patients with radiological evidence of progressive disease within the first 3 months of treatment be excluded from phase 2 trials. It was subsequently learned that concurrent treatment with RT and chemotherapy potentiated the effects of radiation necrosis, leading to earlier manifestation of pseudoprogression after treatment initiation. Misinterpretation of pseudoprogression is problematic in terms of patient assignment to clinical trials, interpretation of trial results, guidance of decisions regarding reoperation, and in contributing to patient anxiety. Prospective identification of pseudoprogression can be radiologically and even histologically challenging, and inconsistency in the definition of pseudoprogression confounds comparison between studies. Figs. 1 and 2 illustrate examples of biopsy-proven progression and pseudoprogression, respectively.


Factors associated with pseudoprogression
Factors associated with pseudoprogression include cancer genotype and radiation dose. MGMT methylation is associated with increased probability of pseudoprogression and better outcomes. For instance, in a group of 157 patients with glioblastoma multiforme, IDH1 mutation, and MGMT methylation predicted a high probability of pseudoprogression, as well as improved overall survival. The incidence of pseudoprogression in patients with MGMT methylated tumor genetics was shown to be 91% compared with 41% in patients with the unmethylated promotor. IDH1 mutation was shown to have high specificity in the detection of pseudoprogression in a study of 32 patients with GBM treated with temozolomide and radiotherapy. Dose of radiotherapy also impacts likelihood of pseudoprogression and among patients with lower-grade glioma, proton therapy results in higher prevalence of pseudoprogression compared with photon therapy among patients with oligodendroglioma, but not astrocytoma, and pseudoprogression is associated with better progression-free survival. Therefore, these factors have important implications for the interpretation of posttreatment imaging, and the diagnostic accuracy of advanced imaging. Interestingly, age and size of the treated lesion were shown to be unrelated to likelihood of pseudoprogresssion. Prospective identification of pseudoprogression is a challenging exercise, and even use of both conventional and advanced imaging techniques may not consistently result in success.
Differentiating pseudoprogression from true progression
Immediate postsurgical imaging should take place within 48 hours postoperatively, in order to avoid postprocedural confounders such as enhancement associated with subacute ischemia. Subsequent follow-up imaging typically takes place after completion of chemoradiation, usually over the course of 6 weeks.
On conventional imaging, enhancement pattern and signal intensity on T2-weighted images are important factors in diagnosing tumor recurrence. Several studies have identified specific enhancement patterns that can aid in elaborating degree of suspicion of true tumor progression. Mullins and colleagues found that involvement of the corpus callosum was most predictive of progression, and that likelihood of tumor progression increased when callosal involvement was seen in combination with multiple enhancing lesions, crossing of the midline, and subependymal spread. Similarly, subependymal enhancement was shown to be predictive of true progression with 93.3% specificity in a retrospective study of 93 patients with GBM undergoing chemoradiation who developed new or increased enhancing mass lesions. However, no features on conventional imaging were found to have high negative predictive value for pseudoprogression. Subependymal enhancement, specifically at a distance from the primary enhancing lesion (>1 cm), was shown to be more common in true progression than pseudoprogression. Focal solid nodular enhancement and solid uniform enhancement with distinct margins was seen in 85% of patients with histopathologically proven tumor recurrence in a group of 51 patients who underwent reoperation after completing chemoradiation.
Increased T2/FLAIR signal is another important qualitative criterion for tumor progression, but can also be seen in the setting of pseudoprogression, secondary to tissue injury or laminar necrosis. However, enhancement in the absence of edema on T2-weighted images is suggestive of pseudoprogression. Signal change extending to cortex and mass effect are more suggestive of tumor progression than pseudoprogression. Increased FLAIR volume and extension beyond the radiation field are also clues to true progression as compared with pseudoprogression. In fact, a postmortem analysis demonstrated that T2-weighted images were most representative of tumor extent compared with postcontrast T1-weighted images when correlated with histopathologic specimens.
Despite heavy reliance on conventional imaging for progression guidelines and attention to subtleties in postcontrast T1 and FLAIR appearance, the sensitivity and specificity of anatomic MR imaging for detection of progression is low. In a recent meta-analysis of 5 studies, including 166 patients, the pooled sensitivity and specificity for anatomic MR imaging was 68% (95% confidence interval [CI] 51–81) and 77% (45–93), respectively, with better performance calculated for advanced imaging techniques (diffusion-weighted imaging [DWI], perfusion-weighted imaging [PWI], and magnetic resonance spectroscopy [MRS]). Ultimately, multimodal assessment might be most productive in differentiating progression from pseudoprogression.
Magnetic resonance perfusion
Perfusion-Weighted Imaging
Three methods are used for PWI, 2 of which rely on the injection of an extrinsic contrast medium (dynamic susceptibility contrast [DSC] and dynamic contrast enhancement [DCE]), and 1 that uses blood as an intrinsic contrast medium (arterial spin labeling [ASL]). In a recent survey conducted by the American Society of Neuroradiology, 151 of 195 institutions endorsed offering perfusion MR imaging and 87% included perfusion as part of the standard brain tumor protocol, with percentage increase to 96% in the evaluation of pseudoprogression ; this compared with 48% of a total of 220 health centers across 31 European countries according to a European Society of Neuroradiology survey. DSC was more commonly used than DCE and ASL; and only half of the institutions endorsed quantitative analysis. DSC perfusion, evaluated in 18 studies including 708 patients, had a sensitivity of 87% (82–91) with a specificity of 86% (77–91). DCE-perfusion evaluated in 5 studies including 207 patients had a sensitivity of 92% (73–98) and specificity of 85% (76–92).
Dynamic Susceptibility Contrast
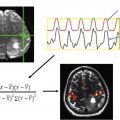
DSC is the most widely used technique for PWI ; in a study comparing all 3 perfusion methods, DSC was found to have the best diagnostic performance. DSC relies on T2 and T2∗ signal changes related to the passage of a paramagnetic contrast agent, and aims at characterizing the hemodynamic properties of the central nervous system microvasculature. A loss of signal versus time curve for every voxel is generated, from which several functional maps are derived. Cerebral blood volume (CBV) is the most commonly used parameter, defined as milliliters of blood per 100 g of brain tissue, and is usually discussed relative to the contralesional brain tissue; this parameter is a surrogate marker for capillary density/neoangiogenesis. Cerebral blood flow (CBF) is the amount of blood in a given volume of tissue per time (mL of blood/100 g brain tissue/min), and is interpreted as the microvascular blood flow in a given region of interest. Mean transit time (MTT) is calculated by dividing CBV by CBF (MTT = CBV/CBF), and is defined as the amount of time it takes for the injected contrast to travel through a defined region or volume of interest. Finally, time to peak is defined as the amount of time it takes for contrast to achieve peak concentration.
Advantages of DSC include its relatively quick and facile execution; limitations include user-dependent calculation of absolute parameter measures and sensitivity to susceptibility-related artifact, particularly at the skull base or in the presence of postoperative hemosiderin deposition. Regional CBV (rCBV) measurements may differ in diagnostic accuracy based on the use of contrast preloading and baseline subtraction techniques. Choice of software package has been shown to bear clinically significant differences in CBV.
In high-grade gliomas, tumor growth leads to neovascularity, increased microvascular density, and slower flow in collateral vasculature, which translates into elevated CBV. Multiple studies examining DSC-MR in the setting of posttreatment glioma demonstrate elevated rCBV in the setting of tumor progression. Although a recent survey indicated that approximately 50% of surveyed institutions do not process quantitative parameter maps, published studies show that inspection of color maps in the absence of parameter computation does not reliably differentiate progression from psuedoprogression. The challenge in a quantitative approach to DSC-MR is the lack of universal threshold, limiting reproducibility. This is underscored by the wide range of thresholds values for rCBV reported in the literature. For instance, Hu and colleagues demonstrated that an rCBV cutoff value of 0.71 predicted true progression from pseudoprogression with 95.9% accuracy; however, the reported range of rCBV thresholds in the literature range from 0.9 to 2.15 for mean rCBV and 1.49 to 3.10 for maximum rCBV. Interestingly, in a meta-analysis examining the utility of DSC perfusion in differentiating progression from pseudoprogression, Wang and colleagues found that differences in threshold values had only a mild effect on individual study accuracy. Other approaches to parameter analysis include rCBV histogram skewness and kurtosis, tumor fractional volume, parametric response mapping, and evaluation of trends over time rather than static computations.
Dynamic Contrast Enhancement
DCE is a T1-weighted sequence that usually uses spoiled gradient echo technique, requiring longer acquisition time compared with DSC. Longer acquisition times, ranging from 6 to 10 minutes, are required to characterize the permeability of the blood brain barrier and its relationship to the extracellular extravascular space. Concentration time curves are generated, from which several parameters can be calculated, including Ktrans, the rate of transfer between plasma and extravascular tissue; Kep, the rate of transfer between extravascular tissue and plasma; Ve, the extracellular volume; and Vp, the plasma volume. Advantages of DCE include the increased information gained regarding microvascular permeability and blood brain barrier, as well as the technique’s decreased sensitivity to susceptibility-related artifact. Disadvantages include the longer scan time, decreased temporal resolution, and differences of opinion regarding ideal pharmacokinetic modeling, which limit comparisons across sites. Compared with DSC, DCE has more limited temporal resolution but improved spatial resolution, and is therefore preferable for lesions with mixed pathology.
The diagnostic accuracy for DCE was shown to be similar to DSC in a meta-analysis performed by van Djiken and colleagues. The expectation, confirmed by several retrospective and prospective studies, is that Ktrans and Vp are higher in the setting of true progression compared with pseudoprogression and radiation necrosis. Semiquantitative methods using area under the curve (AUC) also have been applied successfully in the evaluation of progression versus pseudoprogression. In a retrospective study of 37 patients with GBM and new/increasing enhancement after treatment, Thomas and colleagues determined that Vp (mean) cutoff less than 3.7 yielded 85% sensitivity and 79% specificity for pseudoprogression and Ktrans (mean) of greater than 3.6 had a 69% sensitivity and 79% specificity for disease progression; however, as with DSC, universal thresholds have not been established.
Arterial Spin Labeling
ASL is a technique that uses a series of short radiofrequency pulses to label endogenous protons in arterial blood. CBF is calculated based on the difference in signal between baseline images and the magnetically labeled images, and can be applied using a pseudocontinuous or pulsed technique. Labeling time is approximately 2 to 4 seconds, followed by a 1.5-second to 2.0-second delay, after which signal is acquired by using fast spin echo or gradient echo technique. The calculated parameter of interest is CBF, which has been shown to correlate well with rCBV generated using DCE technique, but, unlike DCE, leakage correction is not required. Because of the intrinsically low signal to noise, ASL scan times are longer and therefore prone to motion artifact. Moreover, complexity of ASL flow calculations make ASL a less popular perfusion technique. Studies have demonstrated the utility of ASL as both an independent perfusion method and as an adjunct to other perfusion methods such as DSC in differentiating between progression and pseudoprogression; however, this method is less frequently used for reasons discussed previously.
Diffusion
Diffusion-Weighted Imaging
DWI is an MR imaging technique sensitive to the molecular motion of water through the addition of 2 identical diffusion gradients, one on each side of a 180° refocusing pulse ; increased cellularity in the setting of high-grade glioma confers high microscopic tissue organization, and is detected as reduced diffusion. Apparent diffusion coefficient (ADC), a measure of water diffusivity, has therefore been used in the differentiation of tumor progression from pseudoprogression.
DWI can be used as both a qualitative and quantitative imaging tool in differentiating progression from pseudoprogression. For instance, on the basis of visual inspection alone, Lee and colleagues found that in a group of 22 patients with GBM treated with chemoradiation, the progression group showed a higher incidence of homogeneous or multifocal high signal intensity on diffusion-weighted images, whereas only peripheral hyperintensity or no high signal intensity was more frequently observed in the pseudoprogression group. Using a quantitative approach, multiple studies have shown that mean ADC values are lower in patients with true progression as compared with pseudoprogression ; relative similarity in thresholds has been demonstrated between studies. ADC values are particularly useful in the setting of nonenhancing T2/FLAIR hyperintensity, as low ADC values have been shown to precede the appearance of enhancing, viable tumor by a median of 3 months in patients undergoing treatment for GBM. In addition to qualitative diffusion features and mean ADC values, cumulative ADC histogram analysis has been shown to aid in the differentiation of true progression from pseudoprogression, as have voxel-wise approaches using parametric response maps and functional diffusion maps.
Diffusion Tensor Imaging
Diffusion tensor imaging (DTI) is an MR imaging technique that is sensitive to not only the degree but the direction of water diffusion. The technique applies at least 6 noncollinear directions of diffusion sensitization; the number of diffusion sensitizing directions can vary from 6 to 256. Multiple quantitative parameters can be calculated, including fractional anisotropy (FA), which is a summary measure reflecting the overall directional coherence of water.
Studies using DTI in posttreatment monitoring show mixed interpretation of diffusion parameters. Although one might expect higher FA in areas of true tumor progression compared with pseudoprogression, ostensibly due to increased cellularity and therefore tissue organization expected in high-grade glioma, the limited number of studies applying DTI in the setting of treatment response have shown inconsistent results, with studies showing no difference in FA, higher FA, and lower FA values in true progression compared with pseudoprogression.
Magnetic Resonance Spectroscopy
MRS is a technique that identifies and quantifies particular metabolites in a lesion of interest. MRS can be performed using multi-voxel or single-voxel techniques, to generate a plot of signal to frequency, expressed in parts per million. Clinically relevant metabolites include N-acetylaspartate (NAA), a marker of neuronal viability; total choline (tCho), a marker of cell membrane turnover/cellular proliferation; total creatine (tCr), an energy metabolite; lactate, a product of anaerobic glycolytic metabolism; and lipid (triglycerides), a marker of necrosis. Given its stable concentration, creatine is used as the reference for report of the metabolites of interest, and typically high-grade gliomas are characterized by elevation of tCho and decrease in NAA.
Limitations of MRS are multiple. Single-voxel approaches are prone to partial volume effects, and there is limited ability to detect smaller lesions. Because of low metabolite concentrations, multiple acquisitions are required necessitating long scan times and, finally, there is the technical onus of eliminating contamination from adjacent tissues, such as scalp and ventricle. Nevertheless, in a pooled meta-analysis of 9 studies including 203 patients, van Dijken and colleagues found that MRS had the highest accuracy in response evaluation compared with conventional MR imaging, DWI, and perfusion MR imaging, with sensitivity of spectroscopy reported at 91% (79–97) and specificity reported at 95% (65–99).
MRS is a useful tool in determining progression from pseudoprogression. In a longitudinal study, Sawlani and colleagues used single-voxel MRS to show elevation of lipid peaks and decrease in tCho/NAA ratios in patients with pseudoprogression, whereas elevated Cho and elevated tCho/NAA ratio were seen in patients with true progression. In a prospective study of 24 patients with GBM, significant differences in MRS data were recorded for patients with progression and pseudoprogression, with ideal institutional recurrence thresholds established as tNAA ≤1.5 mM, tCho/tNAA ≥1.4 (sensitivity 100%, specificity 91.7%), tNAA/Cr ≤0.7 ; the investigators subsequently validated these thresholds, and concluded that GBM relapse was characterized by the tCho/tNAA ratio ≥1.3 with sensitivity of 100% and specificity of 94.7% ( P <.001). However, some studies have shown that Cho and NAA are increased in both progression and pseudoprogression, particularly in the early post-radiation time point. Recently, 2-hydroxyglutarate was noted to accumulate in tumors with the IDH mutation, and this metabolite can be used to monitor response to treatment in IDH-mutated gliomas.
PET with Fludeoxyglucose
The most widely used PET tracer is, 2-(18F) fluoro-2-deoxy- d -glucose (FDG), a glucose analog incorporated into glycolytic metabolism; FDG-PET is used to monitor treatment response in glioblastoma. Standardized uptake values represent the ratio of radiotracer activity in tissue relative to the injected dose per kilogram of body weight. Limitations to FDG-PET include physiologic uptake in normal brain parenchyma, constraining evaluation of small lesions, in addition to the observation that some high-grade gliomas may have decreased FDG uptake, creating a confusing clinical picture.
A meta-analysis of 18F-FDG-PET utility in detecting recurrence in glioma revealed pooled sensitivity of 0.77 (95% CI, 0.66–0.85) and specificity of 0.78 (95% CI, 0.54–0.91). A wide range of standardized uptake value (SUV) cutoff values for detection of glioma recurrence are reported in the literature, ranging from 1.3 to 1.5 relative to normal white matter, 0.5 to 1.05 relative to normal gray matter, and 1.3 to 1.35 for a mirror-image location as a reference, with equally varying degrees of sensitivity and specificity.
The utility of radiolabeled amino acid PET tracers in the posttreatment setting has also been explored. 11C–MET PET/MR imaging has been shown to have greater sensitivity, specificity and AUC compared with FDG-PET and compared with MR imaging alone. However, 11C-MET has a short half-life and therefore requires an on-site cyclotron, limiting its practical use. O-(2–18FFluoroethyl)- l -tyrosine (18F-FET) has a longer half-life than 11C-MET, and has been similarly applied in treatment monitoring. Disadvantages of 18F-FET include slower renal elimination, resulting in increased residual tracer in the blood pool and, therefore, nonspecific tracer uptake.
Pseudoprogression in immunotherapy
In the setting of immunotherapy, increase in size of a treated lesion may reflect a localized inflammatory response induced by immunotherapy and apparent new, enhancing lesions may represent immune response in previously infiltrative, nonenhancing disease. Delayed response and/or a “flare phenomenon” may occur, and a number of studies have been performed to explore the associated perfusion and diffusion changes. Application of MRS to treatment response in immunotherapy also has been explored, and has been shown to aid in identification of pseudoprogression in the setting of new lesion enhancement. Because lipid is a substrate of natural killer T cells, a lipid peak on MRS may be seen in the setting of immunotherapy response. The application of FDG-PET and ASL have been less well-explored, and remain important potential avenues for future research efforts.
Pseudoresponse
Whereas pseudoprogression typically occurs in the setting of administration of radiation and an alkylating agent, pseudoresponse occurs in the setting of antiangiogenic therapy. Glioblastoma is a highly vascular tumor that depends on angiogenesis for growth, with upregulation of several proangiogenic factors, including VEGF, hepatocyte growth factor, fibroblast growth factor, platelet-derived growth factor, angiopoietins, and IL-8, resulting in disorganized vasculature with abnormalities in endothelial wall, pericyte coverage, and basement membrane. Bevacizumab is a humanized monoclonal antibody that targets and binds VEGF-A, a highly expressed proangiogenic factor in brain tumors. By targeting VEGF, normalization of tumor vasculature occurs with decrease in vessel size and permeability. This alteration in vasculature is believed to improve delivery of chemotherapy and/or radiation therapy.
Imaging findings after anti-VEGF therapy include decreased contrast enhancement, edema, and permeability as early as 1 day after initiation of therapy. Radiologic response rates are high, ranging from 25% to 60%. Despite remarkable imaging response following bevacizumab administration, there has been no proven substantial benefit in overall survival. Bevacizumab, however, has been shown to improve progression-free survival with decreased patient dependence on steroid treatment. A large fraction of patients who initially demonstrate radiographic response eventually develop progressive disease in the form of worsening, nonenhancing T2 signal hyperintensity on T2 FLAIR sequences. Although presence of increased T2 FLAIR signal in nonenhancing tumor during antiangiogenic therapy has been shown to be associated with a higher risk of death, the usage of T2 FLAIR monitoring has been controversial given variability in interpretation.
Several imaging methods have been investigated to distinguish true response from pseudoresponse in the setting of antiangiogenic therapy. The utility of perfusion imaging has been explored with equivocal results. Stadlbauer and colleagues pointed out the limitation of DSC perfusion, because both normal brain parenchyma and tumor exhibit decreased perfusion following bevacizumab administration. Other studies have demonstrated the utility of DSC perfusion in detecting decrease in permeability following antiangiogenic therapy, which correlated with overall survival or progression-free survival.
Although ADC value is helpful in differentiating true progression from pseudoprogression, ADC values may be of limited usefulness in evaluating pseudoresponse. A recent study of ADC values in patients on bevacizumab demonstrated normalization of ADC values following initiation of treatment that persisted even when progressive disease was reported. However, preantiangiogenic treatment ADC values at a threshold of greater than 1.24 μm 2 /ms have been shown to predict improved overall survival in patients with recurrent glioblastoma.
More recently, amino acid PET has shown promising ability to improve identification of viable tumor by detecting the tumor’s demand for carbon. A case report cited the ability of radiolabeled amino acid 18F-FET PET to detect progressive tumors earlier in patients treated with bevacizumab. Another study, investigating the use of radiolabeled 3,4-dihydroxy-6-[18F]-fluoro- l -phenylalanine (18F-FDOPA) PET found that metabolic tumor volumes were predictive of treatment response and overall survival as early as 2 weeks following the initiation of bevacizumab. Fig. 3 illustrates the temporal progression of imaging findings of a glioblastoma treated with bevacizumab after tumor progression.