During the past decade, functional MR imaging has rapidly moved from the research environment into clinical practice. Preoperative functional MR imaging is now standard clinical practice not only in major academic institutions, but also in community neurosurgical and neuroradiologic practices. The clinical use of functional MR imaging will only increase in the years to come. Application of functional MR imaging (including resting-state functional MR imaging) to the context of neuropsychiatric diseases is likely to continue to advance.
Key points
- •
Functional MR imaging is an outstanding clinical test that has already moved into routine clinical practice.
- •
To optimize functional MR imaging results, the person administering the functional MR imaging must ensure that the patient performs the paradigm correctly.
- •
It is important to understand the pitfalls of functional MR imaging, including susceptibility artifacts, the significance of the P value, and the effect of neovasculature.
- •
To correctly interpret functional MR imaging studies, one must understand the physics of MR imaging, appreciate each patient’s neuroanatomy, and look for evidence of cortical reorganization.
Introduction
In the past decade, functional MR imaging (fMR imaging) has rapidly moved from the research environment into clinical practice. Preoperative fMR imaging is now standard clinical practice not only in major academic institutions but also in community neurosurgical and neuroradiologic practices. Functional MR imaging has been endorsed by the American Academy of Neurology. So far, the most common clinical application of fMR imaging has been in preoperative planning for patients with brain tumors or seizures.
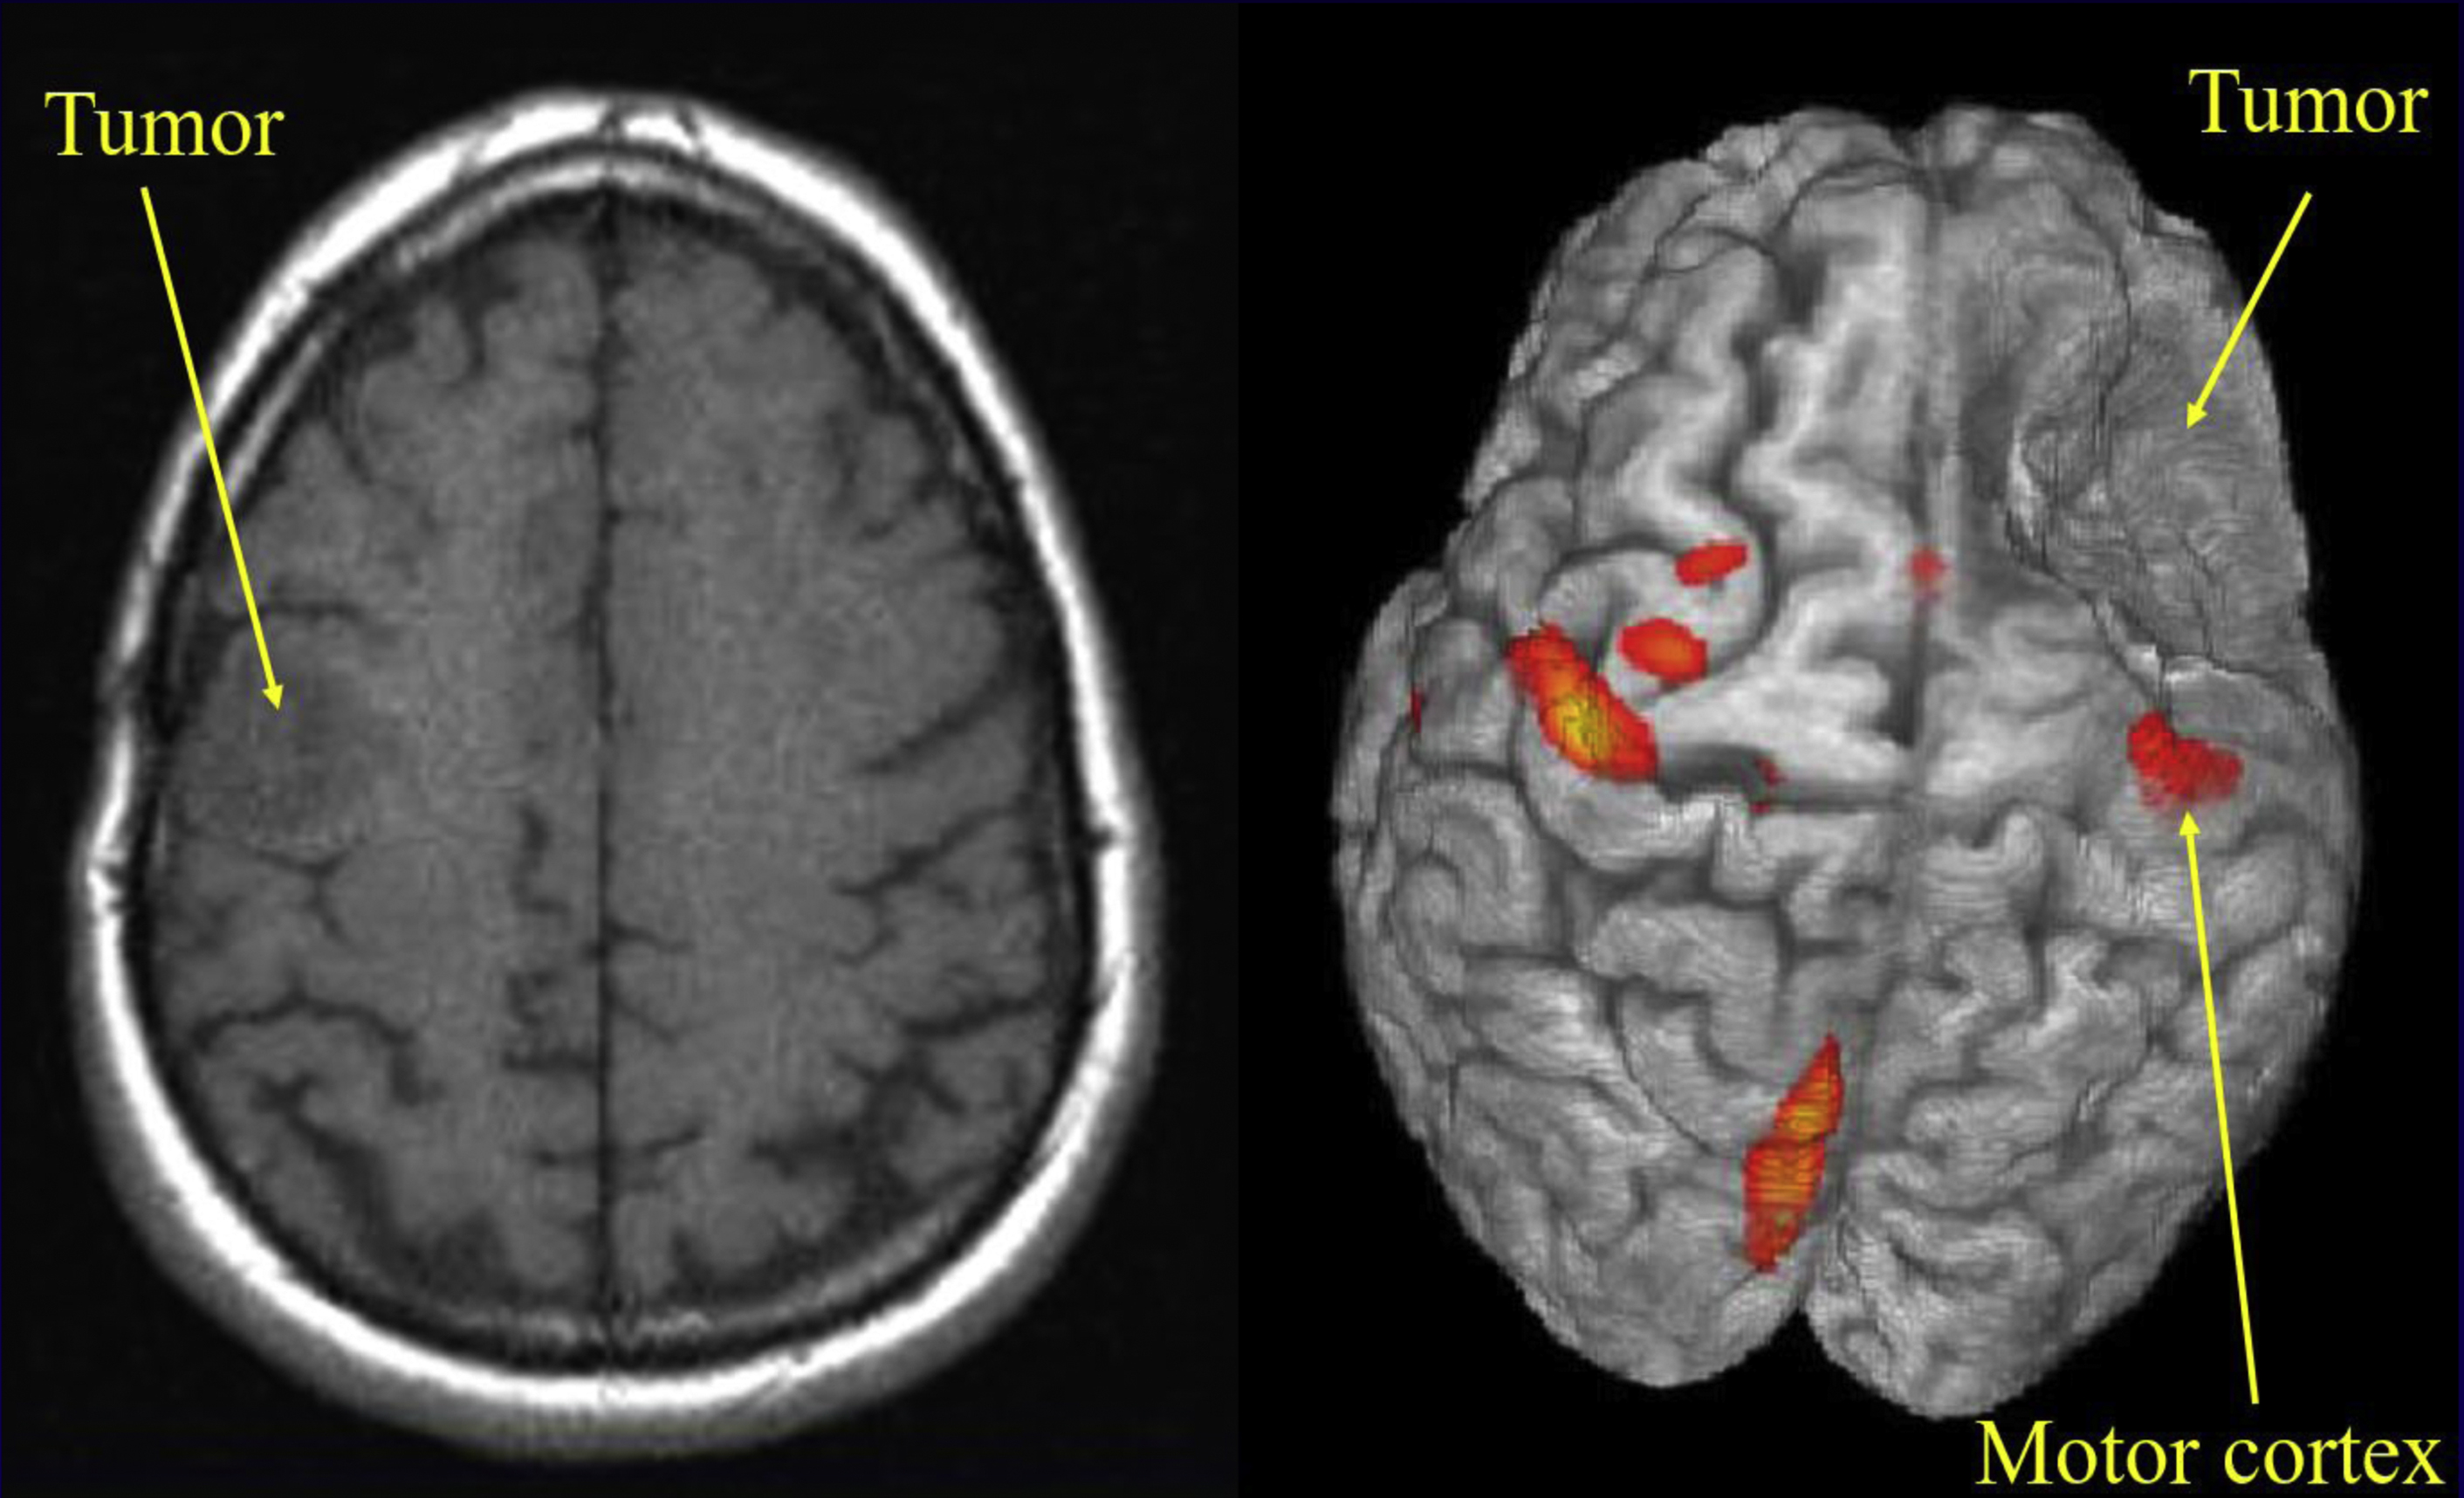
In brain tumor surgery, the neurosurgeon aims to maximize resection of the brain tumor while avoiding resection of eloquent cortices, which could lead to loss of essential functions such as language and movement. In this setting, the neurologic functions of most concern to the neurosurgeon are the motor and speech functions. fMR imaging is a useful tool to identify the eloquent cortices preoperatively (and, with the use of neurosurgical navigational systems, intraoperatively). Three-dimensional visualization of the anatomic relationship of the tumor to adjacent eloquent cortices makes preoperative planning and the resection of the brain tumor more manageable for the neurosurgical team.
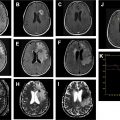
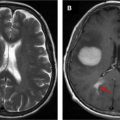
If you were a neurosurgeon, which image presented in Fig. 1 would you prefer to use in preoperative planning? Would you prefer the left image (radiologic right), in which a probable low-grade tumor seems to be situated somewhere at the frontoparietal junction (does it involve the motor cortex?), or the right image (radiologic left), in which the relationship of the tumor to the cortex is clearly visible? Let us consider how useful images such as the right image are obtained.
What is functional MR imaging?
Functional MR imaging is a brain mapping technique that allows clinicians to identify eloquent cortex on anatomic MR images. Eloquent cortex is defined as an area of gray matter essential for the performance of functions such as sensation, movement, speech, vision, and higher cortical functions, including memory. Functional MR imaging provides a closer look at the brain, but determines precisely (well, nearly precisely) which part of the brain handles each function.
Functional MR imaging visualizes and measures the quick and small metabolic changes that take place in an active part of the brain. Signal intensity changes occur in each voxel of the brain over time as patients perform specific tasks (fMR imaging paradigms).
How are functional MR imaging data acquired?
If you can’t explain it to a six-year-old, you don’t understand it well enough. —Albert Einstein
Functional MR imaging was first described by Seiji Ogawa in 1990. He called his technique blood oxygen level dependent (BOLD) fMR imaging because it uses oxyhemoglobin and deoxyhemoglobin in the blood vessels as an endogenous contrast agent to generate functional activation maps.
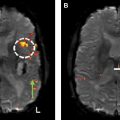
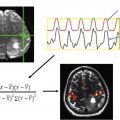
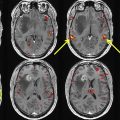
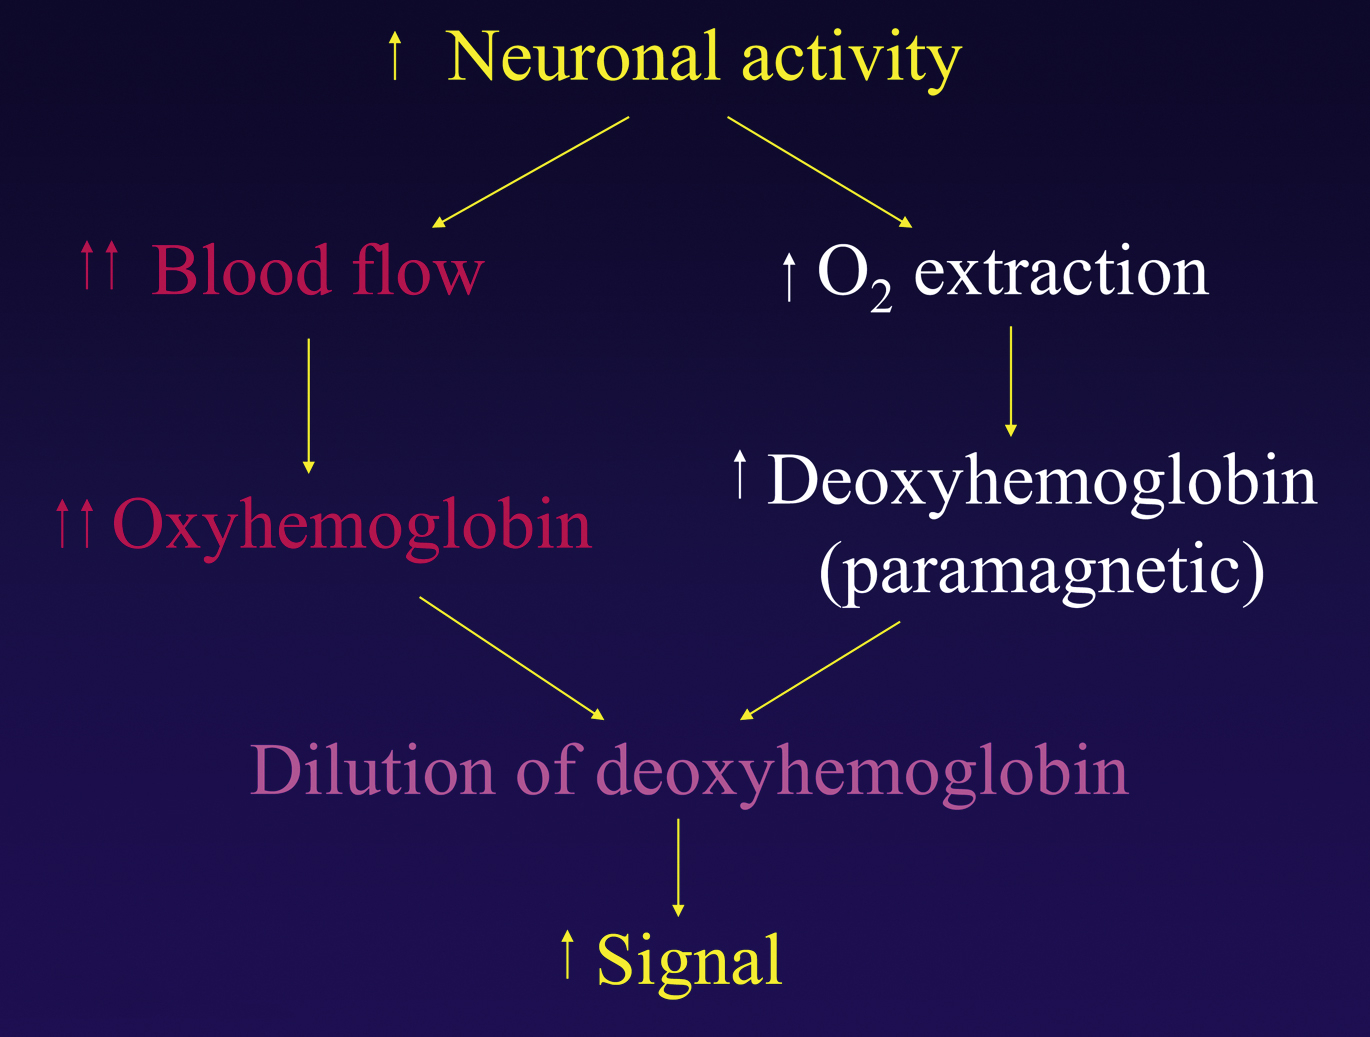
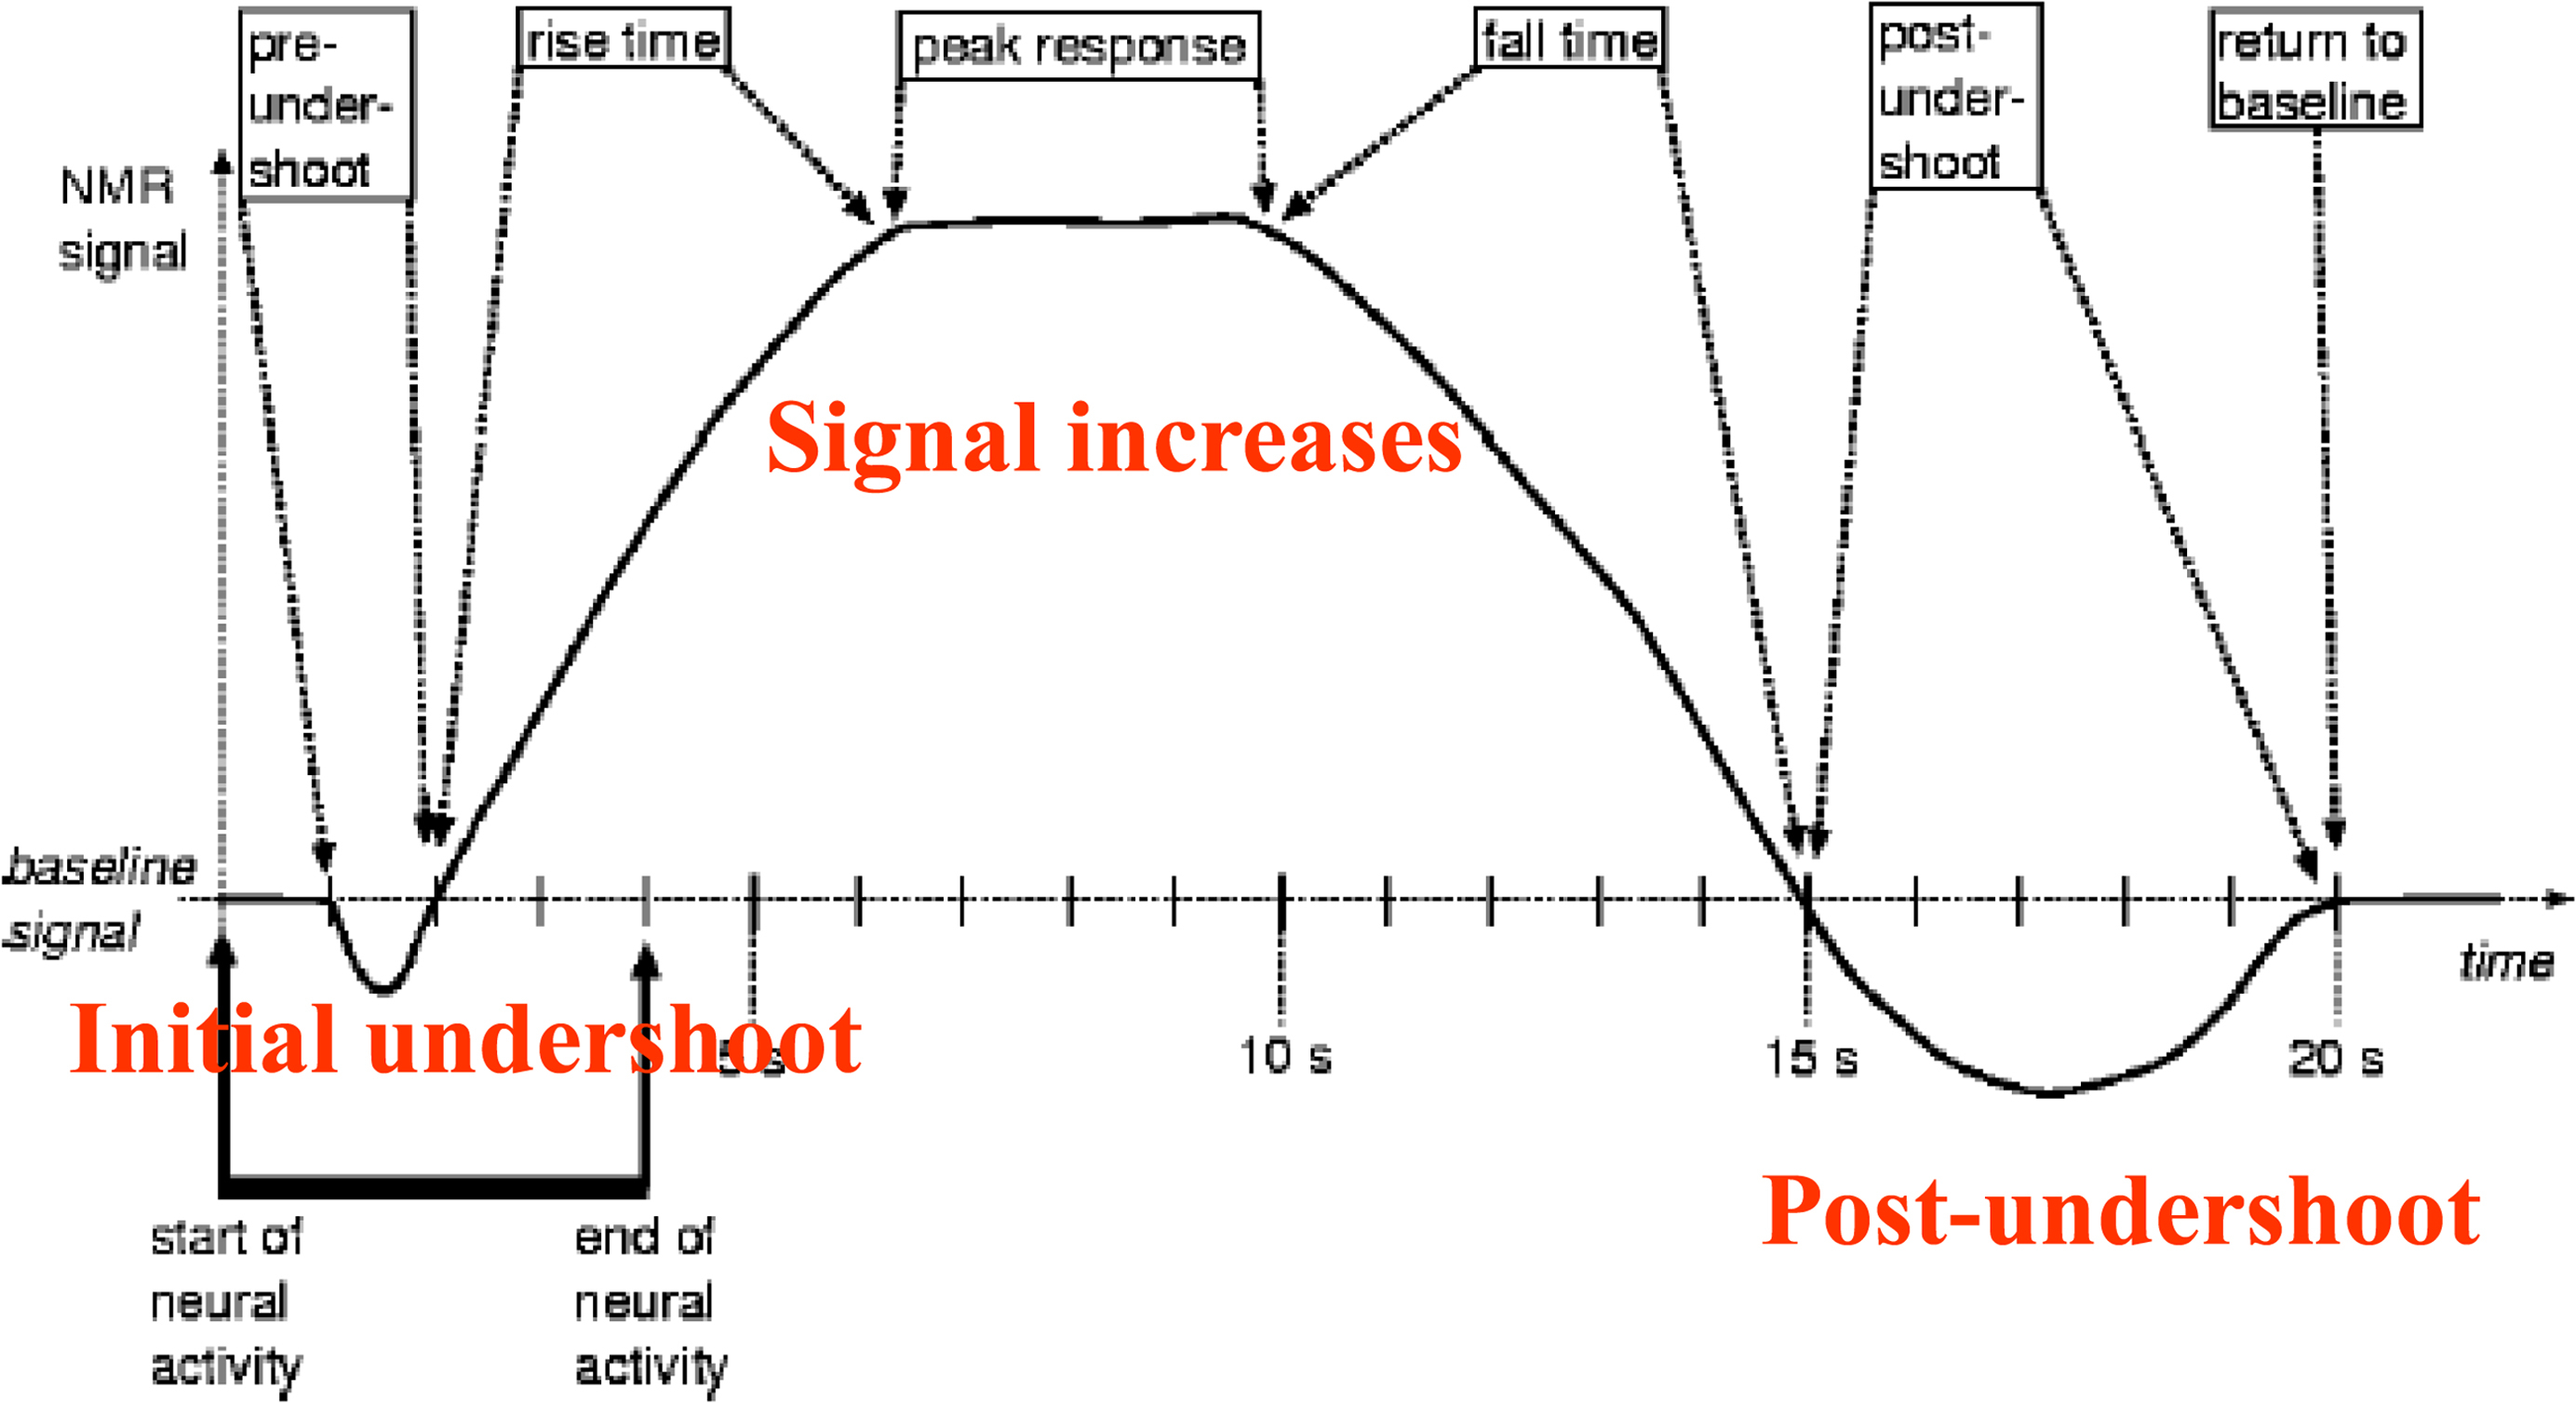
BOLD fMR imaging is based on the following principle: an increase in neuronal activity causes an increase in local oxygen extraction from the blood because of an increase in the cerebral metabolic rate of oxygen. This increase leads to an increase in paramagnetic deoxyhemoglobin, which lowers the signal intensity. However, after several seconds, neuronal activity also causes an increase in cerebral blood flow and cerebral blood volume, which leads to an increase in the flow of oxygenated blood and an increase in oxyhemoglobin. For yet unknown reasons, the amount of oxygenated blood that arrives to support the active neurons far exceeds the metabolic need. This overcompensation of oxyhemoglobin leads to a decrease in the ratio of deoxyhemoglobin to oxyhemoglobin, which is measurable and is the basis for BOLD fMR imaging signal ( Figs. 2 and 3 ).
Following the advice of professor Einstein, we can also offer the flowing explanation in case, dear reader, you might have the need to explain what you do to nonscientists, perhaps curious children or grandchildren (with perfuse apologies to the physicists among the readership). We all know that different parts of the brain control different functions. When a part of brain starts “working”—for example, the part of the brain that controls the movement of the fingers when I move my right hand—more blood flows to that area of the brain. Everyone knows that when they run, more blood flows to their legs. Blood contains red blood cells, red blood cells contain hemoglobin, hemoglobin contains iron, and iron is a little magnet—everyone knows this. Hence, when a part of the brain starts working harder, more “small magnets” flow to this area, which can be seen by the “magnetic” resonance scanner (MR imaging). And we have just explained the very complicated process of fMR imaging in a very understandable way!
The basic scheme for acquiring fMR imaging data and incorporating it into brain surgical practice is depicted in Box 1 .
- 1.
Functional MR imaging data
- 2.
High resolution (T1+Gd, fluid attenuation inversion recovery, etc)
- 3.
Analyze fMR imaging data offline
- 4.
Co-register fMR imaging data with T1 data
- 5.
Load onto neurosurgical computer
How does functional MR imaging acquisition differ from anatomic MR imaging acquisition?
During the acquisition of routine brain scans, we assume that the signal intensity in each voxel does not change over time. In contrast, the basis of fMR imaging is that the signal intensity changes over the time of the acquisition as the patient performs a certain task (or paradigm).
Anatomic MR imaging sequences typically take 3 to 4 minutes to acquire, whereas fMR imaging scans the whole brain very quickly (typically 1–4 seconds) multiple times during the acquisition to capture the signal intensity changes over short periods of time. The long acquisition time of anatomic MR imaging enables the acquisition of high-resolution images with a matrix of 256 × 256 or higher; fMR imaging images are typically acquired using a 64 × 64 matrix.
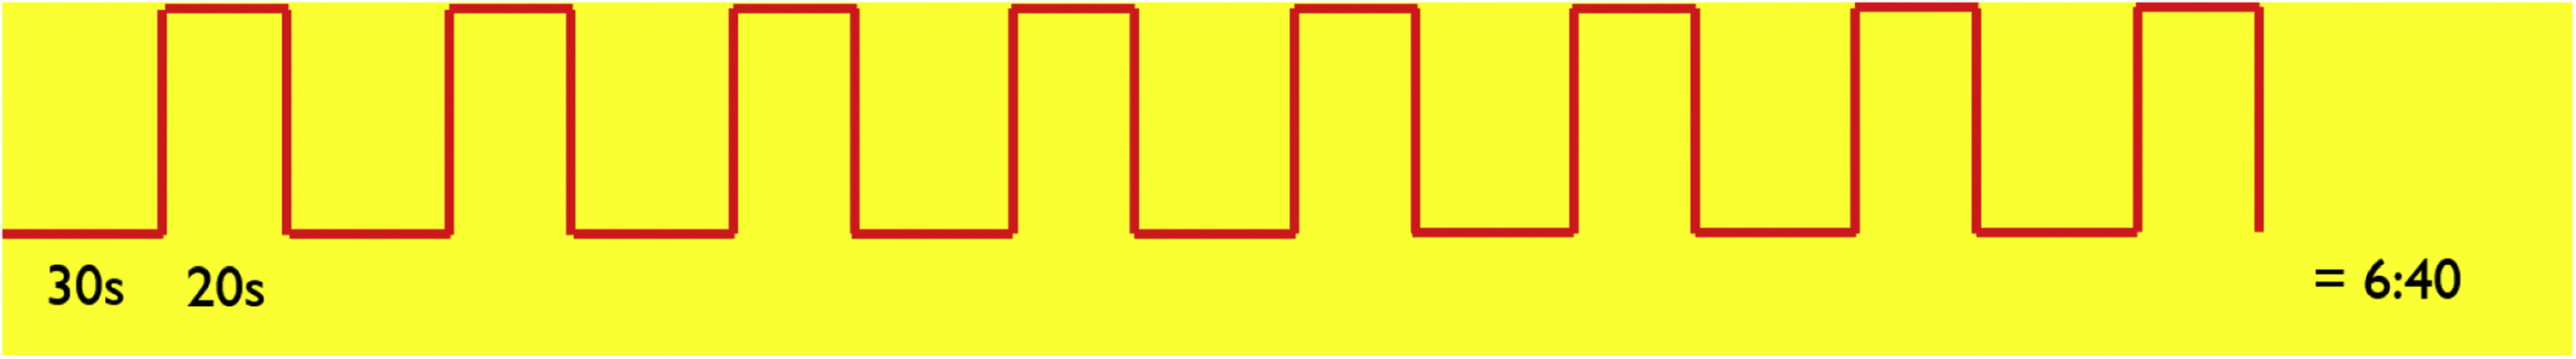
The simplest fMR imaging paradigm is known as a “boxcar paradigm,” during which the patient performs a task and then rests. This “on” (task period) and “off” (rest period) sequence is repeated a number of times ( Fig. 4 ).
How are functional MR imaging data analyzed?
After data acquisition, the next step is to produce an fMR imaging map. To do so, one must analyze which voxels are “active” based on the paradigm administered during fMR imaging acquisition. Voxels that are active during the stimulus period and inactive during the rest period are likely being used to perform the task.
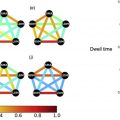
From the fMR imaging data, a signal intensity curve is generated over time for each voxel in the brain. This signal intensity–time curve is then compared with the stimulus to determine if there is a correlation between the two. There are many different statistical ways to determine the correlation, which range from simple to very complex. A commonly used method is to determine if there is a correlation between the signal change in a specific voxel and the timing of the paradigm. (For more on methods of analysis, please see Peck and colleagues’ article, “ Methods of Analysis: Functional MR imaging for Pre-surgical Planning ,” in this issue.)
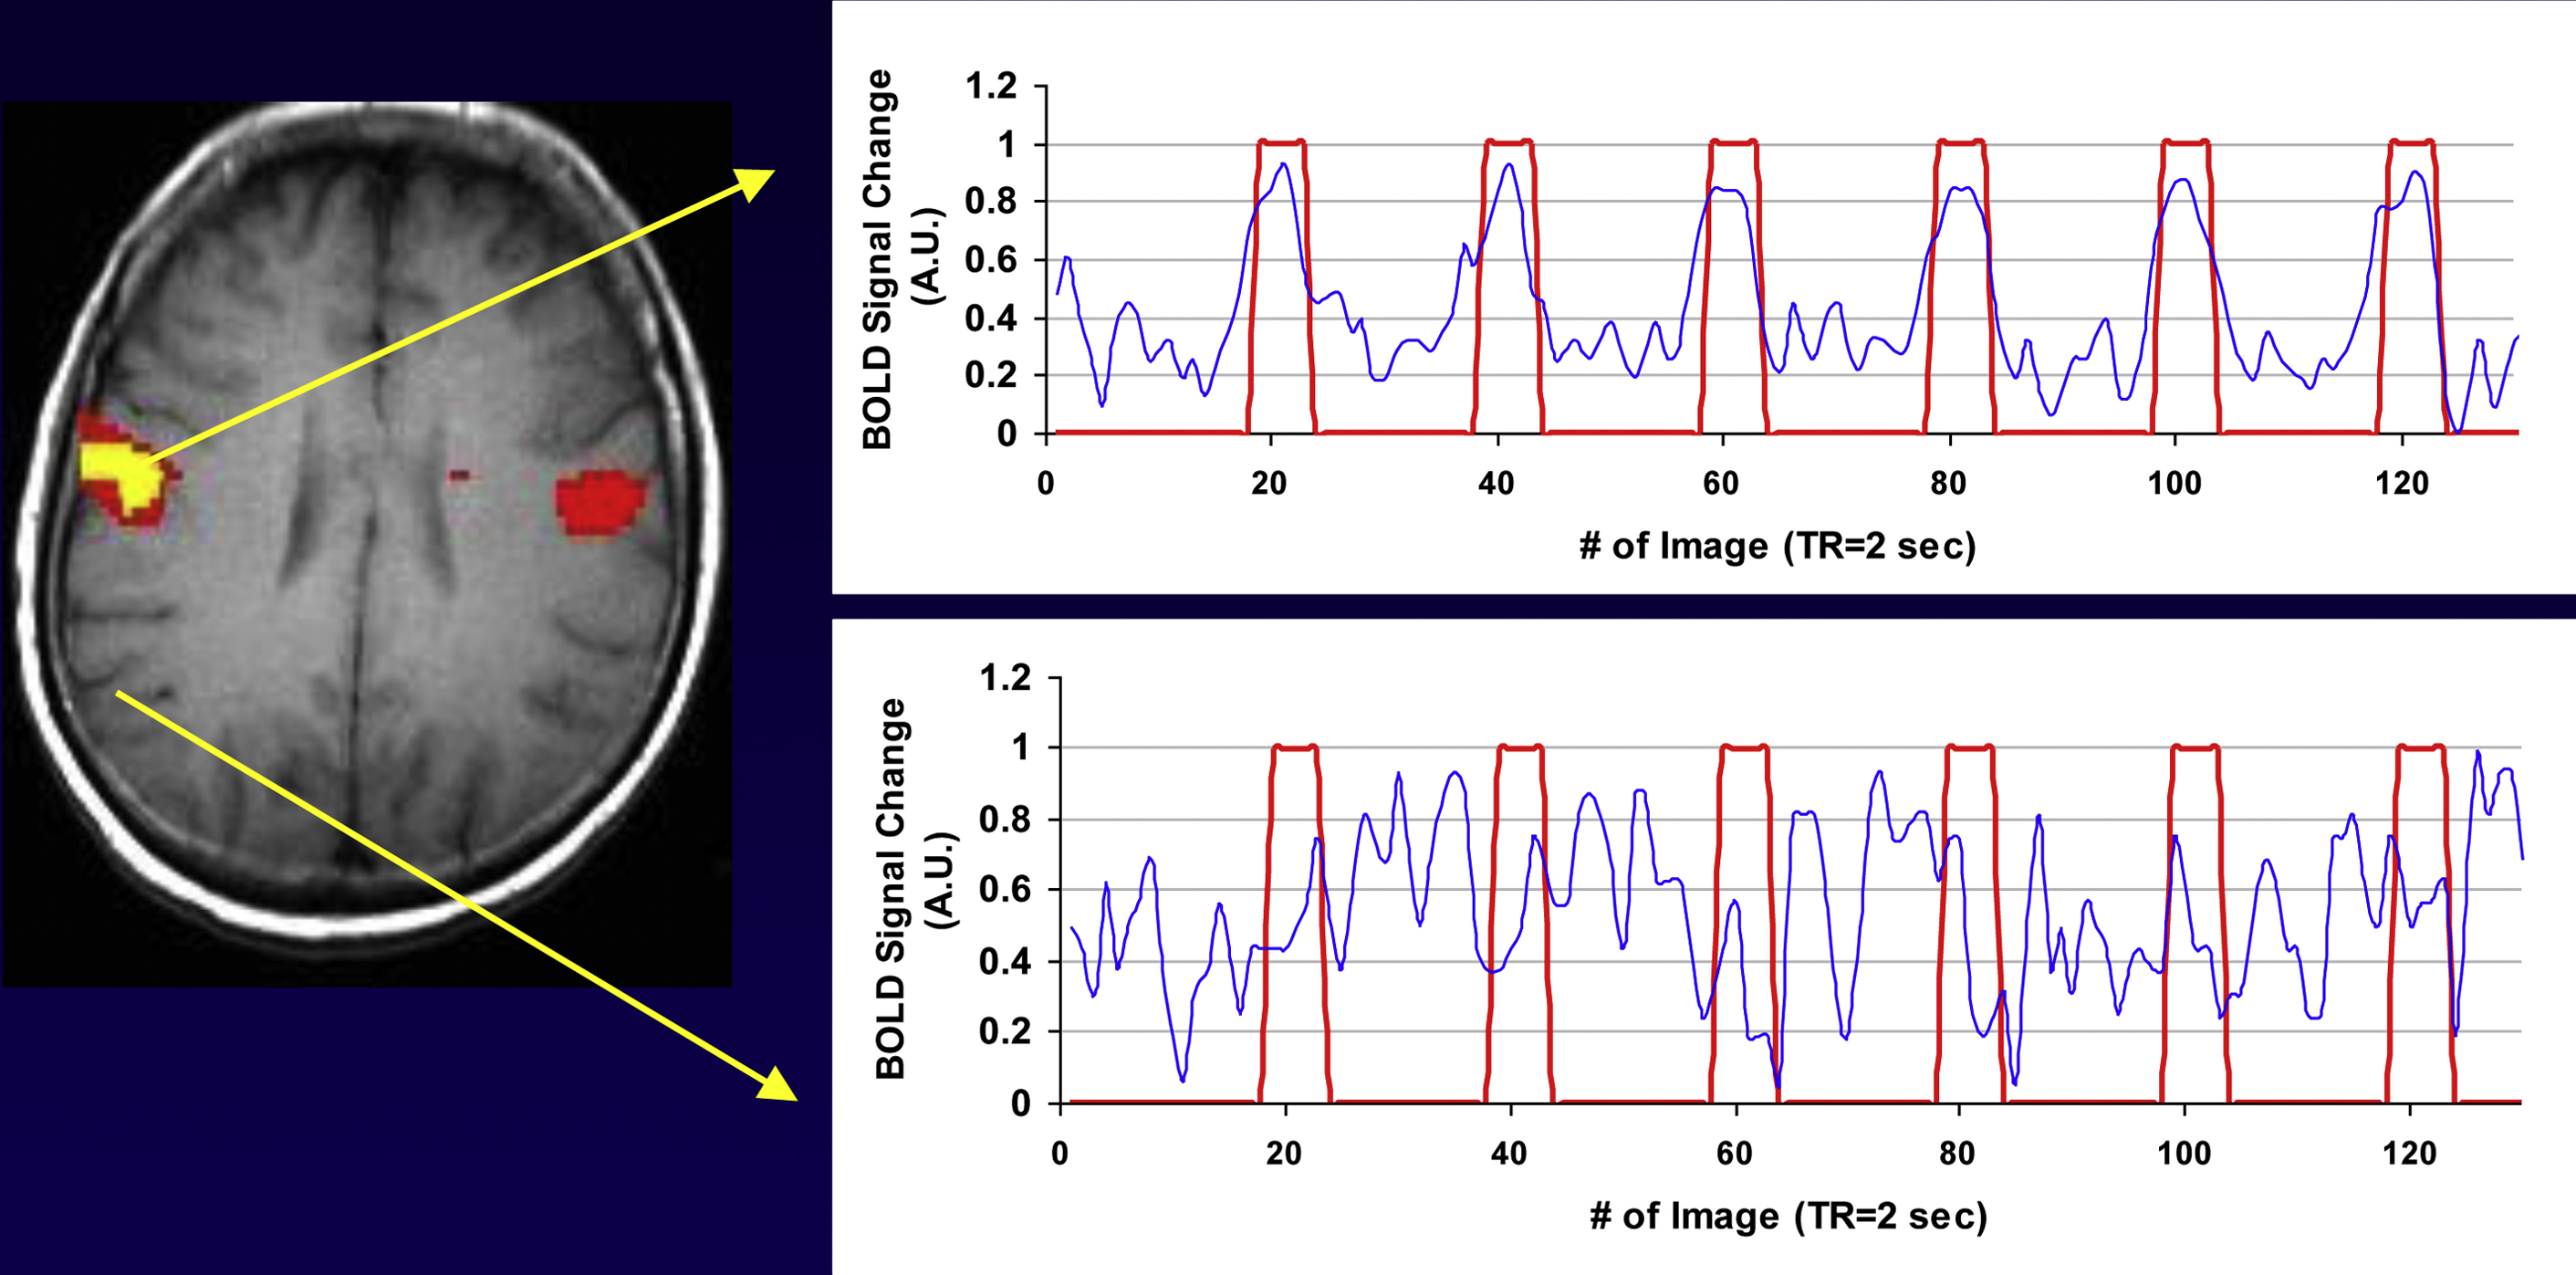
If a signal correlates significantly with the paradigm for a specific voxel, that voxel is considered active. Fig. 4 presents a patient who was asked as part of his fMR imaging paradigm to alternate moving his tongue and resting. The patient’s tongue movement is depicted by the red line. When the patient moves his tongue, the red line elevates to 1; when he rests, the red line returns to zero. The blue line represents the signal change over time ( Fig. 5 ). In the top graph, the BOLD signal changes in concert with the patient’s tongue movement; when the patient moves his tongue, the signal increases. When he rests, the signal reverts to baseline. This voxel corresponds with the known location of the motor homunculus of the tongue. This voxel is considered active and is depicted in yellow. The lower graph depicts a voxel that has nothing to do with tongue movement. Visual inspection demonstrates that there is no correlation between the BOLD signal (in blue) and the paradigm (in red). Therefore, this voxel is not considered active. Simply put, an fMR imaging map is a correlational map of signal intensity changes in the fMR imaging paradigm.