Slice thickness/gab
Weighting
Details
Important features
Axial
5 mm/0–0.5 mm
T2WI
T2-TSE
Cortical ribbon sign, infiltration of insula, basal ganglia
Axial
5 mm/0–0.5 mm
T1WI before/after administration of contrast agent
SE preferred, without fat suppression, without MT pulses, same sequence ∓ contrast
Consider T1-hyperintensities
Coronal or sagittal
5 mm/0–0.5 mm
T1WI after administration of contrast agent
SE preferred, should not be replaced by 3D sequences
Depicts late enhancement when acquired after axial sequence
Axial
5 mm/0–0.5 mm (FLAIR with gab)
FLAIR or PD (long TR)
Optional 3D FLAIR
Axial
5–6 mm/0.5–1 mm
DWI
Calculate ADC
Low ADC: postsurgical infarcts, cell density, abscess, antiangiogenic therapy
Axial
T2*WI
SWI before/after administration of contrast agent
(micro) Hemorrhages, blooming veins, tumor vessels
Second plane
Depends on the localization of the tumor
T2WI or T1WI
Choose the sequence which best depicts the tumor
Follow-up examinations should include exact the same sequence
3D post CM
Avoid inversion pulses (MPRAGE)
Does not replace second plane
Measure enhancement in 3 planes
Additional to the standard spin echo (SE) sequences, an increasing number of various sequences have become available. However, the imaging characteristics on these sequences and thus the size and morphology of tumors might vary artificially. The key to a correct evaluation of study patients in a comparable way is to keep standardized imaging sequences during follow-up. A standard imaging protocol should contain T2 and FLAIR or proton density sequences. They should be combined with T1-weighted sequences before and after intravenous administration of contrast agent.
2 Brain Tumors in Adults
2.1 Questions to the Radiologist
For each space-occupying lesion, inflammatory or vascular disease should be considered before a real neoplasm is diagnosed. Especially subacute hemorrhage, venous infarction, arteriovenous malformations, large demyelinating diseases, or necrotic infections may look like a real neoplastic tumor. Patient’s history, neurological symptoms, and patient’s age are mandatory information to provide the correct diagnosis. Further, there are some imaging features which may specify the entity of a lesion. These features include diffusion restriction of T2-hyperintense lesions (Fig. 1), capsular and target-like structures of the margin, and the halo sign of the marginal zone (Fig. 2). Veins should be screened for thrombosis and arteries for any other pathology (e.g., aneurysm, malformations). Beside hemorrhage, T2*WI and especially thin-sliced susceptibility-weighted imaging (SWI) depict the “blooming” of any collection of blood either in hemorrhages and micro bleeds, cavernomas, or in vascular thromboses (Tong et al. 2008) (Fig. 3). The skull base, orbit, and viscerocranium should be screened for tumors and inflammatory diseases as they may secondarily infiltrate into the brain (Fig. 4). Especially in younger patients, the eyes and skin should also be inspected for malformations and hamartia indicating neurocutaneous diseases (Kandt 2003).
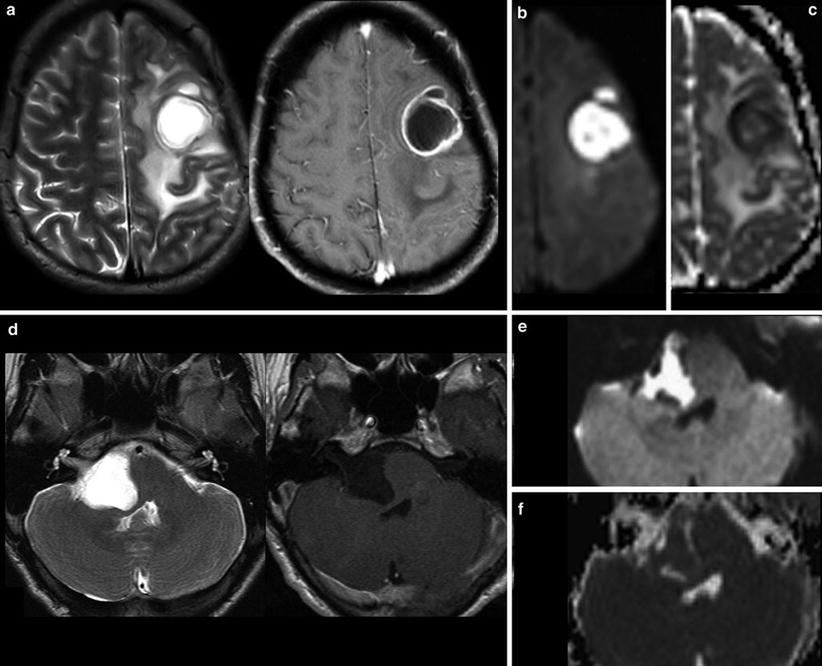
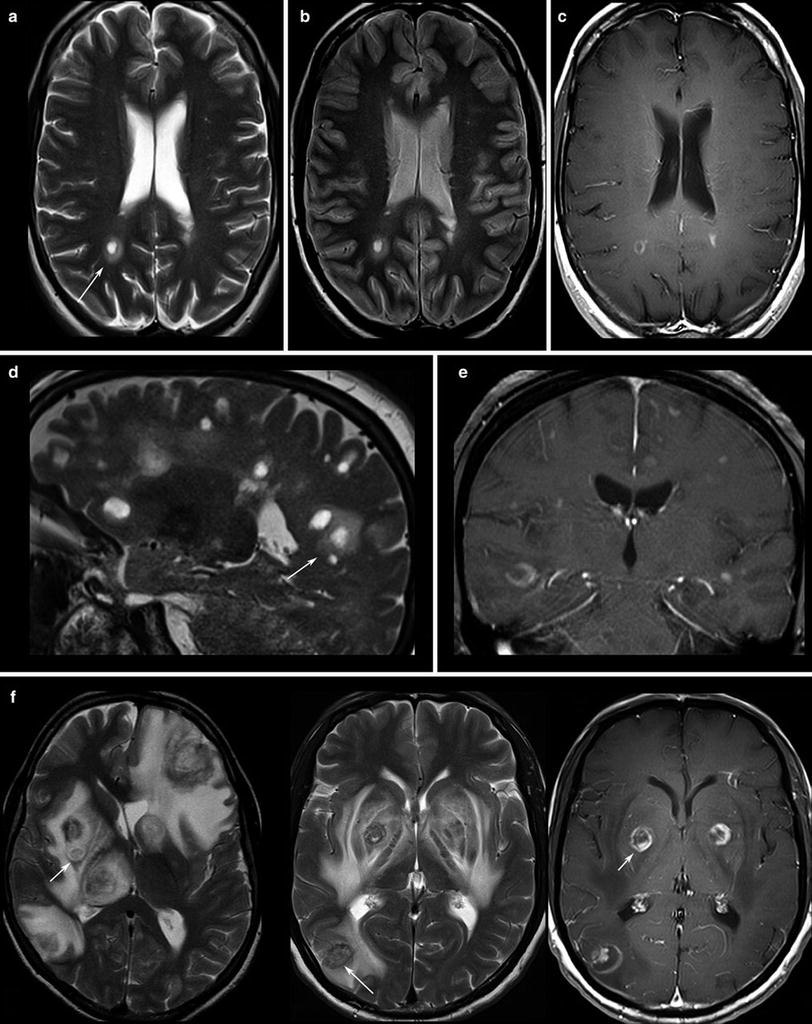
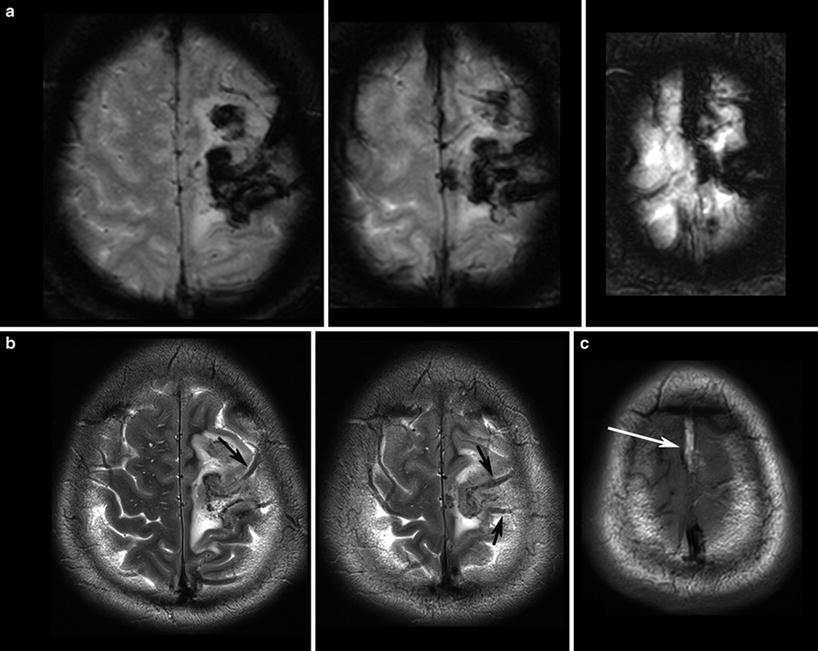
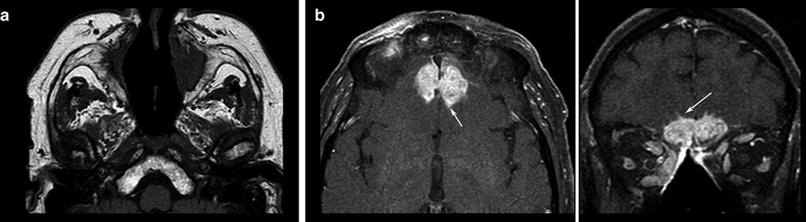
Fig. 1
Very hyperintense DWI lesions with corresponding lower ADC values. Ring-enhancing lesion with edema in patient with lung cancer (a). Very high DWI signal (b) with lower ADC values (c) were highly suspicious for an abscess, which was confirmed by stereotactic punction. Also note the hypointense signal of the capsule in T2WI (a). The hyperintense and nonenhancing lesion in the pontocerebellar angle (d) shows high DWI signal (e) with lower ADC values (f). These features are almost pathognomonic for epidermoids differentiating them from arachnoid cysts and cystic schwannomas
Fig. 2
Patients with multiple sclerosis, the T2WI (a, d) and proton density WI (b) show the typical “halo” surrounding the lesion (arrows). T1WI depicts round, patchy, (c) or crescent-shaped (e) enhancements which are typical for demyelinating lesions. (f) Toxoplasmosis reveal target phenomena in some of the lesions (arrows) which are typically located in the basal ganglia and in the subcortical region
Fig. 3
T2*WI (a) shows the blooming of the thrombosis in the cortical veins (arrows in b) and in the superior sagittal sinus which is hyperintense in the T1WI (arrows in c) due to methemoglobin
Fig. 4
T1WI spin echo sequence shows the destruction of bony corticosteroid medication. Patient had Wegener granulomatosis of the structures in the nasal cavity (a) and hyperostosis resulting from the infiltrates of the frontal skull base (b), developing intracranial tumor masses chronical infection. Also note the hypertrophic subcutaneous fat due to with small intracerebral infiltration (arrows, surgically confirmed)
First Question: Tumor or Tumor-Like Lesion?
The most important question regarding the tumor entity is the differentiation between intracerebral (also named intra-axial) and extracerebral (extra-axial) localization. Extracerebral tumors are mostly benign neoplasms like meningiomas and schwannomas, whereas intracerebral tumors are malignant in the majority of cases, especially in older patients. Extracerebral tumors are rare in younger patients; thus neurocutaneous syndromes, previous radiation therapy, or metastases (e.g., neuroblastomas) should be considered.
Second Question: Intracerebral (Intra-axial) or Extracerebral (Extra-axial)?
Signs indicating an extracerebral tumor are illustrated in Fig. 5.
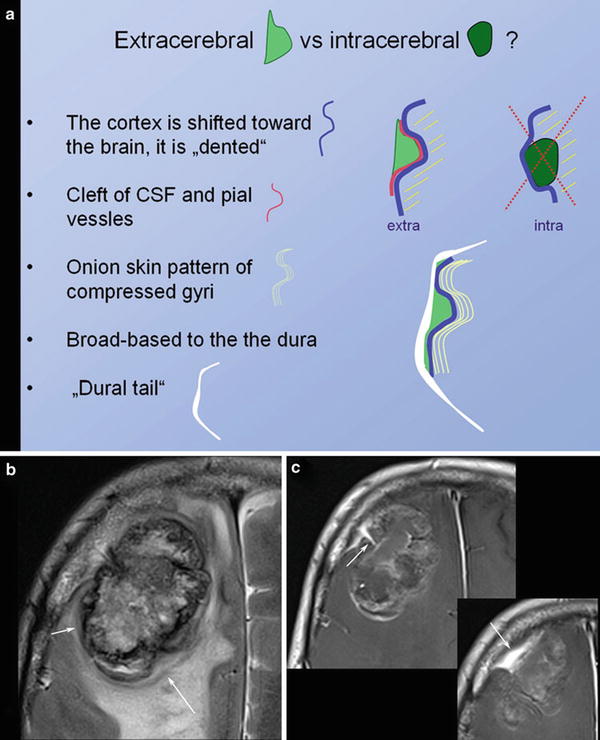
Fig. 5
Schematic illustration of extracerebral versus intracerebral tumors is shown in (a). In meningiomas with irregular enhancement and marked intracerebral edema, (b) the extracerebral location might be difficult to evaluate. However, broad and sometimes umbilicated basis to the thickened dura (arrow in c) and the shifted cortex (arrow in b) may help to correctly diagnose extracerebral tumor
The next question addresses the number of tumors. Singular large intracerebral tumors are mostly glial tumors; otherwise metastases should be suspected.
Finally, the possibility of a cerebral lymphoma should be considered. Corticosteroids should be withheld if a lymphoma is a differential diagnosis based on the imaging findings until a stereotactic needle biopsy has been performed (Fig. 6). Lympholytic activity of corticosteroids makes the histopathological diagnosis more difficult or even impossible. Therefore, radiologists should be familiar with imaging features of this tumor entity (Bühring et al. 2001).
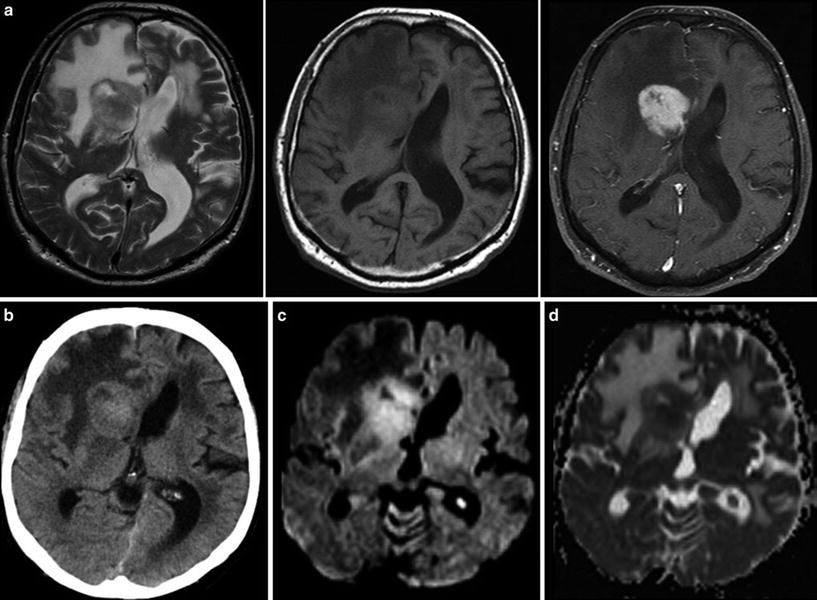
Fig. 6
Typical primary CNS lymphoma (PCNSL) showing features of a tumor with dense-packed tumor cells. The tumor is almost isointense to the gray matter in T2WI and T1WI (a) and enhances contrast agent with a patchy appearance. On CCT the tumor is isodense to gray matter (b). DWI signal is bright due to the narrowed extracellular space (c) and corresponding ADC values are low (d)
Third Question: Is Cerebral Lymphoma Possible?
2.2 Tumor Localization
The description of tumor localization should consider two aspects: the precise anatomical localization and the spatial relation to functional representations of motor and language skills. Anatomical designation not only means the lobe and gyrus but also the relationship to white and gray matter structures. The infiltration of the cortical ribbon (cortical ribbon sign) and thickening of the corpus callosum are typical features of infiltrative glial tumors which help to differentiate them from vasogenic edema (Fig. 7).
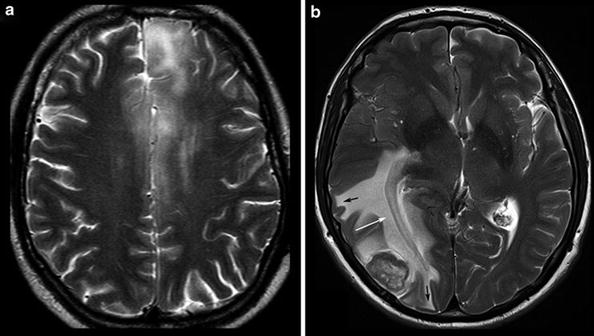
Fig. 7
Diffuse infiltrating gliomas often infiltrate the cortical gray matter (left and also right frontal lobe in a), resulting in a swelling and blurring gray–white matter interface (“ribbon sign”). In contrast, vasogenic edema (b) respects the gray–white matter interface and white matter tracts, extends finger-like into the gyri (black arrows), and demasks the optic radiation (white arrow)
The primary motor, sensory, auditory, and visual cortices are assigned at the brain surface. However, surface relief may be difficult to recognize in sectional images and anatomy might be distorted by the tumors. The identification of surface anatomy is easier with interactive observation of 3D objects. Further, planar reformatting of the brain surface helps to delineate the central sulcus which marks the perirolandic region with the primary sensorimotor cortex (Table 2) (Figs. 8 and 9).
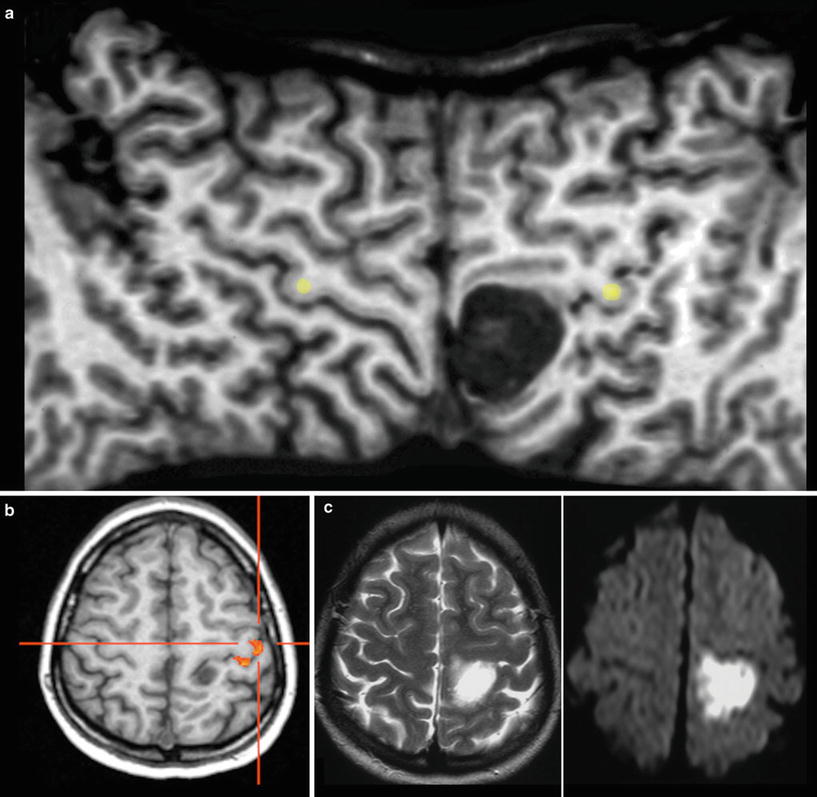
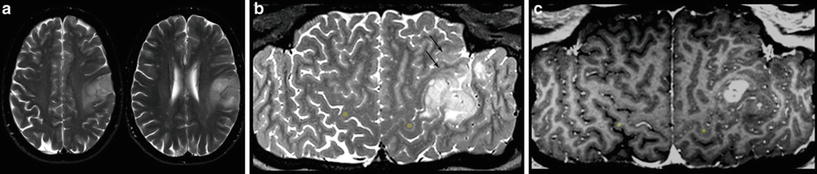
Table 2
Cerebral anatomy with respect to brain function
Spatial resolution | Distortions and signal loss | Tumor related dislocation | ||||
|---|---|---|---|---|---|---|
Sectional MRI | + | GE >> SE | Anatomical distortions in large tumors (edema) | White matter tracts mostly invisible | Anatomical interindividual variances | Variance between function and anatomy |
3D MRI | ++ | Due to GE | Anatomical distortions in large tumors (edema) | White matter tracts mostly invisible | Anatomical interindividual variances | Variance between function and anatomy |
Surface reformatting | ++ | Minimal | White matter not depicted | Contorted proportions | ||
fMRI | Reduced | Skull base, blood products, metal, mineral | False-negative or positive activations | Discrepancy between vascular response and neuronal activity | Task dependent activation depicts only part of language function | Needs intact neurovascular coupling |
DTI | Reduced | Skull base, blood products, metal, mineral | ||||
Tractography | Reduced | See DTI | May assume tract damage | Different methodologies | Significantly affected by the method |
Fig. 8
The surface-reformatted image (a) shows both hemispheres from the interhemispheric fissure to the Sylvian fissure, displaying the entire central sulcus. The space-occupying lesion is located in the postcentral gyrus, shifting the precentral sulcus forward. The fMRI with motor activation of the hand (b) and intraoperative monitoring confirmed this localization. It was an epidermoid with characteristic very hyperintense signal in T2WI (c) and very high signal on DWI (see also Fig. 1)
Fig. 9
Exact location of this perirolandic glioma is difficult to define in axial slices (a). The surface-reformatted image depicts the precentral gyrus in whole length, showing the hand knob of the motor hand area (yellow dots in b and c). The tumor including its enhancing part is located in the postcentral region, but T2-weighted reformatted image (b) clearly shows infiltration into the precentral gyrus and the inferior frontal gyrus (arrows)
However, this direct allocation of anatomy to function and vice versa is only true for primary cortical areas: the variance increases with the complexity of brain function. One of the most investigated functions is the language since neurosurgeons have the primary goal of preserving the language during tumor resection. Another critical issue is to protect important white matter tracts. To achieve these goals, functional MRI (fMRI) and tractography are well-established components of presurgical imaging (Fig. 10). MR tractography virtually dissects functionally critical white matter tracts, such as the corticospinal tract and the arcuate fascicle (Fig. 11), enabling the neurosurgeon to plan the surgical approach which best preserves the tract during resection. However, uncritical and inexpertly handling of these methods bears the imminent danger of misinterpretations (Jellison et al. 2004).
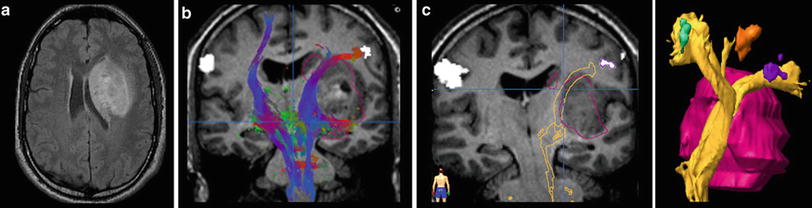
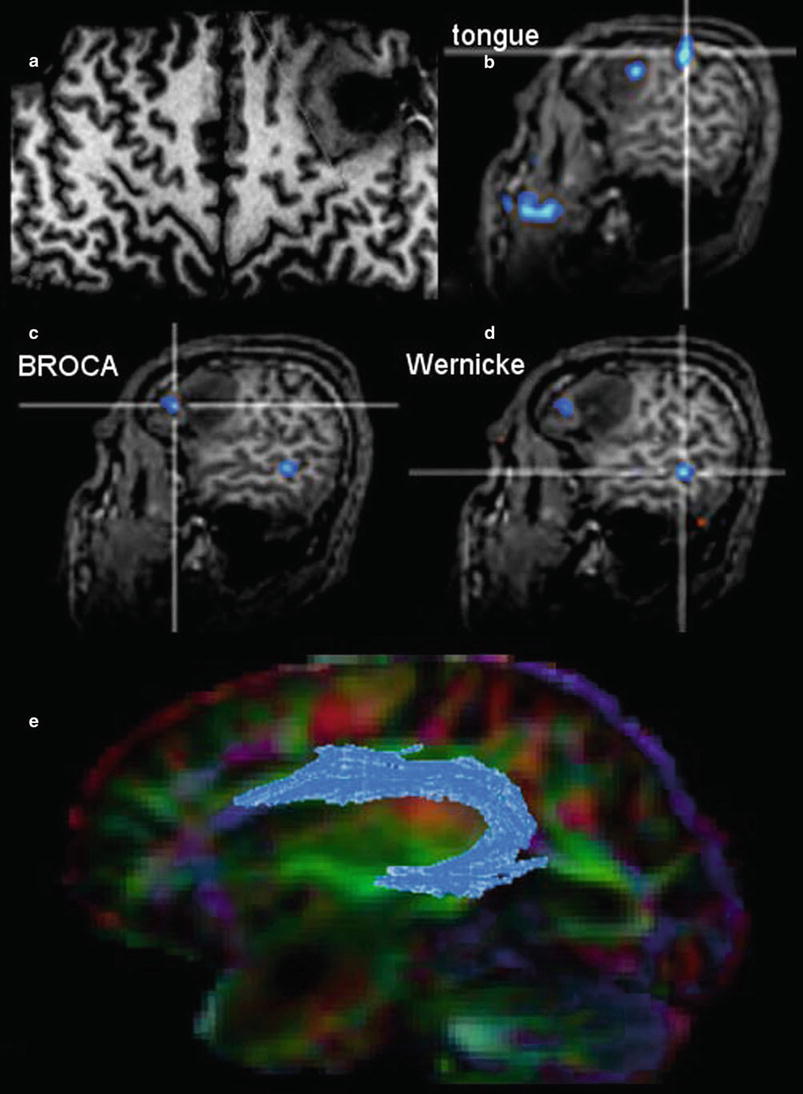
Fig. 10
Presurgical DTI and fMRI in brain tumors. FLAIR shows a tumor located in the basal ganglia in a patient with latent hemiparesis (a). Tractography was performed with BrainLab@ using the functional areas of the tongue, hand, and foot in the motor cortex (white spots) as seed region and the cerebral peduncle as target region. In (b) the corticospinal tract is shown with different color-coded tracking fibers. In (c) preoperative virtually dissected corticospinal tract was transformed in a three-dimensional object which can be integrated into a standard neuronavigation system, allowing for intraoperative visualization of the tracts
Fig. 11
The surface-reformatted image shows a glioma in the inferior frontal lobe (a). The motor function of the tongue was located behind the tumor, but one activation area was found inside the tumor (b). Patient had a seizure with reversible aphasia. FMRI was performed using verbal subtest of the German Wilde Intelligence Test: The patient is required to find a pair of synonyms out of a set of five words presented simultaneously (Spreer et al. 2002). The frontal language activation area (c) and the temporal language area (d) are both located in the tumor-bearing left hemisphere, which was defined as dominant for language (also confirmed by word generation test). In (e) fiber tracking of the arcuate fascicule (blue) projected on the color-direction map is demonstrated in a patient with a tumor near the temporal pole
Therefore, the main indication and the undoubted strength of fMRI and DTI is the presurgical planning. Functional language MRI can localize language dominant hemisphere (Ruff et al. 2008; Roux et al. 2003; Kim et al. 2009; Spreer et al. 2002) (Fig. 11). However, surgical resection of tumors in the language areas of the dominant hemispheres still requires awake craniotomy and direct brain mapping to prevent postsurgical aphasia (Kim et al. 2009). Tractography may depict the relation between tumor and white matter tract, but it should not determine the extent of resection during surgery.
2.3 Tumor Malignancy
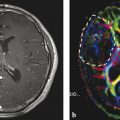
The imaging criteria of malignancy include blurring tumor margins, tumor edema, necroses, and contrast enhancement. However, these signs of malignancy are not as reliable as they allow the definite categorization into low- and high-grade tumors. Diffuse gliomas infiltrate the brain tissue by definition. Therefore, they mainly do not have sharp margins. In contrast, metastases and also highly malignant PNETs often have sharply delineated margins between tumor and edema (Fig. 12). Low-grade neuroepithelial glioneuronal tumors like gangliogliomas and DNETs may be associated with cortical dysplasia which may blur anatomical structures. Further, especially gangliogliomas may show areas of contrast enhancement (Fig. 13). Necroses are difficult to differentiate from tumor cysts; in both, the margins may enhance. However, cysts enhance linearly in contrast to the often partially nodular enhancement at the margins of tumor necroses.
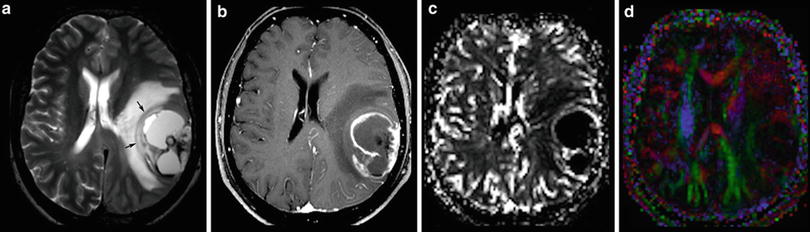
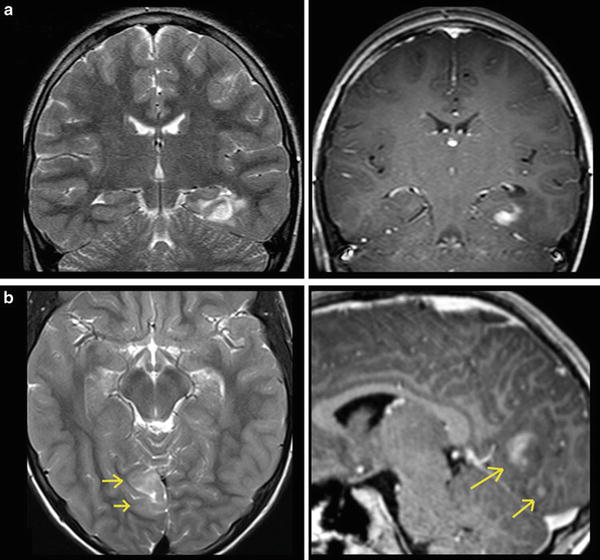
Fig. 12
A large cystic-necrotic tumor abuts the brain surface and is surrounded by huge edema. Margins of the tumor are shapely delineated (arrows in a). The contrast-enhancing rim, which also involves the brain surface (b), shows moderate increase of cerebral blood volume of the tumor margins (c), which does not extend into the surrounding brain tissue (which is often seen in glioblastomas). The color-coded FA map (color-direction map) shows that the corticospinal tract (blue area in the right hemisphere) is involved by the edema. The blue indicates diffusion along the inferior/superior axis (d)
Fig. 13
Two different gangliogliomas are shown in the temporomesial lobe (a) as the most typical tumor site of glioneuronal tumors and in the occipital lobe (b). Both tumors involve the cortical ribbon and have blurred tumor margins; the occipital tumor has two areas of enhancement (arrows)
Malignant gliomas generate tumor vessels with impaired blood-brain barrier. The higher vascular permeability causes extravasal accumulation of contrast agent with consecutive signal increase on T1WI. Therefore, contrast enhancement is one important hallmark of tumor malignancy. Considering that most of the WHO grade I astrocytomas and a larger amount of grade II oligodendroglioma (White et al. 2005) may also enhance due to higher vasculature, this sign of malignancy has a limited value (Fig. 14). On the other side, about 30 % of high-grade WHO III astrocytomas do not enhance contrast agent (Scott et al. 2002; Muragaki et al. 2008; Chaichana et al. 2009) (Fig. 15).
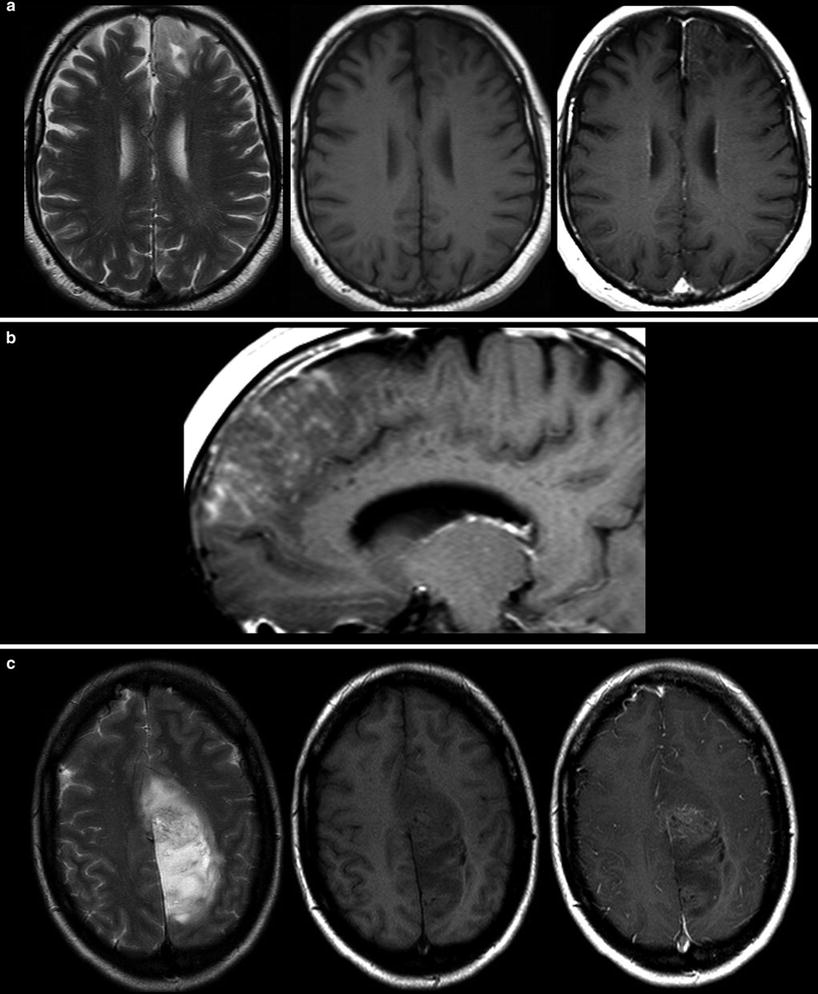
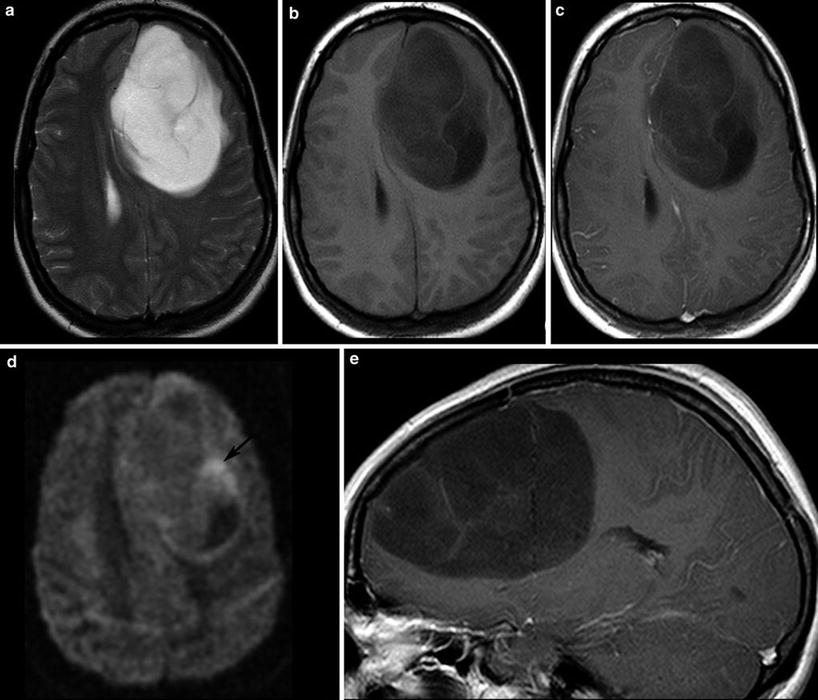
Fig. 14
Two low-grade gliomas with contrast enhancement are shown. A frontal astrocytoma WHO grade II typically infiltrating the cortical ribbon shows faint superficial enhancement (a), which was due to subpial infiltration of the tumor (b). A large parasagittal oligodendroglioma WHO grade II shows inhomogeneous enhancement in the center of the tumor. It is noteworthy that both tumors have almost no edema
Fig. 15
A large frontal astrocytoma WHO grade III is shown with very high signal on T2WI (a) and low T1 signal (b, c). The DWI yields different tumor compartments with a cystic area (low signal), an area with presumably higher cell density (higher signal, arrow), and the huge tumor mass with intermediate signal. There is at the most faint contrast enhancement (c, e)
Although the histopathological WHO classification still is the gold standard to categorize tumor entity and their malignancy, the molecular genetic profile of a brain tumor becomes more and more important for tumor diagnosis. Up to date, there are only few studies investigating imaging features of brain tumors with different molecular profiles (Aghi et al. 2005; Eoli et al. 2007; Diehn et al. 2008). Considering that these profiles determine the metabolism of the tumor, MR spectroscopy and metabolic imaging with PET should be the methods of choice to recognize molecular pattern (“PET Imaging of Brain Tumors”).
2.4 Tumor Monitoring
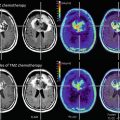
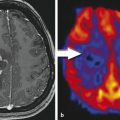
Monitoring treatment effects on brain tumors becomes more and more complex. In conventional MR imaging, contrast enhancement is the hallmark of tumor growth. However, this imaging feature is more than ambiguous regarding tumor monitoring. On the one side, endothelial cells are sensitive to radiation and chemotherapy and—most often associated with temozolomide treatment—therapy-induced changes may yield a blood-brain barrier damage with contrast enhancement and mass effect of the treated brain tissue (Fig. 16). Neuro-oncologists introduced the term “pseudoprogression” defining an increased (>25 % in diameter) or new enhancement of irradiated tissue usually detected within 3 months of radiation that subsequently abates without further treatment. This phenomenon is observed in approximately 20–30 % of patients treated with today’s standard therapy for glioblastomas (Brandsma et al. 2008). On the other side, new antiangiogenic treatments normalize the blood-brain barrier damage and thus reduce the contrast enhancement independent from real antineoplastic effects, which is named “pseudoresponse” (Figs. 17 and 18). Being familiar with the imaging features of infiltrative brain tumors may however help to recognize nonenhancing tumors (Fig. 18). Neuro-oncologists are aware of these diagnostic challenges and addressed these problems in their new response criteria for malignant gliomas (Wen et al. 2010).
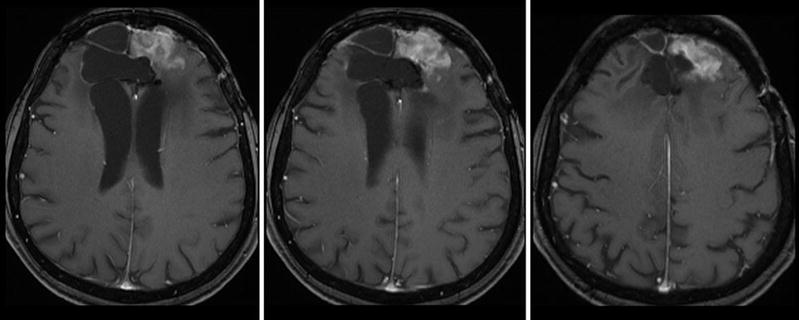
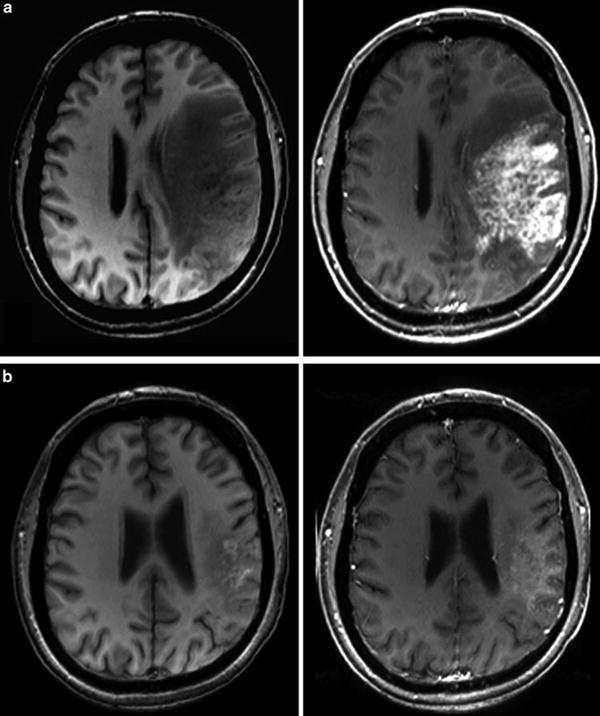
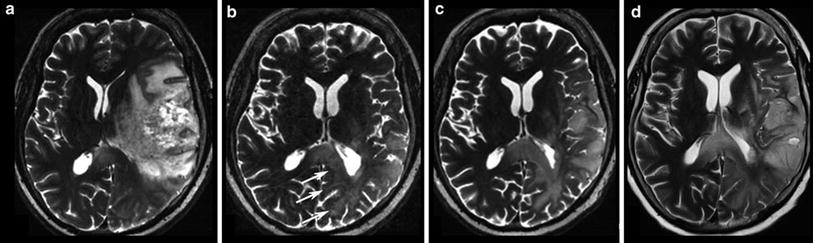
Fig. 16
Patient underwent surgical resection of a frontal glioblastoma and was treated with radiation and temozolomide. The 3 months control yielded new solid enhancement which persisted 2 months later. MR perfusion was not conclusive due to severe artifacts. Histopathological finding after resection of this contrast-enhancing area did not reveal any tumor cells
Fig. 17
Patient had a recurrent glioblastoma, showing mass effect, inhomogeneous tumor area with adjacent edema, and irregular contrast enhancement (a). Four weeks after starting treatment with a humanized monoclonal VEGF-antibody, contrast enhancement almost disappeared (b), fulfilling the criteria of partial response concerning the enhancing lesion. T2WI might give more information on treatment response (Fig. 18). Also note the hyperintense areas in precontrast T1WI under antiangiogenic treatment
Fig. 18
Same patient as in Fig. 17: T2W slices before antiangiogenic treatment (a) and 8 weeks after starting therapy show impressive anti-edematous effect due to the VEGF antagonism (b). Mass effect and inhomogeneous tumor area also vanished under this drug, and patient’s hemiparesis gradually resolved. However, some areas show new signal increase (arrows). In the 8-week follow-up (c, d), hyperintense areas mainly infiltrating the cortical areas continuously increase, accompanied with worsening of neurological symptoms
Figure 19 illustrates these response criteria (RANO) (Wen et al. 2010).
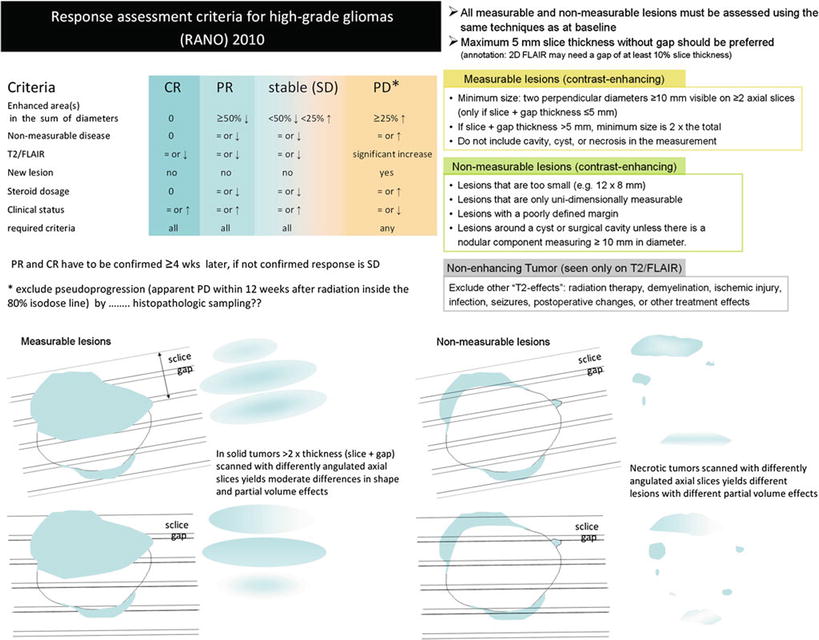
Fig. 19
Updated response assessment criteria for high-grade gliomas: response assessment in neuro-oncology working group (Wen et al. 2010). Further, the difficulties to monitor glioblastomas after surgery leaving a resection cavity are shown for axial slices
The measurement of contrast-enhancing lesions in irregularly shaped, necrotic, and inhomogeneous or ring-enhancing lesions is challenging and interobserver variability is high (Vos et al. 2003). The most important issue in monitoring glial tumors is to depict the tumor regardless whether or not it enhances. The imaging features of this nonenhancing tumor were more or less ignored longtime. Nonenhancing tumor, or rather brain tissue which is infiltrated by glioma cells, may look like vasogenic edema or gliosis since each of these entities increases T2 relaxation time and is thereby hyperintense on T2-weighted images. However, there are some imaging characteristics which may help to distinguish edema from brain tumor, bearing in mind that tumor cells are often found in both normal and edematous brain tissue (see also Figs. 7 and 17).
To guarantee the comparability of images, a standardized protocol should be mandatory, which has not yet been implemented. The slice thickness should not exceed 5 mm in order to minimize partial volume effects (Wen et al. 2010). Sagittal high-resolution 3D sequences might be advantageous to avoid effects from different slice angulations and partial volume effects, but they also have disadvantages considering movement artifacts and T1 contrast (see Figs. 23 and 24). Further, once there is an artifact (e.g., pulsation artifact), it might be reconstructed in three planes (MPR) simulating a real lesion
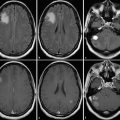
Further, each monitoring begins with an early postsurgical MRI in order to detect the residual tumor which has to be monitored thereafter. Postsurgical control should always include DWI to detect infarcts, which may show confounding enhancement in the follow-up (Fig. 20).
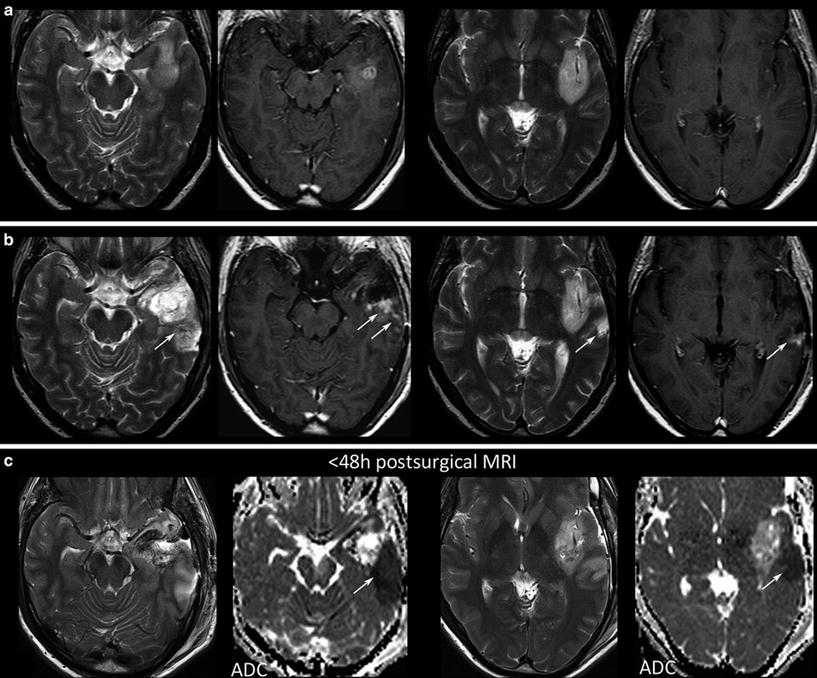
Fig. 20
 Tumor Imaging
 Imaging of Brain Tumors
 6 Perfusion Imaging: Arterial Spin Labeling
 3 Going Beyond the Conventional Morphological Imaging: An Overview of Functional Imaging Techniques
 1 Conventional Morphological Imaging: MRI Remains the Workhorse
 18 On the Horizon: Going Beyond Conventional MR Contrast Agents


Postsurgical monitoring of a patient with a high-grade glioma: The contrast-enhancing part of the tumor in the temporal white mater (a) was removed, while the insular part was left in place. The MRI control after 3 months showed T2-signal alterations and contrast enhancement in the dorsal margin of the tumor and also in the temporal cortex (arrows). These areas were suspicious for tumor recurrence. However, in retrospection to the early postsurgical MRI, (c) clearly reveals that these areas match with postsurgical infarction (arrows) and thus might not be misinterpreted as tumor progression or possible pseudoprogression
Related posts:
Tumor Imaging
Imaging of Brain Tumors
6 Perfusion Imaging: Arterial Spin Labeling
3 Going Beyond the Conventional Morphological Imaging: An Overview of Functional Imaging Techniques
1 Conventional Morphological Imaging: MRI Remains the Workhorse
18 On the Horizon: Going Beyond Conventional MR Contrast Agents
Stay updated, free articles. Join our Telegram channel
Full access? Get Clinical Tree
