Fig. 11.1
Representative MR imaging aspects of liver metastases of well-differentiated pancreatic neuroendocrine tumors. Lesions present with a hyperintensity on T2-weighted images (a) and hypointensity on fat-saturated T1-weighted images (b). After contrast medium injection, the lesions are characterized by a marked and heterogeneous enhancement on the arterial phase acquisition (c) and a signal decrease in comparison with the surrounding liver parenchyma on the portal phase acquisition (washout, d). On the diffusion-weighted images with high b value, the metastases appear as hyperintense lesions (e). This sequence enables the detection of very small lesions (white arrows in e) that were not clearly depicted on the other sequences
Limitations of Recist Criteria to Evaluate Response to Targeted Therapies in Neuroendocrine Tumors
In hypervascularized neuroendocrine tumors, morphological changes are clearly observed after exposure to targeted antiangiogenic agents. As described in early trials using VEGFR inhibitors, the central part of the tumor may show a total disappearance of vascularization suggesting tumor necrosis. Within the first weeks of treatment, patients with bulky tumor masses may display an increase in lactate dehydrogenase in plasma, consistent with the occurrence of tumor necrosis [28, 29]. Occurrence of necrosis has been further confirmed in few patients who benefited from posttreatment surgical resection of residual disease.
Macroscopically, morphological changes that will be detectable on imaging will reflect the early decrease in number of tumor vessels along with the reduced blood flow in the central area of the tumor, rather than tumor shrinkage. Several imaging techniques including high-frequency Doppler ultrasound, blood flow computerized tomography scans, and dynamic contrast magnetic resonance imaging have been proposed to capture the effects of targeted agents on tumor angiogenesis in several clinical trials [5, 30–32]. However, those functional techniques are not routinely performed when treating patients with antiangiogenics outside prospective trials.
Response Evaluation Criteria in Solid Tumors (RECIST), which are simple and reproducible criteria, have been established for many years to assess tumor response when using classical cytotoxics in clinical trials [33, 34]. While RECIST criteria are acknowledged to reflect adequately tumor progression, RECIST have been recently increasingly criticized for their limitations to assess the activity of targeted and antiangiogenic therapies [32]. Since 2007, Choi and colleagues expressed their concern about the insufficiency of traditional RECIST dimension criteria to evaluate the effect of imatinib in GIST and were the first to propose to evaluate changes in tumor density using contrast-enhanced computed tomography [3] as an alternative method for tumor evaluation. Choi criteria included both tumor size and tumor density and were showed to identify more adequately than RECIST patients benefiting from imatinib in GIST [4]. Beyond GIST, the approval of sorafenib in advanced hepatocellular carcinoma [35] and of sunitinib and everolimus in advanced digestive neuroendocrine tumors [36] has focused the attention on response criteria since both agents were registered in pivotal trials while reporting less than 10 % objective response rate. Indeed, in the pivotal trial with sunitinib, RECIST were the selected criteria of response in pancreatic neuroendocrine tumors. The results of pivotal phase III trials with sunitinib and everolimus in pancreatic neuroendocrine tumors showed objective response rate lower than that usually expected for a drug with activity in cancer. In the sunitinib trial, the response rate was 9.1 % [1]. In most patients, only minor responses that meet criteria of tumor stabilization by RECIST were reported. During the course of the phase III trial with sunitinib, several patients with liver metastasis developed large area of hypodensity that usually reflects tumor necrosis with or without significant changes in tumor size (Fig. 11.2). This pattern was previously reported with other antiangiogenic agents in other tumor types and is usually considered as evidence of antitumor activity [37, 38]. Taken together, it was suggested that this peculiar feature that is not captures by RECIST would explain why PFS and overall survival benefit could be observed with a drug displaying only few responses by RECIST. Similar findings were reported in the everolimus trial with 5 % objective responses according to RECIST, even though a total of 64 % of the patients receiving everolimus had some degree of tumor shrinkage [2]. Therefore, tumor density on CT-scan, rather than measurement of tumor size, has been discussed as a surrogate endpoint of activity for patients treated with targeted therapies for advanced neuroendocrine tumors, as this has been previously proposed for imatinib in GIST by Choi and collaborators.
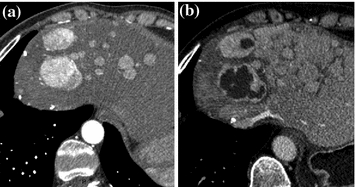
Fig. 11.2
Sunitinib induces decrease in tumor density in patients with advanced pancreatic neuroendocrine tumors. a Prior to treatment, liver metastases of pancreatic neuroendocrine tumors with high vascularization. b Treatment with sunitinib induces large area of tumor hypodensity
Perspectives of New Response Criteria for Neuroendocrine Tumors Using CT-Scans
In contrast to functional imaging, which may be costly or uneasy to access, CT-scan is a readily available technique that can be considered as a reliable method to assess both tumor size and tissue density. The first intent to include both tumor size and tumor density was achieved by Choi and colleagues for the assessment of response to imatinib in GIST-treated patients. They defined a partial response as a ≥10 % decrease in one-dimensional size or a ≥15 % decrease in tumor density on a contrast-enhanced CT-scan (Table 11.1). Choi criteria yielded a response rate of 80 % as compared to 43 % by RECIST and were significantly more predictive of time to tumor progression (TTP) and OS in GIST patients treated with imatinib [4]. In the field of hepatocellular carcinoma, our team has recently investigated the applicability of Choi criteria across two cohorts of patients with advanced HCC treated with VEGFR inhibitors. In the phase II study exploring sunitinib in advanced HCC, investigators have noticed that sustained tumor stabilization was usually associated with decreased tumor density on CT-scans [37]. This led us to perform a post-hoc ancillary study in the 26 patients evaluable for changes in tumor density on CT-scans. While only 3.8 % of patients had objective response according to RECIST, 65.4 % of patients were reclassified as responders according to Choi criteria [5]. Interestingly, patients reclassified as responders according to Choi criteria experienced a significantly longer median TTP (7.5 months), than non-responders (4.8 months; HR = 0.33; 95 % CI, 0.04–0.75, p = 0.0182). We also applied Choi criteria to a second cohort of advanced HCC patients treated in our center with sorafenib on a routine basis, using a blinded independent central response assessment was conducted with RECIST and Choi criteria. Among 64 patients available for both RECIST and Choi criteria, 3 % had response according to RECIST and 51 % according to Choi criteria. Interestingly, better OS (≥22 months) was observed in patients with complete/partial response than in patients with stable disease and progression, regardless the type of radiological criteria. However, in this second independent cohort, Choi criteria identified more adequately than RECIST subgroups of patients with complete/partial response that also experienced longer survival [39].
Table 11.1
Definition of RECIST and Choi criteria
RECIST | Choi | |
|---|---|---|
CR | Disappearance of all lesions | Disappearance of all lesions |
No new lesions | No new lesions | |
PR | A decrease in size of ≥30 % (sum of diameters) | A decrease in size of ≥10 % or a decrease in tumor density (HU) ≥15 % on CT |
No new lesions | ||
No obvious progression of non-measurable disease | ||
SD | Neither sufficient shrinkage to qualify for PR nor sufficient increase to qualify for PD | Does not meet the criteria for CR, PR, or PD |
No symptomatic deterioration attributed to tumor progression | ||
PD | An increase in size of ≥20 % (sum of diameters) | An increase in tumor size of ≥10 % and does not meet criteria of PR by tumor density (HU) on CT |
New lesions | ||
New intratumoral nodules or increase in the size of the existing intratumoral nodules |
The experience of Choi criteria is very limited in neuroendocrine tumors but represents an exciting challenge. In our institution, we have reviewed 22 cases of patients with well-differentiated pancreatic neuroendocrine tumors treated either with sunitinib or everolimus according to both RECIST and Choi criteria [40]. At the time of the first evaluation, two patients (9 %) were responders according to RECIST whereas 11 patients (50 %) presented an objective response according to Choi criteria. Despite the low number of patients, Fig. 11.3 shows that patients responding at the first evaluation according to Choi that had better PFS (median: 783 days) than those classified as stable (median: 260 days) or progressive (median: 106 days), with a p value of 0.0385. These results will require further validation on a larger number of patients, and discussion in terms of technical endpoints (choice of CT phase acquisition, selection of target lesions for hypodensity evaluation), but these preliminary data suggest that Choi criteria could be useful to investigate in neuroendocrine tumors treated with targeted therapies.
 New Anticancer Agents in Neuroendocrine Tumors
Inhibition of mTOR in Neuroendocrine Neoplasms of the Digestive Tract
Clinical Management of Targeted Therapies in Neuroendocrine Tumours
New Anticancer Agents in Neuroendocrine Tumors
Inhibition of mTOR in Neuroendocrine Neoplasms of the Digestive Tract
Clinical Management of Targeted Therapies in Neuroendocrine Tumours
 Liver-Directed Therapies in Neuroendocrine Tumors
 Overcoming Resistance to Targeted Therapies: The Next Challenge in Pancreatic Neuroendocrine Tumors (PNETs) Treatment
 Measuring the Relationship of Quality of Life and Health Status: Including Tumor Burden, Symptoms, and Biochemical Measures in Patients with Neuroendocrine Tumors


Related posts:
New Anticancer Agents in Neuroendocrine Tumors
Inhibition of mTOR in Neuroendocrine Neoplasms of the Digestive Tract
Clinical Management of Targeted Therapies in Neuroendocrine Tumours
Liver-Directed Therapies in Neuroendocrine Tumors
Overcoming Resistance to Targeted Therapies: The Next Challenge in Pancreatic Neuroendocrine Tumors (PNETs) Treatment
Measuring the Relationship of Quality of Life and Health Status: Including Tumor Burden, Symptoms, and Biochemical Measures in Patients with Neuroendocrine Tumors
Stay updated, free articles. Join our Telegram channel
Full access? Get Clinical Tree
