Key Facts
- •
Tendinopathy refers to the full spectrum of tendon pathology, including tendon degeneration and tear, tenosynovitis, and calcific tendinitis. Tendinosis refers to tendon degeneration. The term tendinitis is currently considered less accurate, because inflammatory cells are rarely present in common tendon conditions.
- •
Radiographs are an important first step in the evaluation of tendon or bursal pathology and serve as an adjunct to further workup with magnetic resonance imaging (MRI), ultrasound, or computed tomography (CT). Although only a few tendons can be directly visualized on radiographs, important information regarding secondary signs of tendon pathology or alternative explanations for symptoms can be demonstrated.
- •
MRI and, in experienced hands, ultrasound are the current modalities of choice for direct visualization of tendon and bursal pathology. Ultrasound of tendons and bursae requires appropriate high-frequency transducers for optimal technique. Depending on the specific tendon site, the two modalities have respective strengths and weaknesses and may play complementary roles. Accuracy for diagnosis of tendon pathology in experienced hands is often strikingly similar between the two modalities, despite the great difference in technologies. Ultrasound is particularly well-suited for guiding interventions, compared with MRI.
- •
On MRI, the normal tendon is low in signal on all conventional sequences. Tendinosis appears as high signal on proton density weighted and T1-weighted sequences, but low signal on T2-weighted or fat-saturated T2-weighted sequences. Tendon tears appear as fluid-like high signal on all sequences. When tendons cross at 55 degrees to the main magnetic field, high signal due to magic angle artifact can mimic tendinosis.
- •
CT effectively depicts tendon course and caliber and certain forms of tendon pathology, such as tenosynovitis. It is particularly helpful to demonstrate calcification or ossification within a tendon, to demonstrate the relationship between tendon and surrounding bony structures, and when a patient has a contraindication to MRI. CT is used less commonly to image tendons than MRI or ultrasound, because it is less sensitive for depiction of tendon degeneration and some tendon tears. Bursae are rarely visible on CT unless distended with fluid.
- •
Shoulder arthrography can be used to diagnose full-thickness tears of the rotator cuff. MR arthrograms can be used to diagnose partial articular surface tears, as well as complete tears, and provide additional information related to the size and location of tear, quality of the tendon and shape of the coracoacromial arch, and presence of tendon retraction and muscle atrophy. CT shoulder arthrograms can also be used to detect rotator cuff tears but involve additional radiation exposure and are not commonly performed unless MRI is contraindicated.
- •
Tenograms and bursograms are rarely performed for diagnostic purposes but may be performed as part of an aspiration procedure or a therapeutic injection.
- •
Nuclear medicine studies, which are based on administration of radioactive pharmaceuticals, may show incidental evidence of peritendinous inflammation and enthesitis, but they are not a primary modality for tendon imaging. However, because the degree of tracer activity on positron emission tomography (PET) scans is related to the level of glucose metabolism, a possible future role for PET scanning in assessment of the degree or peritendinous or bursal inflammation and response to therapy has been suggested.
Tendons connect muscle to bone, transmitting force from muscle contraction to effect motion of joints and limbs. Tendon abnormalities are common—the result of degeneration and overuse, instantaneous trauma, and local and systemic disease processes. Tendon abnormalities can result in considerable morbidity and disability. Although history and physical examination remain the mainstay for evaluating tendon dysfunction, imaging examinations provide important supplementary information for the diagnosis and characterization of tendon pathology.
A tendon is composed of longitudinally oriented collagen fibrils that are bundled into fibers ranging in size from 5 to 30 mm ( Figure 13-1 ). The collagen fibers are organized into successively larger bundles—microfibrils, fibrils, and fascicles—to form a tendon. These successively larger bundles are enveloped and bound together by an endotenon, a network of collagen connective tissue that permits longitudinal motion of fascicles and conducts blood vessels, lymphatics, and nerves. The endotenon invests every fiber. The entire tendon, including the endotenon, is enveloped by a collagenous epitenon covering. As a tendon emerges from muscle, it is enveloped by a thin adventitial layer, termed a paratenon , formed from the fascial covering of the muscle. The paratenon is composed of collagen fibrils running parallel to the long axis of the tendon. A paratenon typically surrounds tendons that move in a straight line and helps to facilitate sliding motion of the tendon within the surrounding tissue. Together, the epitenon and paratenon comprise the peritenon. In some tendons, the paratenon is replaced by a tenosynovium, a synovial sheath composed of two layers lined by synovial cells. The tenosynovium provides lubrication and promotes gliding of the tendon. The synovial sheath also facilitates a cellular response to tendon injury. The Achilles’ tendon is an example of a tendon with a paratenon, whereas the flexor tendons of the hand are surrounded by a tenosynovium.

The normal adult tendon is composed predominantly of type I collagen, with less than 5% other types of collagen (types III, IV, V, and VI) and 2% elastin, in an extracellular matrix composed of ground substance and water. Collagen provides tensile strength, whereas elastin provides compliance and elasticity. The degree of cross-linking within and between longitudinally arrayed collagen molecules is the key to the tensile strength and resistance to degradation of collagen. Ground substance consists of proteoglycans, glycosaminoglycans (GAGs), structural glycoproteins, plasma proteins, and various small molecules. The water-binding capacity of ground substance helps account for the viscoelastic properties of tendon. Cellular elements are relatively sparse, composed of specialized forms of fibroblasts, known as tenocytes and tenoblasts .
The force of muscle contraction is transmitted from tendon to bone at the osteotendinous junction. At a direct insertion site, the tendon attaches to bone via transition through four distinct histologic zones: tendon, unmineralized fibrocartilage, mineralized fibrocartilage, and bone. At an indirect insertion site, the tendon attaches to the periosteum via collagenous fibers known as Sharpey fibers .
Tendons develop independently in the mesenchyme; their connection with muscle occurs secondarily. At the myotendinous junction, collagen fibers from tendons insert into clefts formed by muscle cells. This structure greatly increases the contact surface between the tendon and muscle, reducing the force per unit area during muscle contraction. The musculotendinous junction represents a weak link—it is less able to withstand loads than a normal tendon is. As a result, the myotendinous junction is a common site of failure (i.e., strain, tear) due to injury, when the tendon is normal and the individual is skeletally mature.
The blood supply to the tendon has several sources: the perimysium of muscle, the periosteal attachments, and the surrounding tissues. Some tendons are surrounded by a paratenon and receive vessels along their borders. Other tendons are contained within tendon sheaths and receive their blood supply via discrete conduits called mesotenons or vinculae . This latter arrangement results in areas of relative avascularity along the length of the tendon, which are nourished only by diffusion of synovial fluid. These areas of relative avascularity are considered prone to injury.
To perform their role in transmitting muscle force to bone, tendons must be capable of resisting high tensile force with limited elongation. Tendon strength correlates with total collagen content, density of stable (pyridinoline) cross-links, collagen organization, and fibril diameter and correlates inversely with type III (reparative) collagen and the proteoglycan-collagen ratio. Large variations in ultimate tensile strength and maximum strain are seen with differences in type and age of tendons. When mechanical load is excessive, it may produce inflammation and fiber damage, delayed and reduced collagen maturation, and inhibited collagen cross-linking. Age-related changes in tendon biochemistry, which can be seen as early as the third decade of life, may result in a less compliant tendon with decreased tensile strength and may predispose the tendon to overuse injury and tear. Older tendons also demonstrate decreased healing capacity. Accumulation of degenerative histologic changes within the tendon, such as hypoxic or mucoid changes, may also predispose to injury.
Tendon injuries may be acute, chronic, or acute-on-chronic. Acute injury includes direct injury, such as contusion or laceration, and indirect injury, such as acute tensile overload. Acute tensile overload usually causes either injury to the myotendinous junction (because the healthy tendon can withstand higher tensile loads than the muscle) or an avulsion fracture. Myotendinous strain usually occurs in the setting of rapid, forceful, eccentric muscle contraction (i.e., the muscle lengthens while it is simultaneously contracting). Muscles that cross two joints, such as the rectus femoris, hamstring, and gastrocnemius muscles, are thought to be predisposed to acute myotendinous strain, because they can develop tension on the basis of passive joint positioning alone. When it occurs in the setting of chronic tendon degeneration, acute tensile overload can also result in intrasubstance tendon tears. For example, many eccentric Achilles’ tendon ruptures occur due to acute injury superimposed on chronic tendon degeneration.
Chronic repetitive microtrauma can lead to overuse injury to the tendon, a much more common form of injury than myotendinous strain. When the tendon is strained repeatedly to 4% to 8% of its original length, the adaptive and reparative ability of the tendon can be exceeded. This can result in microscopic and/or macroscopic injury to collagen fibrils, noncollagenous matrix, and the microvasculature.
Tendinopathy is a term used to describe the combination of tendon pain, swelling, and impaired performance. It is a clinical descriptor and is used independent of underlying histopathology. The term tendinosis refers to intrasubstance tendon degeneration. Tendinosis, which can be asymptomatic, is characterized by histopathologic alterations to cells, collagen fibers, and noncollagenous matrix components. Both degenerative and reparative processes are observed. As microfailure of tendon fibers occurs, fibers may fail to heal effectively, perhaps due to decreased vascular supply or other factors. Histopathologic degenerative changes include angiofibroblastic hyperplasia (proliferation of fibroblasts and new capillaries), mucoid degeneration, hypoxic degeneration, hyaline degeneration, fatty degeneration, fibrinoid degeneration, chondroid metaplasia, calcification, and vascular changes. These histopathologic changes result in a decreased tensile strength of the tendon. Loss of functional tendon fibers leads to increased load on the remaining tendon, which, in turn, increases risk for progressive failure. Of note, inflammation within the tendon is not a feature in tendinosis, so the term “tendinitis” is considered by many to be a misnomer.
Continued tendon overload and chronic peritendinitis may result in tendon degeneration, although a causal relationship has not been conclusively established. Asymptomatic microscopic tendinosis has been documented in approximately one third of persons older than age 35. The source of pain in chronic tendon disorders is not clearly understood; certain biochemical compounds may irritate the pain receptors.
Distinct pathology can occur at the osteotendinous junction. In the skeletally immature child, tensile overload can lead to pathologic changes at the apophysis, with small avulsions from the apophyseal ossification center and resultant apophysitis. This process occurs most commonly at the tibial tuberosity (Osgood-Schlatter’s disease) and calcaneus (Sever’s disease). In adults, insertional tendinopathy can occur at the osteotendinous junction, with collagen fragmentation and disorganization and thickening of the fibrocartilage zone. Such changes are not infrequently seen at the Achilles’ tendon insertion site onto the calcaneus and at the rotator cuff insertion site onto the greater tuberosity.
Calcific tendinitis refers to a process that is distinct from tendinosis and degenerative tendon calcification. Calcific tendinitis is a common, self-limited process of unknown etiology, in which calcium hydroxyapatite forms in a tendon and then is ultimately spontaneously resorbed, with healing of the tendon. It occurs commonly in the rotator cuff tendons but has also been reported in other tendons, including the pectoralis major, deltoid, flexor carpi ulnaris, gluteus maximus and medius, and adductor magnus. Calcium hydroxyapatite deposition is often asymptomatic, but resorption can be associated with significant pain.
Calcific tendinitis is due to the deposition of calcium hydroxyapatite within a tendon; it may be the cause of symptoms or an incidental finding on radiographs.
A bursa is a synovial-lined structure that lies between a tendon and a nearby bony prominence or other compressive structure. The bursa facilitates gliding motion of the tendon through the surrounding soft tissue. Some bursae develop in utero and many are present at birth. Some bursae remain isolated, whereas others develop a secondary communication with a joint. Bursal anatomy can be variable, even at established anatomic sites. In addition, synovial-lined adventitial bursae may develop at any point in life, in response to local friction.
OSTEOARTICULAR IMAGING FEATURES OF TENDONS AND BURSAE
Radiographs
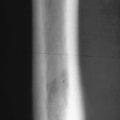
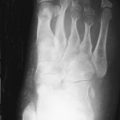
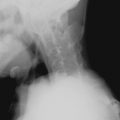
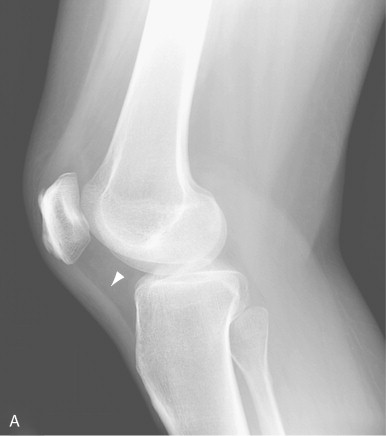
Although radiographs are of limited utility in imaging of tendons and bursae, they represent an important first step in the evaluation of symptoms, helping to detect associated ossification or bony pathology, exclude other causes of symptoms, and evaluate for potential complications. Tendons are visible on radiographs when they are surrounded by fat and lie tangential to the x-ray beam, as is the case with the Achilles’ and patellar tendons ( Figure 13-2, A , and Figure 13-3, A ). In these instances, they may be assessed for their thickness, uniform diameter, and the preservation of surrounding fat. With edema or fibrosis in the fat surrounding the tendon, however, the tendon contours will be effaced. Tendinosis or intrasubstance tearing may cause focal or diffuse thickening of the usual tendon contour ( Figure 13-2, B ), but, in general, these intrasubstance changes will not be visible radiographically. Gross disruption of the tendon may be evident as a result of marked changes in the normal contour of the tendon, often with tendon waviness ( Figure 13-2, C , and Figure 13-3, B ), but partial tears or nondistracted complete tears may not be apparent. When the tendon envelops a bony sesamoid or ossicle, retraction of the bony structure can provide radiographic evidence of tendon tear. This is seen most commonly with tears of the quadriceps or patellar tendons when they cause retraction of the patella but also is observed, less commonly, as a sign of tear in the posterior tibial or peroneal tendons of the hindfoot. Avulsion fractures at tendon insertion sites provide a similar radiographic sign of functional tendon disruption, which is seen, among other sites, at the flexor tendon insertion onto the middle phalanx of the hand (“volar plate fracture”), the triceps tendon insertion site onto the olecranon, and the Achilles’ tendon insertion onto the calcaneus ( Figure 13-4 ). Occasionally, the absence of a tendon may become apparent because of loss of its usual mass effect. Such is the case in chronic rotator cuff tear, when the rotator cuff outlet space is effaced and the humeral head abuts the undersurface of the acromion. Acromial humeral narrowing of ≤ 7 mm has a high correlation with rotator cuff tear ( Figure 13-5 ).


Narrowing of the space between the humeral head and the acromion to 7 mm or less usually indicates a chronic rotator cuff tear.
Tendon laxity or rupture may also be inferred from abnormal bone alignment in certain locations, such as flexion of the distal interphalangeal joint of the finger (“mallet finger”) indicating rupture of the extensor tendon ( Figure 13-6, A ) or pes planus on a standing view of the foot due to insufficiency of the posterior tibial tendon ( Figure 13-6, B ).


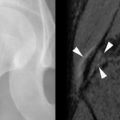
Radiographs may demonstrate calcifications within the tendon associated with insertional tendinopathy (e.g., at insertion of the Achilles’ tendon or rotator cuff) (see Figure 13-2, D ), heterotopic ossification associated with osteochondroses at a tendon-bone interface (e.g., Sindig-Larsen-Johanssen and Osgood-Schlatter changes at the proximal and distal edges of the patellar tendon, respectively) ( Figure 13-7 ), or metaplastic ossification within a degenerated tendon. Radiographs may also reveal bony findings that are associated with tendon pathology, such as an accessory navicular bone associated with a predisposition to posterior tibial tendon tears, nonaggressive periosteal new bone formation along the distal radius laterally occurring secondary to degeneration of the first extensor compartment tendons (DeQuervain’s tenosynovitis), similar periostitis along the distal tibia medially associated with posterior tibia tendon degeneration ( Figure 13-6, C ), or irregularity along the greater tuberosity of the proximal humerus, which can be seen with rotator cuff pathology. Of note, radiographs are instrumental in demonstrating and diagnosing calcium hydroxyapatite deposits associated with calcific tendinitis, a finding that is often overlooked or misinterpreted on magnetic resonance imaging (MRI) scans and can be the key to explaining a patient’s symptoms ( Figure 13-8 ).


Calcification may be less apparent on MRI than on radiographs.
Bursae are generally not visible radiographically. However, when a bursa abuts or is surrounded by fat and is tangential to the x-ray beam, it may become visible when distended. Distended pre-patellar, olecranon, and retrocalcaneal bursae may be visible on radiographs ( Figure 13-9 ). There may be edema in the surrounding fat. Bony osteolysis or reactive sclerosis may be visualized. The presence or absence of infection within a bursa cannot be determined on the basis of imaging. Calcification outlining the bursa suggests the presence of hydroxyapatite and associated calcific bursitis. Multiple loose bodies within the bursa may have migrated from a communicating osteoarthritic joint or may indicate a rare occurrence of intrabursal synovial osteochondromatosis.


Computed Tomography
Tendons, particularly tendon course and caliber, are well depicted by computed tomography (CT). However, CT images have less intrinsic soft tissue contrast than MRI or ultrasound and thus are less effective in depicting the full range of tendon pathology. As a result, CT is not considered the first-line cross-sectional modality for tendon imaging. Nonetheless, CT can provide considerable useful information regarding tendons and tendon pathology and may be of particular utility when questions involve soft tissue calcification or ossification or the relation between a tendon and bone or bone fragments or when MRI or ultrasound is not feasible. CT allows for very rapid, high-resolution imaging over a large field of view and is highly reproducible and operator independent. New generation multidetector scanners provide techniques that help minimize artifact from orthopedic hardware. Exposure to ionizing radiation remains a concern, particularly with repeat exams, but radiation exposure to extremities is generally better tolerated than radiation to the torso.
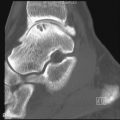
Tendons are more electron dense than muscle or fat on CT and therefore appear “bright” compared to muscle and fat. Density on CT is measured by Hounsfield units (HU) and tendons measure 75 to 115 HU, considerably more electron dense than muscle (55 to 60 HU) or fat (< 0 HU) and considerably less dense than bone (930 to 953 HU). On CT, normal tendons are seen as high-density structures, typically round, ovoid or flat, and smooth bordered and have a characteristic normal diameter ( Figure 13-10, A ). The tendon course can typically be traced from its musculotendinous origin to its insertion site. Tenosynovitis may be evident as well-demarcated lower-density material surrounding tendon along its course ( Figure 13-10, B ). Simple fluid measures < 20 HU, whereas hemorrhagic or proteinaceous fluid will show higher HU values. Tendon enlargement or attenuation can be detected. Chronic partial rupture or degeneration is seen as increased tendon diameter associated with diffuse or heterogeneous decreased tendon density (30 to 50 HU) ( Figure 13-10, C ). More severe tendon rupture may be visible as focal attenuation of the tendon. Changes in tendon attenuation can be identified, including internal low density indicative of tendon degeneration and/or intrasubstance tear and high density associated with tendon calcification or ossification ( Figure 13-10, D to F ). However, early tendon degeneration may not be detectable on CT. A complete tendon tear, with tendon retraction, may be evident by CT, but the presence of edema or fibrosis may obscure the tendon rupture. Rosenberg et al. studied 28 cases of suspected posterior tibial tendon tear using CT, categorizing the tendons as normal or as Type I (intact, enlarged, heterogeneous); Type II (attenuated), or Type III (complete transverse rupture with gap) tears, compared with surgery. Overall accuracy in detecting tendon tears was 82%. In 4 of 28 cases, CT identified the tendon rupture but underestimated the extent of tear, and, in one case CT failed to detect a type I tear. In general, CT is less effective than MRI or ultrasound in demonstrating intrasubstance tendon degeneration, longitudinal splits, partial tears, and tenosynovial fluid and less effective than MRI in demonstrating tendon contours in the setting of surrounding edema or fibrosis. However, tendon subluxation is readily identified on CT, as are bony abnormalities that might predispose to subluxation, such as a shallow retromalleolar groove in the distal fibula. CT also readily demonstrates tendon entrapment by fracture fragments ( Figure 13-11 ), bone spurs that might contribute to tendon pathology, and bony periostitis that is associated with tendon degeneration in the distal radius or tibia ( Figure 13-10, C ).


CT can demonstrate tendon tears but is less effective than MRI or ultrasound in demonstrating subtle abnormalities.
CT images are acquired axially, but, using newer generations of multidetector and volume CT scanners, the axial sections acquired are so thin that the resultant voxels are near-isotropic and can be reconstructed along any plane of interest (multiplanar reconstruction) while retaining high spatial resolution (see Figure 13-11 ). This is of particular utility for tendons that may follow an oblique or curved course. Images acquired in routine protocols can also be post-processed as three-dimensional (3D) volume rendered reformatted images, which help depict tendons in relation to their bony landmarks and have shown early promise for helping in the preoperative planning of tendon rupture repair ( Figure 13-12 ). Unlike MRI, the CT images can be obtained rapidly over a lengthy field of view. However, limitations regarding sensitivity for detection of tendon tear remain. In addition, to date, distal tendons in the hand, particularly on the extensor side, are not well demonstrated with this technique.

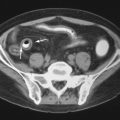
Normal bursae are generally not visible on CT. A distended bursa is visible as a discrete fluid or soft tissue density structure, in a characteristic location ( Figure 13-13 ). Simple fluid within the bursa measures shows low density, similar to water. Hemorrhage or proteinaceous fluid or pus measures greater than 20 HU. Thickened synovium yields variable density measurements, typically more than simple fluid. Following administration of intravenous (IV) contrast, several different enhancement patterns may be seen: (1) a non-inflamed fluid-filled bursa will demonstrate a thin rim of peripheral enhancement; (2) an inflamed fluid-filled bursa will demonstrate a somewhat thickened rim of enhancement; or (3) a bursa containing thickened synovium will show variable internal enhancement corresponding to the volume and distribution of hypertrophic synovial tissue present. Rare instances of intrabursal masses, such as pigmented villonodular synovitis or other soft tissue masses, may also demonstrate internal enhancement within the bursa. When there is edema, inflammation, or fibrosis in the tissue surrounding the bursa, bursal borders may be obscured. As with other modalities, the presence or absence of infection within a bursa cannot be determined on the basis of imaging. Calcification within the bursa may be due to calcific bursitis, synovial osteochondromatosis, or (in bursae that communicate with a joint) loose bodies. The CT imaging features of iliopsoas bursitis ( Figure 13-13, A ), greater trochanteric bursitis, anserine bursitis, radiobicipital bursitis, and adventitial bursitis of the scapulothoracic articulation have been described. Spence et al. noted that CT was less sensitive for detection of septae within bursae than ultrasound and less sensitive than MRI for detection of rice bodies.


Although a distended bursa may be detected on CT, the presence or absence of infection within a bursa cannot be determined by imaging.
Magnetic Resonance Imaging
MRI is an extremely effective method for imaging of tendons and bursae. Tendons and bursae throughout the body, both superficial and deep, can be imaged in their entirety. Unlike ultrasound, the technique is not operator dependent and interpretation skills are more broadly disseminated. Although MRI protocols vary from institution to institution, most protocols are well suited to the depiction of tendon and bursae and their attendant pathology. Tendinosis, partial and complete tears, tear size and associated muscle atrophy, tenosynovitis and paratenonitis, tendon subluxation/dislocation, insertional tendinopathy, and injury to the musculotendinous junction can be depicted. Bursal distension with fluid or synovitis can be demonstrated. Because soft tissue calcification and small bony fragments are not well depicted on MRI, correlative radiographs are an important adjunct to an MRI exam.
Radiographs can provide information that is helpful for MRI interpretation.
MRI is often performed at field strengths of 1.5T, but imaging is also performed on lower field strength magnets, on newer 3T magnets, and on dedicated extremity machines ranging in field strength from 0.2T to 1T. In general, high field strengths can be used to produce images of higher spatial resolution and/or shorter duration. 3T magnets are new to the market, and their clinical accuracy is only beginning to be evaluated. High-resolution imaging is dependent on the use of a local receiver coil, a specialized antennae designed to lie in close proximity to the tissue of interest in order to increase sensitivity for detection of signal. Use of a local coil allows for higher signal-to-noise ratio (SNR), which can be used to produce images with higher spatial resolution. In all instances, the anatomic area of interest must lie in the craniocaudad center of the magnet. In newer short-bore magnets, most patients’ knees and ankles can be imaged with the head outside the magnet. The wrist and elbow are optimally imaged with the patient lying prone and the arm extended overhead, but these joints can also be imaged with the patient supine and the arm down at the side. Dedicated extremity magnets allow the patient to sit outside the bore of the magnet while extending the limb of interest into the bore of the magnet and permit imaging from elbow to hand and from knee to foot. Because these are lower-field magnets, they trade-off lower spatial resolution against longer duration of exam. Depending on specifics of hardware and technique, subtle pathology and smaller structures may not be optimally visualized on these lower-field magnets.
The typical musculoskeletal MR examination lasts from 25 to 45 minutes. It consists of several individual sequences, each lasting 2 to7 minutes. Different sequences are designed to highlight different tissue characteristics. Typical sequences include proton density weighted or T1-weighted sequences to highlight anatomic structures and T2-weighted sequences or fat-saturated proton density weighted or T2-weighted sequences to highlight edema and fluid (as indicators of pathology). Sequences are obtained in multiple planes, typically axial, oblique coronal, and oblique sagittal planes, with planes optimized to depict the anatomy for the joint or limb of interest. The axial plane is often, but not always, the most useful for examining tendons. In some instances, an oblique axial plane may be used to help display a tendon in true cross section. Because the ankle tendons follow a curvilinear course when the ankle is at 90 degrees, the ankle may be imaged in plantar flexion in order to achieve true axial images through these tendons. For evaluation of the rotator cuff, each of the three planes—oblique coronal, oblique sagittal, and axial—may provide useful unique information. The use of an oblique sagittal image plane angled perpendicular to the curve of the tendons over the humeral head has also been described but yielded only minor improvements in diagnostic accuracy in that study. It is important to obtain thin section images with high spatial resolution and sufficient SNR in order to optimize the ability to detect small tendon abnormalities; small tendon tears or small foci of degeneration may not be visible on images obtained with insufficient resolution or SNR. Gadolinium contrast is not usually employed for MR evaluation of tendons. However, under certain circumstances, IV gadolinium contrast may be administered. Gadolinium contrast can help to distinguish cystic from solid structures and can help to better delineate tissues planes. In particular, gadolinium contrast can be used to distinguish fluid in a tendon sheath or bursa from hyperemic thickened synovium. Hyperemic synovium will enhance within the first few minutes after contrast administration; fluid will not. Contrast enhancement can be quantitated over time, providing indirect information about the degree of vascularity and the volume of interstitial space. MR arthrography can be performed by instilling dilute gadolinium contrast directly into a joint and is used to detect labral tears, articular cartilage defects, and—in some joints—partial and complete tendon tears ( Figure 13-14 ). When intraarticular gadolinium is used, fat-saturated T1-weighted images are employed to highlight the bright signal from gadolinium contrast. For certain exams, special positioning can aid in evaluating the tendon. For example, in the shoulder, external rotation provides optimal separation of the supraspinatus and infraspinatus tendons. In the ankle, imaging the Achilles’ tendon with the foot in plantar flexion can aid in assessing the potential for successful apposition of tendon tear edges when casted. When peroneal tendon subluxation is suspected, axial images of tendon can be obtained in both plantar and dorsiflexion. Although techniques for kinematic MRI of the joints have been described, they usually employ specialized frames that restrict the motion to a single plane and are not in common clinical use.


The normal tendon is characterized by low signal intensity on all sequences ( Figure 13-15 ) ( Table 13-1 ). Normal collagen microfibrils bind water tightly and, because there is a paucity of mobile protons, the signal from tendons is low. In pathologic states, the mobile water content of the tendon increases and higher signal areas appear within the tendon. However, high signal can be seen within the normal tendon on short echotime (TE) sequences, when the tendon lies at an angle of 55 degrees to the main magnetic field, due to magic angle artifact. (Magic angle artifact is seen in anisotropic structures such as tendons when they are oriented at 55 degrees to the main magnetic field, due to an effect governing molecular relaxation; this effect is dependent on the value of Cos , a value that approaches 0 at 55 degrees.) When present, magic angle artifact is seen in all imaging planes ( Figure 13-16 ). If the tendon position is adjusted within the magnet away from the 55-degree angle, the artifactual signal will be eliminated. When the main magnetic field extends along the bore of the magnet, as is the case with most contemporary 1.5T magnets, magic angle artifact can be seen in the rotator cuff tendon. It can also be seen in the peroneal and other tendons when the ankle is imaged with the toes pointing upward, but it is eliminated when the ankle is imaged in plantar flexion. (When the main magnetic field runs perpendicular to the bore of the magnet, as is the case in a smaller subset of magnets, the sites of magic angle artifact within tendons will be shifted.) Tendon appearance varies due to differences in intrinsic tendon morphology, such as when the patellar tendon is uniformly low signal, whereas the quadriceps tendon is seen as a laminated structure with alternating low and high signal layers. Fusiform, unipennate, bipennate, multipennate, bicipital, and triangular musculotendinous morphologies can be distinguished.

| Proton Density Weighted/T1-Weighted | T2-Weighted/Fat-Saturated T2- Weighted | |
|---|---|---|
| Normal tendon | Low signal (dark) * | Low signal (dark) |
| Tendinosis | High signal (bright) | Low or intermediate signal (dark) |
| Tendon tear | High signal (bright) | High signal (bright) |
| Tenosynovitis | Low signal (dark) surrounding the tendon | High signal (bright) surrounding the tendon |
| Magic angle artifact | High signal (bright) | Low signal (dark) |
* Signal on proton density weighted and T1-weighted images is similar but not exactly the same. Simple fluid will be lower signal on T1-weighted than on proton density weighted images, for example.


High signal, simulating an abnormality, can be seen within a normal tendon on short TE sequences, when the tendon lies at an angle of about 55 degrees to the main magnetic field. This is termed “magic angle artifact.”
Tendon degeneration can result in focal or diffuse tendon enlargement. In general, tendon degeneration appears as an area of high signal on proton density signal on proton density weighted or T1-weighted images and low to intermediate (but not as bright as fluid) on T2-weighted images ( Figure 13-17 ). The use of fat saturation on T2-weighted images can accentuate the high signal seen within the tendon and, as a result, may make it more difficult to distinguish advanced degeneration from a partial tear. Different forms of tendon degeneration can result in different MRI appearances: fibromatous or hypoxic tendinopathy tends to cause tendon enlargement with maintenance of normal low signal; mucoid degeneration causes tiny foci of high T2 signal, which can coalesce to form interstitial tears; lipoid tendinopathy is not well characterized on MRI but may account for diffuse tendon thickening and very subtle internal signal; and calcific or osseous tendinopathy may have low signal related to calcification or, alternatively, signal intensity similar to bone and bone marrow. As noted above, magic angle artifact can mimic tendon degeneration with high signal on proton density weighted or T1-weighted images and low signal on T2-weighted images and should be considered in the differential when the tendon is crossing at 55 degrees to the main magnet field. Ossification within the tendon can also mimic tendon degeneration with intermediate to high signal on short TE sequences and intermediate signal on T2-weighted images. For that reason, radiographs should be reviewed for ossification, either within the substance of the tendon or at its insertion site, and correlated with MR images.

Tendon degeneration and tears appear as an area of high signal on proton density weighted or T1-weighted images; on T2 weighted images, however, degeneration shows low to intermediate signal intensity, whereas tendon tears show high (fluid) signal.
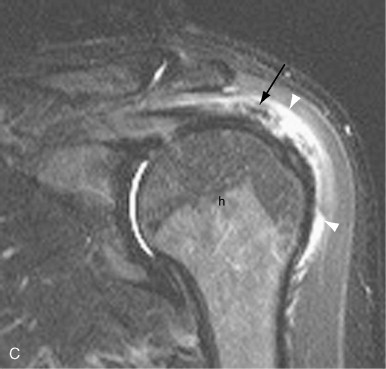
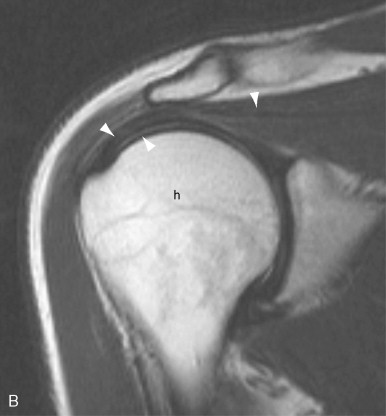
On MRI, tendon tears appear as high signal on both short TE (proton density weighted and T1-weighted) and long TE (T2-weighted) sequences ( Figure 13-18 ). Signal on T2-weighted sequences must be as high as simple fluid to constitute a tear. Tendon tears may be partial or complete. Partial tears may be contained within the substance of the tendon (intrasubstance tear) or may extend to the tendon surface ( Figure 13-19 ). Fraying of the tendon surface represents a form of partial tear. In the rotator cuff, partial tears may involve either the articular or bursal surface. In unusual cases, an intratendinous or intramuscular ganglion cyst may develop, providing a secondary sign of a partial tendon tear ( Figure 13-19, C ). The tear serves as a “one-way valve” allowing fluid to accumulate within the substance of the muscle, usually tracking within the tendon toward the musculotendinous junction. The ganglion cyst appears as a well-circumscribed, lobulated high T2 mass with variable signal on proton density weighted and T1-weighted images, which extends along the long axis of the tendon and muscle. Longitudinal splits refer to tendon tears that extend along the longitudinal axis of the tendon and may be partial or complete. A surfacing longitudinal tear may or may not demonstrate high T2 signal ( Figure 13-20 ). Complete tendon tears are seen as a transverse gap traversing the length of the tendon, with high T2 signal extending across the complete thickness of the tendon (see Figure 13-18 ). The torn tendon is often wavy and retracted. The tendon edges may be frayed and edematous, with a swollen appearance and high T2 signal. The surrounding tendon may show evidence of tendinosis and/or additional tears. When the tendon tear is acute, there is usually high signal in the surrounding soft tissues on both T1-weighted and T2-weighted images. High signal on T1-weighted images corresponds to hemorrhage, whereas high signal on T2-weighted images corresponds to edema or fluid. In the supraspinatus tendon, it is not unusual to have a complete tear through one portion of the tendon, while the remainder of the tendon is intact (e.g., a complete tear involving the anterior fibers of the distal supraspinatus tendon, with intact middle and posterior supraspinatus tendon fibers).


A “complete” rotator cuff tear involves the entire thickness of the tendon(s) from the bursal to the articular surface but not necessarily the entire width of the tendon(s) from anterior to posterior.
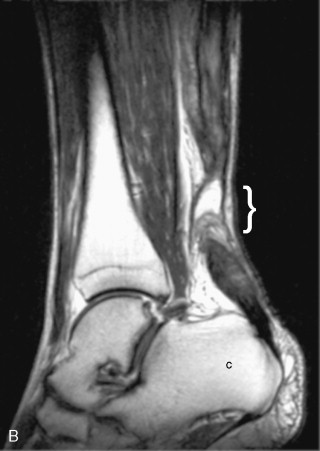
MRI allows for accurate characterization of the precise site and size of tendon gap. In a study of 16 patients with shoulder pain who underwent arthroscopy, Teefy and Rubin et al. found that MRI correctly identified 100% of complete rotator cuff tears and 63% of partial tears, with an overall accuracy of 87%. MRI correctly predicted the length (63%) and width (80%) of complete tears and the length (75%) and width (75%) of partial tears. However, the apparent size of the tear can be influenced by the position of the joint or limb. For example, the size of an Achilles’ tendon tear will be greater when ankle is imaged with the foot in neutral position or dorsiflexion than when the foot is plantar flexed. As patients may be treated with casting in plantar flexion, it may be helpful to image with the foot in plantar flexion; unless the tendon edges are apposed in plantar flexion, the tendon is unlikely to heal with casting alone. Chronic tears may be appreciated as nonvisualization of the tendon, typically without surrounding edema or hemorrhage. The chronically torn tendon may be atrophic and/or retracted ( Figure 13-21 ). Fibrosis may develop in or around the site of tendon tear and may limit retraction and obscure portions of the tear. Changes in the muscle associated with the torn tendon may be evident. Early changes of muscle atrophy may be seen as high signal edema on T2-weighted and fat-saturated T2-weighted images. Eventually, muscle mass will decrease and fatty infiltration of the muscle may be seen (see Figure 13-21 ). Prognosis for tendon repair is less favorable in the setting of muscle atrophy. It should be noted that similar changes can be seen due to post-denervation change or other forms of muscle injury. Description of tear size, background tendinosis, and muscle edema or atrophy is important information for surgical planning available from MRI scans.


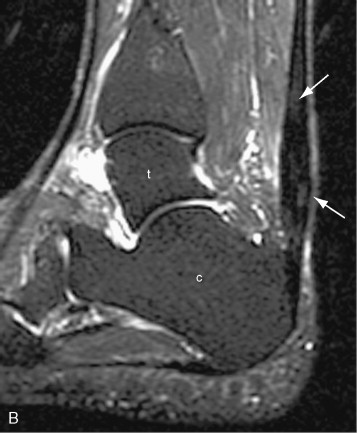
Paratenonitis refers to inflammation of the paratenon or fascial covering of a tendon (see Figure 13-17 ). The Achilles’ and patellar tendons, for example, are enveloped by a paratenon rather than a synovial sheath. In the Achilles’ tendon, the normal paratenon is a thin, homogeneous layer visible along the posterior, medial, and lateral aspects of the Achilles’ tendon, best seen on the axial images; it is clearly distinct proximally but becomes less distinct distally as it inserts onto the periosteum of the calcaneus. It is slightly higher in signal intensity than the normal Achilles tendon on T1-weighted and short tau inversion recovery (STIR) images. In some cases, the normal paratenon may be of high signal intensity in the middle third (longitudinally) and may have more prominent high STIR signal. In paratenonitis (also referred to as paratendonitis and paratendinitis or peritendinitis ), there is generalized inflammation in the pre-Achilles fat and in the soft tissues surrounding the tendon. This is seen as strand-like signal in the fat surrounding the tendon: low signal on T1- and proton density weighted sequences and high signal on T2-weighted sequences. The paratenon, seen as a curvilinear line visible posterior to the Achilles’ tendon, may become thickened. Areas of high T2 signal seen in the acute setting may progress to low signal scarring in the chronic setting. The underlying tendon may be normal or abnormal. Tenosynovitis (i.e., fluid and/or synovial thickening within the tendosynovial lining of the tendon) is seen as high T2 signal within a distended tendon sheath, surrounding a normal or abnormal tendon ( Figure 13-22 ). The normal synovial sheath may not be appreciable on MRI images or may appear as a thin structure outlining the tendon that is low signal on all sequences. In some tendons, such as the flexor hallucis longus tendon, a small amount of tenosynovial fluid may be a normal finding. High T2 signal within the tendon sheath may represent either simple fluid or thickened hyperemic synovium—these two entities can only be distinguished by administration of gadolinium contrast. When IV gadolinium is administered, thickened synovium will enhance very rapidly, whereas tenosynovial fluid will not. Synovitis may also be visible on nonenhanced T2-weighted images as small low signal “fronds” extending out at right angles from the inner surface of the synovial sheath. With fluid in the tendon sheath, the mesotenon may be visible as a thin low T2 signal, linear, tether-like strand extending from the surface of the tendon to the low signal synovial sheath. In stenosing tenosynovitis, two distinct appearances have been described: (1) the high T2 fluid column surrounding the tendon may develop scattered areas of narrowing—this pattern has been described in the flexor hallucis longus tendon ; or (2) in addition to tenosynovial fluid and internal debris, the fat immediately surrounding the tendons (peritenonous fat) becomes low signal, with blurring of the usual smooth borders of the tendon, and may show edema on fat-saturated T2-weighted images. This second pattern has been seen in the first extensor compartment tendons of the wrist, in the setting of DeQuervain’s tenosynovitis. Septic tenosynovitis may be indistinguishable from tenosynovitis related to noninfectious inflammatory or traumatic causes and therefore requires a high clinical vigilance to diagnose. In a classic presentation, there will be a disproportionate amount of complex fluid surrounding a tendon or tendons, but the volume or signal intensity of the fluid is not diagnostic. The tenosynovial fluid is often complex and demonstrates a thick rim of contrast enhancement, corresponding to inflamed proliferative synovium. There may be edema in the surrounding bones and soft tissues. MRI provides an overview to help localize the infection and assess its extent. Direct sampling is required to confirm the diagnosis and characterize the organism, and, if performed percutaneously, ultrasound guidance is most feasible. Loose bodies may be seen as nonspecific low signal debris within the synovial sheath on T2-weighted images or may have a characteristic ossific appearance with a thick low signal cortex peripherally and marrow signal within. Multiple ossific bodies of relatively similar sizes suggest the diagnosis of synovial osteochondromatosis. Signal intensity is variable, reflecting variation in the histologic composition of the “bodies.” In this case, radiographs may help to clarify the diagnosis. In inflammatory arthritides as well as chronic low-grade infectious synovitis, small fibrinous structures known as “rice bodies” may accumulate within the tendon sheath, together with marked synovial thickening—when present, they appear as small linear or ovoid intermediate to low signal structures on T1-weighted and T2-weighted images. Rice bodies are not calcified and do not demonstrate blooming.