Stroke is a leading cause of death and adult morbidity worldwide. By defining stroke symptom onset by the time the patient was last known to be well, many patients whose onsets are unwitnessed are automatically ineligible for thrombolytic therapy. Advanced brain imaging may serve as a substitute witness to estimate stroke onset and duration in those patients who do not have a human witness. This article reviews and compares some of these imaging-based approaches to thrombolysis eligibility, which can potentially expand the use of thrombolytic therapy to a broader population of acute stroke patients.
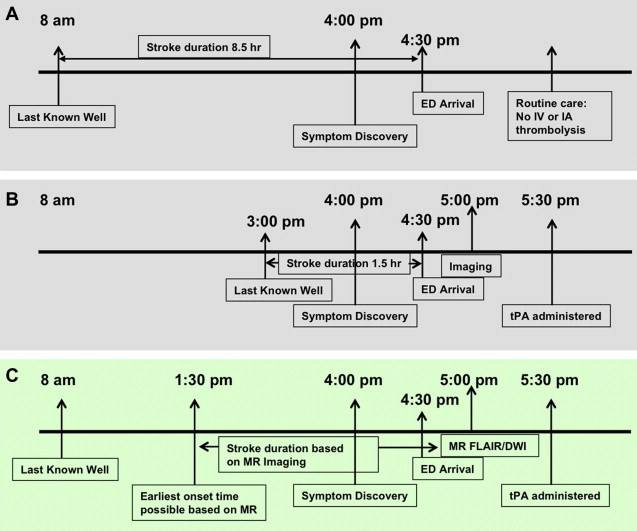
Stroke is the fourth leading cause of death, and the leading cause of serious long-term disability in the United States. Each year, approximately 795,000 people experience new or recurrent strokes; of these, 87% are ischemic. The economic cost of this devastating disease for 2009 was estimated to be $68.9 billion. The only current approved therapy for the treatment of acute ischemic stroke is intravenous (IV) alteplase or recombinant tissue plasminogen activator (rt-PA) administered within 3 hours from when the patient was last known to be well. More than a decade has passed since the US Food and Drug Administration (FDA) approved the use of IV rt-PA for the treatment of acute ischemic stroke. Yet, rt-PA is still underused worldwide and estimated to be given to less than 5% of patients. The main reasons for this low rate are attributed to the delay in patient arrival, and the conservative definition of time of stroke onset in cases of unwitnessed onset, which is the time the patient was last known to be well. In 2008, the results from the third study of the European Cooperative Acute Stroke Study (ECASS 3), a randomized, double-blind, placebo-controlled, clinical trial, showed that in a carefully selected population, rt-PA could be safely given to patients treated within 4.5 hours from symptom onset. Although this is a promising step toward expanding the use of rt-PA, according to the Paul Coverdell National Acute Stroke Registry Surveillance Report from 4 states (Georgia, Illinois, Massachusetts, and North Carolina), from 2005 to 2007, 57% of acute stroke patients arrived at the hospital with unknown time of symptom onset. Because thrombolytic therapy is based on the patient’s last known well time, these patients would be considered outside the treatment window. The key to offering thrombolytic therapy to patients with unwitnessed strokes is to clearly differentiate between the time when the patient was last known well and the time when the patient was discovered with symptoms. For witnessed strokes, these are one and the same. For strokes with unwitnessed onsets, the difference in times is unknown (by definition) and could be the difference between being eligible or ineligible for therapeutic intervention. Special cases of strokes with unknown onset are wake-up strokes, when there is no definite evidence that proves the strokes started before the patient woke up, and the stroke may have caused the patient to awaken. These patients are found in bed as opposed to on the floor or in the bathroom or kitchen. There are presumably no delays in bringing these patients directly to the hospital, whereas the patients with unknown onset time may have been left unattended at home for minutes to hours. If a technique existed that could reliably substitute for the human witness and provide evidence that the duration of the stroke was within the therapeutic time window (eg, <4.5 hours), then these patients could be considered for IV rt-PA therapy. Several stroke researchers have suggested that imaging, in particular specific magnetic resonance (MR) imaging findings, could provide such information, and therefore could help bracket the time of onset based on tissue changes. Fig. 1 shows an example of how imaging could potentially be used for triaging these patients for thrombolytic therapy. This article discusses the data supporting the use of imaging for selecting patients for thrombolytic therapy when precise stroke onset times are unavailable. First, background information on this population of stroke patients with unwitnessed onsets is presented, which includes a discussion of previous studies that investigated the feasibility of extending thrombolytic therapy. Imaging options that can potentially make giving rt-PA to this group safer are then investigated. One option is to use imaging as a surrogate for stroke duration and find techniques that can determine whether the patient is within the therapeutic time window or not. An alternative option is to use imaging as a surrogate for tissue viability. The idea of an MR imaging-based estimate of time of stroke onset is a separate, but closely linked concept of using imaging or other biomarkers to establish a “tissue clock” instead of a “wall clock” to identify candidates for intervention. The two distinct approaches are therefore discussed separately. Some of the proposed and ongoing clinical trials involving these patients are also briefly described.
Patients with unclear stroke onsets: background
The precise time from onset of symptoms to hospital arrival is not recorded or known for most patients with stroke. Further, an estimated 16% to 28% of patients with stroke awaken with symptoms. It was suggested early on by Marshall that for most of these patients, the strokes may have occurred between 12:00 am and 6:00 am , making many of these patients outside the therapeutic time window if hospital arrival is delayed until discovery in the morning. Marshall posited that nighttime decreases in blood pressure in patients with dysfunctional autoregulation may result in reduced cerebral blood flow (CBF). His suppositions were based on findings from 554 patients with nonembolic ischemic stroke. However, other studies performed across all stroke subtypes found that most strokes occur in the early morning, between 6:01 am and 12:00 pm . A retrospective study of 1272 patient datasets collected for the Trial of Org 10172 in Acute Stroke Treatment (TOAST), in which patients who awakened with symptoms (N = 323, 25% of the datasets) were analyzed separately, found only 7% of the 1272 patient dataset (N = 87) had onsets between 12:01 am and 6:00 am. A meta-analysis of 31 publications, involving 11,816 patients, reported similar results, with a 49% increased risk of stroke between 6:00 am and noon, and 35% decreased risk between midnight and 6:00 am compared with the other 18 hours. These observations have led many to conclude that there exists a circadian pattern in the frequency of stroke similar to that reported for myocardial infarction. This pattern may be partially explained by the circadian rhythm of blood pressure, cortisol secretion, blood viscosity, hematocrit, activated partial thromboplastin time, prothrombin time, and platelet aggregation. Implications of these findings are that many patients with wake-up stroke, whose last known well time is the night before, may with high likelihood have had their onsets around awakening and could therefore be treated safely with rt-PA, assuming they meet all clinical and imaging criteria for the on-label use of IV rt-PA.
Several studies have investigated radiological differences between patients with wake-up stroke and patients with nonwake-up stroke to determine whether MR imaging could play a role in triaging these patients. Fink and colleagues investigated apparent diffusion coefficient (ADC) differences between patients with well-known onset times and those who woke up with symptoms. In Fink and colleagues’ study, 364 patients were retrospectively examined from a prospective dataset consisting of 100 patients with wake-up stroke. There was no statistical difference between times seen from symptom discovery for the two groups (6.0 vs 5.9 hours, P = .83), but fewer patients with wake-up stroke were imaged within 3 hours of symptom discovery (29% vs 45%, P = .006). The rates of mismatch on diffusion-weighted MR imaging (DWI) and perfusion-weighted MR imaging (PWI) in both groups (82% vs 73%, P = .4) were similar. Clinical features (eg, National Institutes of Health Stroke Scale [NIHSS] score, age, gender) were not significantly different between the two groups ( P >.05). Using linear regression analysis, ADC values were found to be negatively associated with stroke onset time (β = −0.184, P = .10). ADC was lower in the wake-up stroke group compared with the nonwake-up group seen within 3 hours of onset (566 vs 665 μm 2 /s, P <.01).
There have also been several studies investigating the possible role of computed tomography (CT) in triaging patients with unknown onset times. Todo and colleagues researched differences on CT between patients with cardioembolic stroke imaged within 3 hours of symptom discovery. Patients were divided into 3 groups: patients with known times of onset (N = 46), patients with wake-up stroke (N = 17), and patients with unclear onset times who were not found on awakening (N = 18). The patients in the unclear onset time group presented with hypodense regions on CT more often than the wake-up stroke (56% vs 11%, P = .012) and known onset (56% vs 0%, P <.001) groups. Silva and colleagues examined group differences in CT angiography (CTA) and CT perfusion (CTP) between patients with known onset times (N = 420), wake-up strokes (N = 131), and unclear onset times, not including those with strokes on awakening (N = 125). The unclear onset time group had more severe strokes as measured by NIHSS (NIHSS score 8 [3–16], P <.01) compared with the known onset (NIHSS score 5 [2–11]) and wake-up stroke (NIHSS score 5 [2–11]) groups. The unclear onset group also presented with larger CTA source image (CTA-SI) lesion volumes (46.6 [0–220.8] cm 3 , P = .04) compared with the known onset (14.3 [0–137.4] cm 3 ) and wake-up stroke (14.4 [0–217.3] cm 3 ) groups. Presence of large-vessel intracranial occlusions was similar in the 3 groups (wake-up: 35%, known onset: 46%, unclear onset: 39%; P = .2). Frequency of CTP mismatch, defined as at least a 25% larger perfusion lesion on CBF maps compared with cerebral blood volume (CBV) maps, was not significantly different across the 3 groups (wake-up: 37%, known onset: 41%, unclear onset: 37%; P = .9) for the subset of patients who received admission CTP scans (N = 393).
Treating Patients with Wake-up and Unclear Onset Stroke
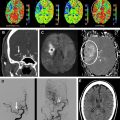
There have been attempts to treat patients with wake-up stroke prospectively, and these have shown some encouraging signs of efficacy in highly selected patients. Iosif and colleagues presented case reports in two patients with wake-up stroke. Both patients exhibited mismatches in lesion volumes between DWI and CBF maps and little or no signal intensity changes on fluid-attenuated inversion recovery (FLAIR) images, which are believed to be indicative of early-stage stroke. Based on these findings, both patients were given a combination of intra-arterial (IA) mechanical and IV chemical thrombolytic therapy (rt-PA) and both had a good outcome as measured by modified Rankin Scale (mRS score<2). Hellier and colleagues used CTP for deciding to treat two patients with unclear times of stroke onset with thrombolytic therapy. In this study, decision to treat with mechanical thrombectomy or IV rt-PA was based on subtle noncontrast CT (NCCT) hypodensity, and mismatch between CBV and time-to-peak (TTP) maps. For both patients, the TTP map indicated the entire ipsilateral middle cerebral artery (MCA) territory was at risk. As in the previous case study, both patients had good outcomes.
In addition to case studies, prospective studies involving larger patient cohorts have also been performed, and these have been less encouraging. A phase III trial of abciximab (AbESTT-II), a platelet glycoprotein IIb/IIIa inhibitor, which was stopped prematurely because of a significant increase in rate of symptomatic intracranial hemorrhage (sICH) and fatal intracranial hemorrhage (ICH) detected within 3 months, included a prespecified subgroup of patients with stroke who awakened with symptoms. The study involved 43 patients with wake-up stroke (22 treated with abciximab, 21 with placebo) and 758 patients with nonwake-up stroke. Increased sICH was found in the treated wake-up arm versus the treated nonwake-up group at 3 months (18.2% vs 4.8%, P = .03). Comparison of 3-month mRS outcomes between all 43 patients with wake-up and 758 patients with nonwake-up stroke showed that patients with wake-up stroke had significantly worse outcomes (wake-up, 9.3% good outcome; nonwake-up, 29.2% good outcome; P = .005) with even the placebo arm having poorer 3-month outcome (14% good outcome) compared with the nonwake-up group. The general baseline characteristics were similar between wake-up and nonwake-up groups treated with abciximab (eg, age, gender, NIHSS score) with the exception of previous history of stroke (wake-up: 36%, nonwake-up 14%; P = .04) and imaging. More abnormalities were observed on baseline CT (86% vs 59%) in the abciximab-treated wake-up stroke group than in the nonwake-up group despite criteria excluding patients with CT findings involving more than 50% of the MCA territory. Potentially, more restrictive imaging criteria may have improved patient selection in terms of safety and likely-to-benefit profiles.
A retrospective single-center study by Barreto and colleagues of patients with wake-up stroke who were treated with rt-PA on a compassionate basis suggest that rt-PA may be safely administered to a select population of patients with wake-up stroke. Patients were excluded if they presented with a hypodensity larger than one-third of the MCA territory on baseline noncontrast cranial CT scan, an imaging criterion more restrictive than that of AbESTT-II. Barreto and colleagues examined 46 rt-PA-treated and 34 non-rt-PA-treated patients with wake-up stroke as well as 174 on-label rt-PA-treated patients (treated within 3 hours from last known well). Of the 46 patients with wake-up stroke, 28 received IV rt-PA alone, 14 IA therapy alone and 4 combined full-dose IV rt-PA and IA treatment. The investigators found that the patients with wake-up stroke treated with thrombolytic therapy had a significantly higher rate of favorable outcome (discharge mRS score 0–2: 28% vs 13%, P = .006), but significantly higher mortality (15% vs 0%, P = .02) than nontreated patients with wake-up stroke. There was a 4.3% rate of sICH in the rt-PA-treated patients with wake-up stroke, compared with 0% in the non-rt-PA-treated group and 2.9% rate in the on-label-treated group. These differences were not statistically significant, likely because of the low incidence of sICH and small sample sizes involved. There was a higher rate of early changes on baseline CT (28% vs 12%; P = .009) and higher baseline NIHSS score (16 vs 11; P = .001) in the rt-PA-treated wake-up stroke group compared with the on-label-treated group. There were also more cases of cardioembolic strokes (44% vs 27%) in the treated wake-up stroke group, with fewer small-vessel (2% vs 14%) and unknown-cause (11% vs 23%) stroke subtypes compared with the on-label rt-PA-treated group. Imbalances in stroke subtypes and stroke severity may explain the slightly higher, but not statistically significant increased rates of sICH (4.3% vs 2.9%, P = .64) and mortality (15% vs 10%, P = .29) in the treated wake-up stroke group compared with the on-label-treated group. Rates of favorable outcome were statistically comparable (28% vs 48%, P = .64) between the two groups. The difference between mortality in the treated and nontreated wake-up stroke groups was attributed to greater stroke severity in the treated wake-up stroke group, because the more critically ill patients were more likely to receive rt-PA on a compassionate basis because of their expected poorer outcome without intervention. Since treatment was not randomized it is difficult to make definitive conclusions of safety and efficacy of rt-PA in patients with wake-up-stroke from this study.
A retrospective study of patients with unclear onset time by Cho and colleagues involved 3 medical centers in Korea. Cho and colleagues examined the outcome in patients who arrived more than 3 hours from last known well time, and therefore were ineligible for on-label rt-PA therapy, but who showed favorable characteristics on MR imaging and were therefore treated with either IV rt-PA if the patient arrived within 3 hours of symptom discovery or IA urokinase if the arrival time was within 6 hours of symptom discovery. An MR-favorable profile was defined as patients showing a mismatch in DWI and PWI lesion volumes and absence of pronounced FLAIR hyperintensities in tissue spatially coincident with the acute DWI lesions. Based on this definition, 32 patients with unclear onset times (including wake-up strokes) and 223 with known onset times were examined. No significant differences were found in rates of recanalization, early neurologic improvement (4-point or greater improvement in NIHSS score on Day 1 or Day 7), 24-hour to 48-hour sICH (6.3% vs 5.8%), and rates of 3-month favorable outcome (mRS score 0–1: 37.5% vs 35%; mRS score 0–2: 50% vs 49.3%) between the two groups, suggesting that thrombolysis can be safely administered to patients showing favorable MR imaging profiles. Furthermore, these MR imaging-selected patients with unclear onset time showed rates of favorable outcome comparable with patients with known onset time who received on-label IV rt-PA.
These preliminary results involving rt-PA administered to patients with unknown onset times are promising and suggest rt-PA can potentially be safely administered if careful selection of patients using neuroimaging criteria is performed.
Imaging-based triage for therapeutic intervention
The next steps for extending thrombolytic therapy to patients with unclear onset times are large-scale clinical trials in which treatment is decided based on admission neuroimaging profiles. In the studies discussed earlier, a variety of inclusion and exclusion criteria have been used (from simple NCCT to multiparametric CT and MR imaging- favorable profiles) with varying degrees of success and failure. Therefore, which imaging criteria are used is critical for safely treating patients with unclear onset or wake-up stroke. Two approaches can be used in deciding these criteria: one is to determine which imaging parameter or combination of parameters best correlate with stroke onset time, and hence serve as a surrogate for time from stroke onset, and the other is to establish which parameters best correlate with severity of tissue injury. There are arguments supporting either approach, although both approaches likely produce similar results because time from symptom discovery is a surrogate for ischemic injury. Instead of identifying a surrogate (ie, stroke duration) for tissue pathophysiology, one may argue that one should instead concentrate on measuring tissue viability, regardless of time of imaging from stroke onset. Although this argument has merits, thrombolysis is approved only for treatment based on a time window of 3 hours, and for a selected population 4.5 hours from last known well. This time restriction supports research efforts for investigating imaging surrogates of stroke duration. Both approaches are discussed here, first describing attempts at correlating imaging findings with onset time, and then efforts toward identifying salvageable tissue. The focus is on MR imaging patterns of early imaging changes. Correlative studies involving CT patterns in the hyperacute stage is beyond the scope of this article.
Image-based Markers of Stroke Duration
Experimental studies correlating imaging and stroke duration
In one of the first studies reporting DWI sensitivity to early stroke changes, Moseley and colleagues showed in an MCA stroke model in cats (N = 8) that the signal intensity ratio (SIR) of tissue in the ipsilateral MCA territory significantly increased on DWI within 1 hour after MCA occlusion (MCAO), whereas it stayed relatively unchanged on T2-weighted MR imaging (T2-WI) until 6 to 8 hours after MCAO. The hyperintense regions on DWI and T2-WI corresponded with regions of infarction identified by postmortem histology. In a transient MCAO model in rats (N = 18), Mintorovitch and colleagues showed that DWI became abnormal within 15 minutes, whereas T2-WI became abnormal at approximately 2 hours after occlusion. No significant change in T2-WI was observed until immediately after reperfusion. The observed T2-WI changes were likely because of vasogenic edema from reperfusion injury. With reperfusion, DWI and T2-WI hyperintensities resolved by 4 hours after reperfusion. Jiang and colleagues compared temporal ADC changes with histology after transient MCAO in rats (N = 14) using a neuronal grading score. Measuring MR imaging changes 0 to 2 hours during ischemia and 0 to 4 hours after restoration of perfusion, Jiang and colleagues showed that although ADC correlated well with neuronal grading score at 2 hours after MCAO before reperfusion, it correlated poorly at early time points and chronic time points (24, 48, 72, 96, and 168 hours) after reperfusion. Knight and colleagues examined temporal changes on DWI, proton spin density (PD), T1-weighted (T1-WI) and T2-WI with regional neuronal grading, neuronal counts and hemispheric neutrophil counts in an MCA stroke model in rats (N = 34) at 2, 4, 6, 8, 24, 48, 96, and 168 hours after MCAO. The investigators found that DWI was the only parameter to correctly identify tissue injured by ischemia within 4 hours, whereas T1-WI and T2-WI abnormalities were not visually apparent until after 8 hours after MCAO because of poor contrast-to-noise. ADC values were observed to first sharply decrease within 2 hours after MCAO in the most severely injured regions of the brain before pseudonormalizing at approximately 24 to 48 hours, whereas T1-WI and T2-WI signal intensity steadily decreased and increased, respectively, peaking at 24 hours, and PD signal intensity steadily increased, peaking at 48 hours.
Diffusion-positive, FLAIR-negative mismatch
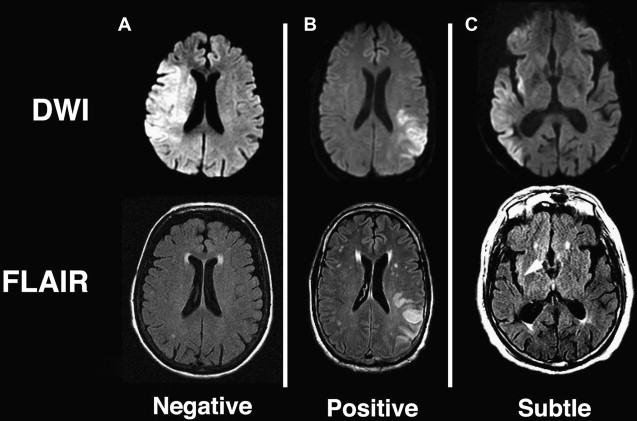
Findings from animal experiments support the hypothesis that mismatches between changes observed in DWI and T2-WI can be used to stage extent of ischemic injury. Based on previous experiments, it is reasonable to expect that tissue presenting with abnormal ADC and normal FLAIR or T2-WI represents tissue at an early stage of ischemia, likely within 3 to 4 hours of onset, and therefore has a high likelihood of recovering with restoration of blood flow. An example of such a DWI-positive FLAIR-negative mismatch is shown in Fig. 2 A, from a patient imaged within 1.5 hours of symptom onset along with a patient considered DWI-positive and FLAIR-positive imaged at 6.2 hours from when he was last known to be well. Recent studies have shown that patients seen within 3 to 4.5 hours from stroke onset present with minimal abnormalities on FLAIR imaging. Tables 1 and 2 summarize the results from these studies for identifying patients imaged within 3 hours and 4.5 hours, respectively. Thomalla and colleagues showed that in a consecutive series of patients with territorial infarction seen within 6 hours of stroke onset, negative FLAIR and positive DWI were 93% specific and 48% sensitive for classifying which patients were imaged within 3 hours of symptom onset. These investigators also found that patients who were FLAIR-positive (N = 65) were imaged significantly later (180 [120–240] minutes vs 120 [100–150] minutes; P <.001) and had more severe DWI Alberta Stroke Program Early CT Score (ASPECTS) (6 [5–7] vs 8 [6–9]; P <.001) compared with FLAIR-negative patients (N = 39). The frequency of FLAIR-positive scans increased from 50% in patients imaged within 3 hours to 93.3% for patients imaged at 3 to 6 hours. Ebinger and colleagues reported that for patients with DWI-positive lesions greater than 0.5 cm 3 , FLAIR-negative scans were 80% specific and 51% sensitive for patients imaged within 3 hours. Aoki and colleagues showed in MR imaging studies acquired within 24 hours from stroke onset that DWI-positive and FLAIR-negative scans were 83% sensitive and 71% specific for identifying stroke onsets within 3 hours. Petkova and colleagues showed that for patients imaged within 12 hours of stroke onset, FLAIR-negative scans were 82% sensitive and 97% specific for identifying patients imaged within 3 hours of stroke onset (N = 63). When taking into consideration large DWI abnormalities with subtle FLAIR abnormalities limited to the cortex (for example see Fig. 2 C) and classifying those to be FLAIR negative, results improved to 94% sensitivity with the same 97% specificity. The reduced specificity in Ebinger and colleagues’ study compared with the other 3 studies may be because of the milder strokes investigated, involving small lesion volumes (1.47 [0.49–4.33] cm 3 ), although some differences could be because of the use of a 3-T magnet for Ebinger and colleagues’ study, whereas the others used 1.5-T systems. All 4 studies are limited by being retrospective single-center studies; hence, the generalizability of the results have been questioned, despite consistency with another. This situation stems in part from poor interrater agreement (κ = 0.29) reported by Thomalla and colleagues compared with good (κ = 0.65) to excellent agreement (κ = 0.97) reported by Aoki and colleagues and Petkova and colleagues, respectively. The differences in these studies may be because of the use of 4 raters in Thomalla and colleagues’ study (for which 2 of the raters were neurologists and 2 were neuroradiologists) and only 2 raters with similar training in Aoki and colleagues’ (neurologists) and Petkova and colleagues’ (neuroradiologists) studies. There may also have been differences in the level of training and instruction provided to the readers before evaluation of images. The observational PRE-FLAIR study tests the generalizability of the preliminary results of Thomalla and colleagues by investigating on a multicenter basis the performance of combining FLAIR with DWI as a surrogate marker for lesion age. The results of this study should address concerns of reproducibility of these findings across different scanners using diverse imaging protocols.
| Author Year | Admission NIHSS Score (Interquartile Range) | Time Range (h) | MR Imaging Scans | Studies Within 3 h (%) | Sensitivity (%) | Specificity (%) | κ (Readers) | Field Strength (T) (Manufacturer) |
|---|---|---|---|---|---|---|---|---|
| Thomalla et al 2009 | 14 (8–17) a | 0–6 | 101 | 71 (70) | 48 | 93 | 0.29 (4) | 1.5 (Siemens) |
| Ebinger et al 2010 b | 4 (1–7) a | 0–12 | 71 | 41 (58) | 51 | 80 | NA | 3 (Siemens) |
| Aoki et al 2010 | 5 (2–11) | 0–24 | 361 | 140 (39) | 83 | 71 | 0.65 a (2) | 1.5 (General Electric) |
| Petkova et al 2010 | 11 c | 0–12 | 130 | 63 (48) | 82 | 97 | 0.97 (2) | 1.5 (General Electric) |
a All patients including DWI-negative studies.
b Patients with DWI lesions >0.5 cm 3 .
c Mean NIHSS score calculated from Table 1 in Petkova and colleagues.
| Author Year | MR Imaging Scans | Studies Within 4.5 h (%) | Sensitivity (%) | Specificity (%) |
|---|---|---|---|---|
| Thomalla et al 2009 | 101 | 92 (91) | 38 | 89 |
| Ebinger et al 2010 , a | 71 | 51 (72) | 49 | 90 |
| Aoki et al 2010 | 361 | 212 (59) | 74 | 85 |
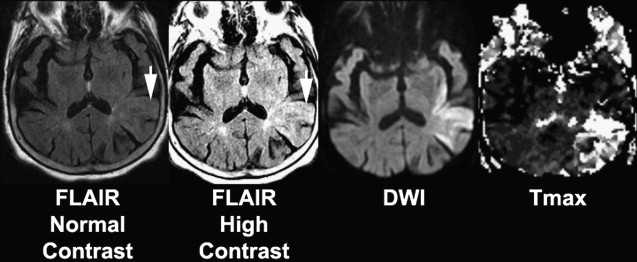
Whether a FLAIR lesion is considered negative or positive, and hence an early-stage or late-stage stroke, likely depends on the degree of contrast that is used to display the image ( Fig. 3 ) and may explain the varying degrees of consensus reported across studies. This observation has led to the investigation of relative signal intensities (rSI) or SIRs of FLAIR voxels coincident with abnormal DWI with respect to normal contralateral voxels as a predictor of stroke age. Using a FLAIR SIR of tissue in abnormal DWI to mirrored normal tissue in the contralateral hemisphere, Petkova and colleagues found that classifying patients with less than or equal to 7% increase in SIR as “early” resulted in 90% sensitivity and 92% specificity in identifying patients imaged within 3 hours from symptom onset. Ebinger and colleagues found that FLAIR SIR poorly correlated with time from stroke onset with a Spearman correlation coefficient of −0.152 ( P = .128). In contrast, Petkova and colleagues found a significant correlation between FLAIR SIR and time from stroke onset with a Pearson’s coefficient R = 0.63 ( P <.001). The discrepancies in the results of the 2 studies may be partly explained by differences in the methodology. Ebinger and colleagues correlated rSI based only on FLAIR lesions, whereas Petkova and colleagues measured SIR based on back-projected DWI lesions, which resulted in the inclusion of tissue that was FLAIR negative, leading to lower SIR measured in early-stage stroke, and significant correlation of SIR with respect to onset time. The differences in results may also be because of the more severe strokes involved in Petkova and colleagues’ cohort (which excluded patients with NIHSS score ≤3) compared with Ebinger’s cohort (median NIHSS score 4 [interquartile range 1–7]).
Advanced neuroimaging markers
In addition to DWI-positive and FLAIR-negative imaging, investigators have proposed using advanced imaging sequences that may provide better prediction of stroke duration. A study by Siemonsen and colleagues proposed using quantitative T2 (qT2) mapping for predicting time of stroke onset in place of the qualitative assessment currently available with FLAIR imaging and T2-WI. Much of the experimental literature supporting T2 as an accurate marker for stroke duration is based on quantitative T2 imaging. Using a triple-echo T2 sequence in 36 patients imaged within 6 hours of stroke onset, the investigators found that the predictive accuracy of qT2 for identifying patients imaged within 3 hours of onset was 0.794 compared with 0.676 using FLAIR. This finding suggests that qT2 may provide a more objective metric for identifying early lesions than afforded by visual assessment of FLAIR lesions.
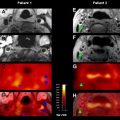
Sodium MR imaging has been shown to increase linearly with stroke onset time 2 to 7 hours after MCAO in rats and 0 to 6 hours after MCAO in nonhuman primate models. For human studies, sodium MR imaging performed more than 24 hours from stroke onset (N = 31) showed mean tissue sodium concentrations greater than 70 mmol/L, suspected to be a threshold for identifying infarcted tissue. Another study in patients imaged between 4 and 104 hours (N = 21) also found that sodium imaging SI nonlinearly increased with stroke duration. Within 7 hours of stroke onset, the increase was noted to be 10% or less, whereas beyond 9 hours from symptom onset the rate more than doubled to 23%, saturating at approximately 48 hours. Analysis of sodium changes in the area of DWI and PWI mismatch in 9 patients imaged 4 to 32 hours after onset showed no changes. However, in the DWI lesion for these patients, sodium MRI SI was found to increase with stroke duration after 17 hours but showed no significant difference for studies within 7 hours. These results have led some to speculate that patients who present with minimal abnormality on sodium imaging could be safely treated with reperfusion therapy.
T 1ρ has also been shown to correlate with time of symptom onset in experimental rat models of stroke imaged up to 7 hours after onset. T 1ρ has been found to correlate with regions of irreversible ischemia in models of transient stroke, increasing within minutes after occlusion. Because T 1ρ is less affected by blood-oxygenation-level–dependent effect than T2, T 1ρ increases earlier than T2. In comparison, T2 images acquired simultaneously with the T 1ρ were shown to first decrease within minutes after stroke, consistent with reports in human patients with stroke, before increasing. This very early decrease in T2 may contribute to the specificity of FLAIR-negative scans for identifying early-stage stroke.
Image-based Markers of Tissue Salvageability
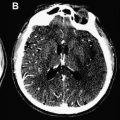
Beyond serving as a surrogate for stroke duration, many investigators postulate that imaging can be used a marker of tissue salvageability. A few studies have explored this hypothesis. Studies have shown that MR imaging-based thrombolysis selection improved safety profiles irrespective of time window. ECASS 3 reported that in a carefully selected population, rt-PA could be safely administered to patients treated between 3 and 4.5 hours since last known well. Even with this expanded time window, by defining onset of stroke symptoms in the most conservative manner, namely using the time the patient was last known well, many patients whose onsets are unwitnessed are ineligible for IV rt-PA therapy even if their true time of onset (if it could be established) would qualify them for treatment. This situation has led some to propose the use of a “tissue clock,” in place of a “wall clock,” for determining treatment options for patients because time is essentially a surrogate for tissue injury. Welch and colleagues speculated that histopathophysiologic changes in human stroke can be noninvasively tracked by monitoring changes in MR imaging profiles. These investigators’ hypothesis was based on imaging findings from experimental animal models of stroke for which times of stroke onset were well defined and histopathology samples were available. Based on animal experiments described earlier, Welch and colleagues formulated a tissue signature model combining MR imaging changes to predict histopathology after stroke. The investigators describe six MR imaging signatures that can be used to characterize degree of tissue injury and chance of recovery ( Table 3 ). As can be noted from the table, the DWI-positive and FLAIR-negative pattern proposed as a surrogate for early stroke onset is consistent with Signature B, which is representative of not only early-stage stroke but tissue with the greatest likelihood of recovery with reperfusion. Fig. 4 shows an example of these temporal changes on DWI, ADC, and FLAIR images from a 54-year-old patient imaged within 2.9 hours since last known well. FLAIR is a T2-WI with signal from cerebrospinal fluid suppressed, which improves lesion conspicuity. Also shown is the admission NCCT for comparison. For the acute scans, DWI and ADC are clearly abnormal, whereas NCCT appears negative and the FLAIR shows a subtle lesion. Over time, the lesion becomes more conspicuous on FLAIR, whereas it pseudonormalizes on ADC. ADC values for human stroke have been observed to pseudonormalize approximately 1 to 2 weeks after onset for patients not given reperfusion therapy, with maximal T2-WI lesion volumes observed at approximately 1 week, before stabilizing at approximately 30 days. The observed differences in ADC and T2-WI lesion evolutions between stroke in humans and experimental animal stroke models are likely because animal models are imprecise replicas of human stroke, in which ADC and T2-WI changes depend on often unmodeled clinical factors such as age, gender, and stroke subtype. Furthermore, because both ADC and T2-WI temporal changes have been shown to differ with severity of ischemic insult, variations in collateral blood flow can contribute to these discrepancies. In our example (see Fig. 4 ) ADC appears pseudonormal by day 2 in some regions (although T2 is abnormal, as seen on FLAIR images).
Related posts:
 Imaging Acute Stroke is Rapidly Evolving
 Arterial Spin Label Imaging of Acute Ischemic Stroke and Transient Ischemic Attack
 MR Perfusion Imaging in Acute Ischemic Stroke
 Intra-arterial Stroke Therapy: Recanalization Strategies, Patient Selection and Imaging
 Noninvasive Carotid Artery Imaging with a Focus on the Vulnerable Plaque
 ASPECTS and Other Neuroimaging Scores in the Triage and Prediction of Outcome in Acute Stroke Patients
Stay updated, free articles. Join our Telegram channel

Full access? Get Clinical Tree


