Fig. 1
Bony cortical changes with age. a Frontal hand radiograph of a 18-year-old woman shows normal cortical thickness in all the bones. b Frontal hand radiograph of a 40-year-old woman shows mild medullary widening due to endosteal resorption. This is age-related. c Frontal hand radiograph of a 101-year-old woman shows significant thinning of the cortex, in addition to the old osteoporotic fractures of the distal radius and ulna
3.2 Trabecular Bone
Trabecular bone comprises the deeper part of the bone and is arranged as a lattice-work of thin sheets of varying thickness, with the interstices containing bone marrow or fat (Eriksen et al. 1994). The trabecular bone is most prominent in the axial skeleton, especially the spine (Bailey et al. 2000), and the distal aspect of the appendicular long bones, particularly the proximal end of femur and the distal end of radius. Trabecular bone has a greater surface area and compared to cortical bone, responds faster to metabolic changes (Grampp et al. 1997). Loss of trabecular bone usually occurs in a typical sequential fashion. Non-weight-bearing trabeculae are lost first. The weight-bearing trabeculae may appear prominent due to the loss of the rest of the trabeculae, and may become stronger and thickened.
Bone mass decreases with age. The loss of bone mass depends upon the rate of bone loss and also the peak bone mass attained in early life. Men have a greater peak bone mass and hence, the incidence of osteoporosis is less. The factors which influence peak bone mass include dietary calcium, sex hormone status, nutrition, physical activity, and genetic factors.
4 Radiography: Technical Considerations
The amount of X-ray absorption increases with the third power of atomic number (Wolbarst 1993), hence the absorption is directly proportional to the amount of calcium. Reduction in the bone mass or reduction in the calcium causes decrease in the absorption of the X-rays, resulting in increased lucency or radiolucency of the bones. Prediction of bone density by radiographs alone is poor when compared to standard densitometry, especially in the early stages (Epstein et al. 1986; Finsen and Anda 1988). Detection of osteopenia is possible only after 20–40 % of bone mass is lost (Grampp et al. 1997).
Many technical factors and patient factors (Heuck and Schmidt 1960; Jergas 2008) also interfere with the appearance of the bone quality on radiographs (Table 1). Hence, radiographs can assess gross morphology, presence of increased translucency, cortical changes, changes in the trabeculae and fractures, but cannot accurately quantify the degree of osteoporosis. The interobserver variability of assessing the density and detection of osteopenia is significant (Epstein et al. 1986; Williamson et al. 1990). Recently, digital radiography has increasingly been used to evaluate osteoporosis (Hauschild et al. 2009). However, it provides no significant benefit compared to conventional radiographs (Wagner et al. 2005).
Technical factors |
|---|
Exposure time |
X-ray tube—anode, voltage |
X-ray beam filtration |
Film characteristics—e.g. speed, type of the screen, the emulsion |
Patient factors |
|---|
Density or thickness of the bone |
Mineral content |
Thickness of the soft tissue |
Amount of scatter |
5 Classification of Osteoporosis
Osteoporosis can be broadly classified as primary and secondary osteoporosis. There are however various other classification systems.
5.1 Primary Osteoporosis
Primary osteoporosis mainly occurs due to advancing age and decrease in sex hormones (Albright 1947; Riggs and Melton 1983, 1986; Khosla et al. 2011). Primary osteoporosis can be subclassified into post-menopausal (Type I) and age–related or senile (Type II) osteoporosis.
5.1.1 Post-Menopausal (Type I) Osteoporosis
This is mainly due to estrogen deficiency after menopause and results in accelerated loss of trabecular bone, with increase in the risk of fractures, especially in the spine and wrist and to a lesser extent, in the hips. This is followed by a phase of slower bone loss, affecting mainly the cortical bone. This occurs along with decrease in number of osteoblasts and rate of bone formation, all of which contribute to the age-related osteoporosis.
5.1.2 Age-Related or Senile (Type II) Osteoporosis
With advancing age, the rate of bone formation decreases, resulting in proportionate loss of cortical and trabecular bone (Riggs and Melton 1983, 1986). However, women are more prone as men acquire more bone during puberty, and due to abrupt absence of estrogen, women tend to lose more bone. Fractures commonly occur in the hip and proximal aspect of long bones, such as the tibia, humerus, and proximal femur. Elderly patients, especially those residing in nursing homes, have a greater risk due to certain factors, such as cognitive impairment, gait and balance disorders, weakness, decreased acuity of vision and medications. 85 % of elderly older than 85 years have osteoporosis. Hip and non-vertebral fractures are approximately three times more common in this population (Vu et al. 2006).
5.2 Secondary Osteoporosis
Secondary osteoporosis is defined as bone loss that results from specific, well-defined clinical disorders (Fitzpatrick 2002). There are numerous causes of secondary osteoporosis (Anil et al. 2010), which include genetic or storage disorders, endocrine disorders, disorders of the gastrointestinal tract, medication-induced osteopenia/osteoporosis, malignancy and restricted mobility (Table 2). Approximately 20–30 % of post-menopausal women and 50 % of men with osteoporosis have secondary causes of osteoporosis (Fitzpatrick 2002). Finding the exact cause of osteoporosis is necessary for appropriate treatment and prognosis.
Hormone-related disorders |
|---|
Hyperparathyroidism |
Corticosteroid-induced osteoporosis. |
Rickets/osteomalacia |
Gonadal insufficiency (primary or secondary) |
Hyperthyroidism |
Type 1 diabetes mellitus |
Gastrointestinal disease |
|---|
Celiac disease/malabsorption syndromes |
Chronic cholestatic diseases |
Gastrectomy |
Inflammatory bowel disease |
Parenteral nutrition |
Primary biliary cirrhosis |
Severe liver disease |
Marrow-related disorders |
|---|
Hemophilia |
Leukemia |
Lymphoma |
Mastocytosis |
Multiple myeloma |
Pernicious anemia |
Sickle cell anemia |
Thalassemia |
Storage disorders |
Genetic disorders |
|---|
Hypophosphatasia |
Osteogenesis imperfecta |
Miscellaneous causes |
|---|
Organ transplantation |
Heparin-induced osteoporosis |
5.3 Other Classifications
Osteoporosis can also be classified according to distribution into generalized or regional forms (Anil et al. 2010). The former can be primary or secondary osteoporosis which cause generalized loss of the bones, whereas the latter involves a particular region or bones of one limb. Examples include migratory osteoporosis, transient osteoporosis, Sudeck’s reflex sympathetic dystrophy, and osteoporosis secondary to infection and inflammatory arthritis.
Other rare unclassified types of osteoporosis include idiopathic osteoporosis (Bordier et al. 1973; Pacifici et al. 1990), which is a reversible condition seen in middle-aged men that is associated with rapid bone turnover. The exact etiology is unknown, although increased interleukin-1 and pulsatile increase in parathyroid hormone are hypothesized (Harms et al. 1989). A form of idiopathic osteoporosis that can also occur in children, and is known as juvenile idiopathic osteoporosis (Smith 1995), in which compression fractures of the spine and fractures of metaphysis of long bones have been reported.
6 Role of Radiographs in Osteoporosis
The role of imaging in osteoporosis is to achieve an early diagnosis so that appropriate treatment can be initiated early (Keen 2007). Radiography is not the mainstay in the diagnosis of osteoporosis. Although quantification of bone density is difficult with conventional radiographs, they are often required along with DXA or MR imaging to:
1.
Confirm or rule out fractures,
2.
Detect concomitant or pre-disposing abnormalities such as osteoarthritis,
3.
Aid in the diagnosis of secondary causes such as Cushing’s disease or hyperparathyroidism, although the appearance in majority of the conditions remains similar (Anil et al. 2010).
6.1 Main Radiographic Findings
The main radiographic findings of osteoporosis are altered trabecular pattern, cortical thinning, and increased radiolucency. Fractures and deformities need to be assessed radiographically, with failure to diagnosis fractures being a problematic area.
6.1.1 Altered Trabecular Pattern
Compared to cortical bone, cancellous bone responds faster to metabolic stimuli. The trabeculae of the cancellous bone are laid down corresponding to the compressive and tensile forces acting on it. The trabeculae can be well appreciated in bones, such as the distal radius, calcaneum, and femoral neck (von Meyer 1867; Benhamou et al. 1994; Link et al. 1999). The trabeculae which are not involved in weight-bearing are lost first. The primary trabeculae or the weight-bearing trabeculae become thickened, possibly due to a compensatory mechanism or to callus from microfractures (Fig. 2). Later in the advanced stage, even the primary weight-bearing trabeculae are lost, resulting in the translucent appearance of bone on radiographs (Vernon-Roberts and Pirie 1973; Geraets et al. 1990).
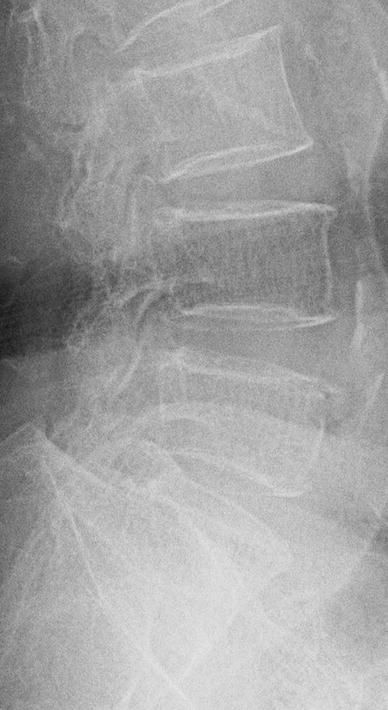
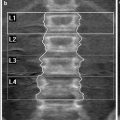
Fig. 2
Lateral lumbar spine radiograph of a 60-year-old woman shows prominent vertical trabeculae
6.1.2 Cortical Thinning
Involvement of the cortical bone occurs at three sites, namely: endosteal, periosteal, and intracortical (Grampp et al. 1997). In physiological remodeling of bones, the activity affects both the endosteal and periosteal surfaces. However, in involutional osteoporosis, it predominantly involves the endosteal surface, leading to thinning of the cortex. The response of endosteal, periosteal, and cortical resorption differs according to the etiology (Meunier et al. 1972; Genant et al. 1973). For example, in hyperparathyroidism, subperiosteal resorption can be seen in the radiographs as irregularities or erosions in the outer surface of the metacarpals. Intracortical bone resorption can be seen in the inner aspect of the cortex as striations or trabaculations, which are also features of hyperparathyroidism.
6.1.3 Increased Radiolucency
The bone density is directly proportional to the absorption of the X-rays and increases with the third power of atomic number (Wolbarst 1993). In osteoporosis, the decreased mineralization results in reduced absorption with resultant increased lucency of the bone (Fig. 3). There should be approximately 20–40 % bone loss for increased radiolucency to appear on radiographs (Ardran 1951; Harris and Heaney 1969; Epstein et al. 1986; Finsen and Anda 1988).
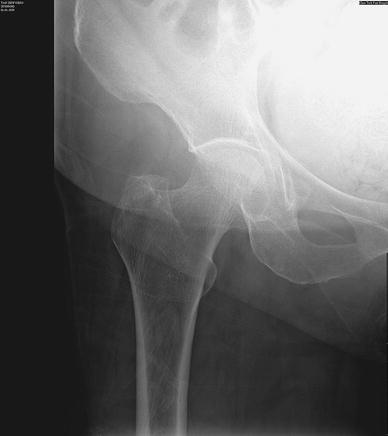
Fig. 3
Frontal radiograph of the right hip shows generalized increased bone radiolucency
6.1.4 Fractures and Deformities
6.1.5 Failure to Diagnose Fractures
Asymptomatic fractures are often missed on routine radiographs and the false negative rate may be very high, in the range of 29–45 % (Gehlbach et al. 2000; Delmas et al. 2005, Lems 2007). Lems (2007) highlighted three important causes for missing the fractures, especially in the vertebral column:
1.
Lack of clinical symptoms, unlike the pelvis or hips, and these occur during routine activities such as walking or climbing stairs,
2.
Overlooked on routine radiographs,
3.
Presence of more severe pathologies such as malignancy.
Improvement of detection of the fractures can be achieved by educating the radiologists to differentiate fractures from other pathologies which mimic fracture such as degenerative disease, and ankylosing spondylitis. The “Vertebral Fracture Initiative”, an educational program from International Osteoporosis Foundation, is one such example to help educate radiologists (Lems 2007).
6.2 Involvement of Specific Regions
6.2.1 Spine
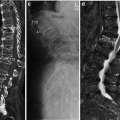
Radiography continues to play an important role in evaluation of osteoporosis of the spine, especially for the assessment of bony outline, including the endplates, alignment, vertebral height, and for fractures. The lateral view of the thoracic and lumbar spine is the most useful projection (Figs. 4 and 5). MR imaging of the spine can be used to detect acute fractures and also differentiate involutional osteoporosis from metastatic disease, if radiographs are equivocal.
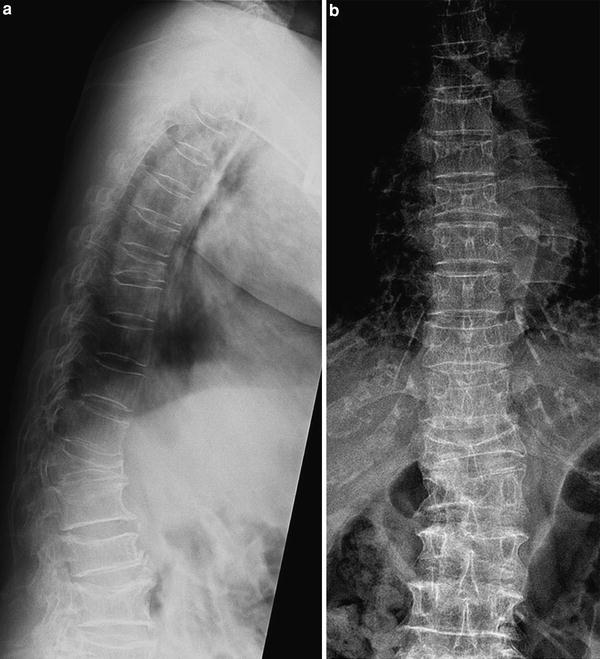
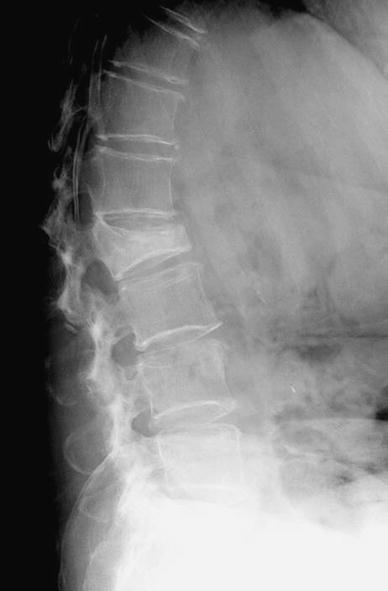
Fig. 4
a Lateral and b frontal radiographs of the thoracic spine in a patient with osteoporosis show generalized osteopenia and resultant severe deformities in multiple thoracic vertebral bodies due to compression fractures
Fig. 5
Lateral radiograph of the lumbar spine shows anterior wedge compression fracture of L2 vertebral body. The apparent sclerosis in the involved vertebral body is due to healing. The rest of the vertebral bodies appear osteopenic
The signs which favor osteoporosis rather than metastasis include (Jung et al. 2003):
1.
Hypointense band on T1- and T2-weighted images,
2.
Sparing of normal marrow signal intensity of the vertebral body,
3.
Retropulsion of the posterior bone fragment,
4.
Compression fractures at multiple levels.
6.2.2 Pelvis and Hips
The prominent sites in the pelvis and hips include the iliac blades, femoral neck and greater trochanter, pubis and supraacetabular region. Most visible trabecular changes are present at the proximal end of the femur (Fig. 6). Thinning of the cortex is usually seen at the iliac crests, pubic rami, ischia, and proximal femur (Anil et al. 2010).
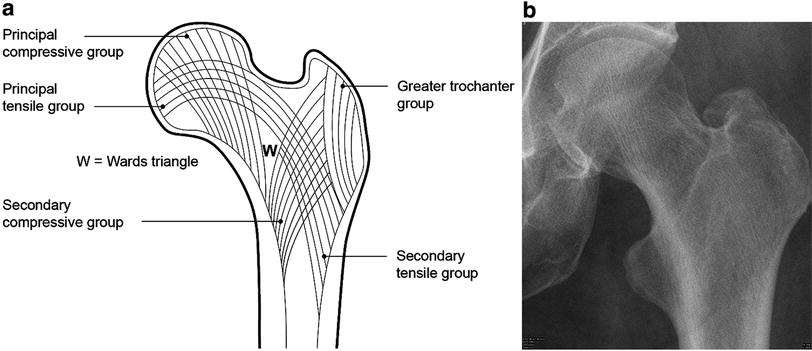
Fig. 6
Trabecular patterns in the proximal femur. a Line diagram shows the various groups of trabaculae and Ward’s triangle. b Left hip radiograph of a normal adult shows the various trabacular groups and Ward’s triangle
6.2.2.1 Proximal Femur
Trabeculae in the femur can be divided into five groups based on the orientation and function (Fig. 6). The principal compressive group trabeculae are the uppermost trabeculae and thicker than the rest of the trabeculae. These extend as curved lines from the medial aspect of the metaphysis to the superior aspect of the femoral head. The secondary compressive group arises near the lesser trochanter and curves upwards laterally toward greater trochanter and upper neck in a fan-shaped manner. These are usually thin and sparse. The greater trochanteric group is situated in the greater trochanter in a curvilinear fashion. The principal tensile group arises from below the greater trochanter and extends to the inferior aspect of the femoral head, passing through the femoral neck. Secondary tensile group start below the principal tensile trabeculae and end superiorly along the upper end of femur (just after midline).
Ward’s triangle (Singh et al. 1970, 1972, 1973) is an area with loose and thin trabeculae. This triangle becomes prominent in osteoporosis. As osteoporosis worsens, the triangle opens up laterally. Based on this sequence, Singh and coworkers (Singh et al. 1970, 1972) proposed an index which can be used as a scale for assessing the severity of osteoporosis (Fig. 7). The classification ranges from grade VI (normal with visualization of all the trabeculae) to grade I (loss of even the primary compressive trabeculae). Singh et al. later added grade VII in people with dense bones. However, recent studies have indicated poor correlation between Singh’s index and bone density assessed by bone mineral densitometry techniques (Hübsch et al. 1992; Koot et al. 1996; Salamat et al. 2010).
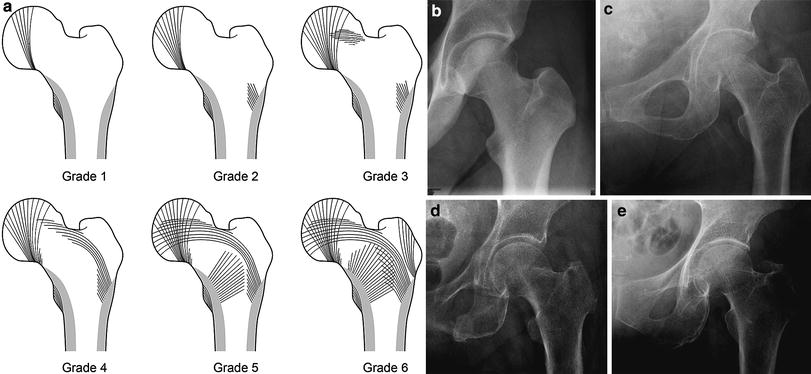
Fig. 7
a Classification for assessing the severity of osteoporosis according to the Singh index (Grade 6 to grade 1). b Normal trabecular pattern—grade 6. c Grade 5. d Grade 4. e Grade 3
6.2.2.2 Acute Hip Fractures
Fractures of the hip are broadly classified into femoral neck fractures and trochanteric fractures (Greenspan et al. 1994; Mautalen et al. 1996). The femoral neck fractures are intracapsular fractures (Fig. 8) and have a higher risk of avascular necrosis of the femoral head, compared to the extracapsular trochanteric fractures. Open reduction and internal fixation is the preferred treatment for femoral neck fractures. Trochanteric fractures (Fig. 9) are seen in advanced osteoporosis and in the elderly age group. Identification of undisplaced femoral neck fractures may be difficult and may not be diagnosed on the initial radiographs. Only a linear sclerotic band or angulation of trabeculae may be seen, even after careful evaluation. In doubtful cases, MR imaging is helpful and it can detect fractures that are less than 6 hours old (Anil et al. 2010).
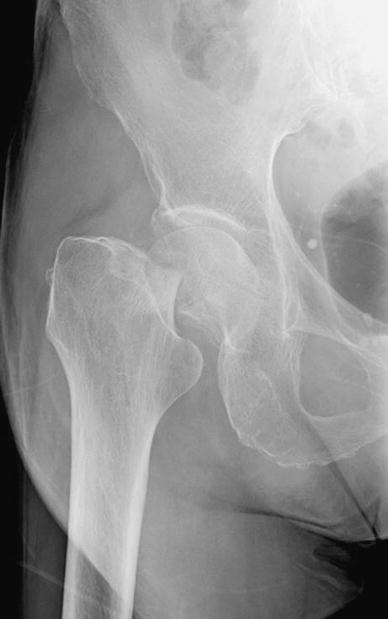
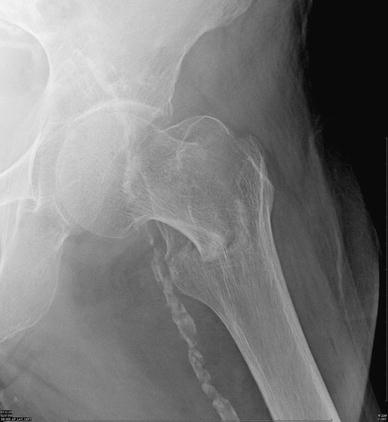
Fig. 8
Right hip radiograph of a 70-year-old woman shows an intracapsular fracture of the femoral neck
Fig. 9
Left hip radiograph of a 82-year-old woman shows an (extracapsular) intertrochanteric fracture
6.2.2.3 Insufficiency Fractures
These can occur in the subchondral region and are often confused with avascular necrosis. The diagnosis is mainly radiological (Rafii et al. 1997; Yamamoto et al. 2000). The presentation is usually acute in elderly women. Subchondral lucency may be seen on radiographs, and are often missed on the initial radiograph. MR imaging is very useful in diagnosing these insufficiency fractures which are typically seen as hypointense lines on T1- and T2- weighted images (Fig. 10). Proximal femur fractures should be differentiated from pathological fractures due to metastatic disease, especially when the fracture is located in the subtrochanteric region or in the lesser trochanter (Dijkstra et al. 1997).
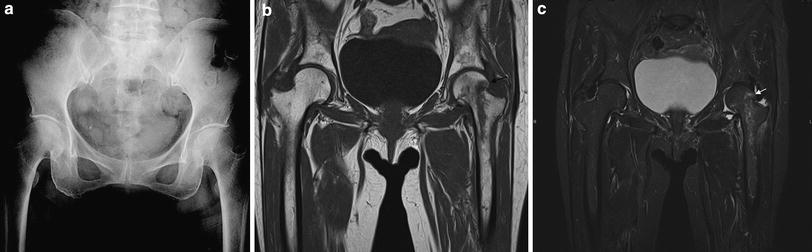
Fig. 10


Insufficiency fracture in the femoral neck. a Frontal pelvic radiograph of an elderly woman shows no obvious fracture. b Coronal T1- weighted and c fat-suppressed T2-weighted MR images show the subcapital linear insufficiency fracture (arrows). Adjacent edema is also noted.
Related posts:

Stay updated, free articles. Join our Telegram channel
Full access? Get Clinical Tree
