Multiple sclerosis (MS) is the most common inflammatory demyelinating disorder of the central nervous system (CNS). MS has been subject to high-field magnetic resonance (MR) imaging research to a great extent during the past years, and much data has been collected that might be helpful in the investigation of other inflammatory CNS disorders. This article reviews the value of high-field MR imaging in examining inflammatory MS abnormalities. Furthermore, possibilities and challenges for the future of high-field MR imaging in MS are discussed.
- •
Multiple sclerosis (MS) is the most common chronic inflammatory demyelinating disorder of the central nervous system (CNS).
- •
MS has been subject to high-field magnetic resonance (MR) imaging research to a great extent.
- •
Using conventional sequences at higher magnetic field leads to an increased detection of focal inflammatory MS lesions in both white and gray matter.
- •
High-field MR imaging detects MS lesions particularly in anatomic regions that are important for the diagnosis, prognosis, and differential diagnosis of MS.
- •
Using quantitative sequences at high-field provided more insight in pathologic processes that cause (subtle) diffuse inflammatory changes and showed improved correlation with measures of clinical outcome.
- •
The use of high-field 3 T MR imaging does not lead to a significant earlier diagnosis of MS using the current McDonald criteria, which are based on 1.5 T.
- •
Future research on clinical relevance of high-field MR imaging in MS patients is warranted.
- •
Possibly this will lead to the development of more specific, high-field 3 T/7 T diagnostic criteria for MS.
- •
The standard MR imaging protocol for the diagnosis of inflammatory central nervous system (CNS) diseases recommends brain and spinal cord imaging.
- •
It includes 3 sequences: fluid-attenuated inversion recovery (FLAIR) (brain), proton-density (PD)/T2-weighted fast spin echo (FSE) or turbo spin echo (TSE) (brain + spinal cord), and postcontrast T1-weighted (brain + spinal cord) images.
- •
High-field 3 T MR imaging detects more MS lesions in both gray and white matter of the brain, in anatomic regions that are important for the diagnosis of MS.
- •
The use of high-field 3 T MR imaging does not lead to a significant earlier diagnosis of MS using the current McDonald criteria, which are based on 1.5 T.
- •
High-field 3 T MR imaging therefore is safe and does not lead to field strength–induced overdiagnosis of MS because of false-positive detection of white matter lesions.
- •
The use of quantitative sequences at high-field MR imaging provides insight into pathologic processes and improves correlation with measures of clinical outcome, but is not included in clinical protocols.
- •
Future research should focus on the clinical relevance of (ultra) high-field MR imaging in terms of diagnostic criteria and individual patient care.
MS is the most common inflammatory CNS disease in young adults that leads to relevant chronic disability, and is typified by both pathologic and clinical heterogeneity. Pathologically, MS is described as multifocal areas of demyelination with loss of oligodendrocytes, astroglial scarring, and axonal injury. Damage can be focal (plaques) or diffuse (in diffusely abnormal and normal-appearing brain tissue [NABT]), occurs in both white matter (WM) and gray matter (GM), and is characterized by a combination of inflammation, demyelination, and neurodegeneration. Clinically, the disease displays heterogeneity in neurologic disability between and within patients.
MR imaging has been used increasingly over the past decades to depict inflammatory and neurodegenerative abnormalities, and has been established as the most important paraclinical tool in diagnosing MS. This increasing use has led to the incorporation of MR imaging criteria for the demonstration of dissemination in space (DIS) and dissemination in time (DIT) into the International Panel (IP) diagnostic criteria for MS. Besides ascertaining the diagnosis, MR imaging is used to exclude other conditions with similar clinical profiles, and to monitor disease progression and treatment effects. Furthermore, MR imaging can be used to obtain prognostic information in the early course of the disease, being able to predict conversion to clinically definite MS (CDMS) and to predict long-term disability in patients with a clinically isolated syndrome (CIS) suggestive of MS.
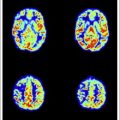
Much progress has been made in improving the dissociation between imaging and clinical disability in MS patients, the so-called clinico-radiological paradox, particularly with the application of advanced MR imaging techniques. The assessment of brain atrophy can classify (GM vs WM) and quantify tissue loss, whereas relaxation-time mapping, magnetization transfer ratio (MTR), and diffusion tensor imaging (DTI) are able to quantify the extent of structural changes within lesions and show occult damage to MS brain tissue, that is, outside focal lesions in NABT. Proton MR spectroscopy ( 1 H-MRS) provides information on the biochemical and metabolic nature of these changes, and functional MR imaging (fMRI) shows that the brain is capable of limiting clinical consequences of irreversible damage by a process called neuronal adaptation.
In addition to developing advanced sequences and techniques to improve software of MR imaging, great strides have been made in improving hardware. Besides improvement in gradient and receiver coils, an important development is the introduction of high-field 3 T MR imaging scanners. At present these are widely available and increasingly used in many hospitals, particularly in MS centers.
Although high-field MR imaging seems a promising modality to depict and classify the heterogeneity of MS pathology, this article does not tackle the ongoing debate on the interrelation between inflammation, demyelination, and neurodegeneration of the disease.
High-field MR imaging in MS: conventional imaging
The search for the impact of increasing magnetic field strengths on the visibility of MS lesions has existed since the introduction of MR imaging, as shown in studies comparing 0.5 T with 1.0 and 1.5 T. At present, 3 T MR imaging is considered as high-field for clinical purposes, and field strengths of 4 T and above are considered ultrahigh-field.
One of the major advantages of moving to high-field MR imaging is the increase in signal-to-noise ratio (SNR) that follows an almost linear relation with magnetic field strength. This gain in SNR can be used either to improve spatial resolution or to reduce scan time (or a combination of both), leading to higher image quality and faster image acquisition.
Detection of Inflammatory White Matter Pathology
Imaging guidelines for conventional brain MR imaging in the diagnosis of inflammatory CNS disease recommend a multisequence protocol consisting of 3 sequences ( Table 1 ). The first is a sagittal (preferably 3-dimensional [3D]) fluid-attenuated inversion recovery (FLAIR) sequence to depict the supratentorial brain, providing the highest sensitivity in detection of lesions close to the cerebrospinal fluid (juxtacortical and periventricular lesions). Second is proton-density (PD)/T2-weighted fast spin echo (FSE) or turbo spin echo (TSE) imaging, being highly sensitive for detection of WM lesions, particularly in the infratentorial WM. Final recommendations in the protocol are precontrast (optional) and postcontrast-enhanced T1-weighted images, which allow visualization of active lesions, that is, those associated with inflammatory activity and blood-brain barrier breakdown. For patients who present with symptoms at spinal cord level, or when brain MR imaging analysis is equivocal, the protocol recommends MR imaging of the spinal cord (postcontrast T1-weighted and FSE/TSE PD/T2-weighted sequences).
| Sequence | Orientation | Objective |
|---|---|---|
| Brain | ||
| FLAIR | Sagittal + axial | Supratentorial brain, especially juxtacortical and periventricular lesions |
| PD/T2 | Axial | Infratentorial lesions |
| T1 pregadolinium | Axial | Optional |
| T1 postgadolinium | Axial | Inflammatory lesions |
| Spinal Cord | ||
| PD/T2 | Sagittal | Focal demyelinating lesions |
| T1 postgadolinium | Sagittal | Inflammatory lesions |
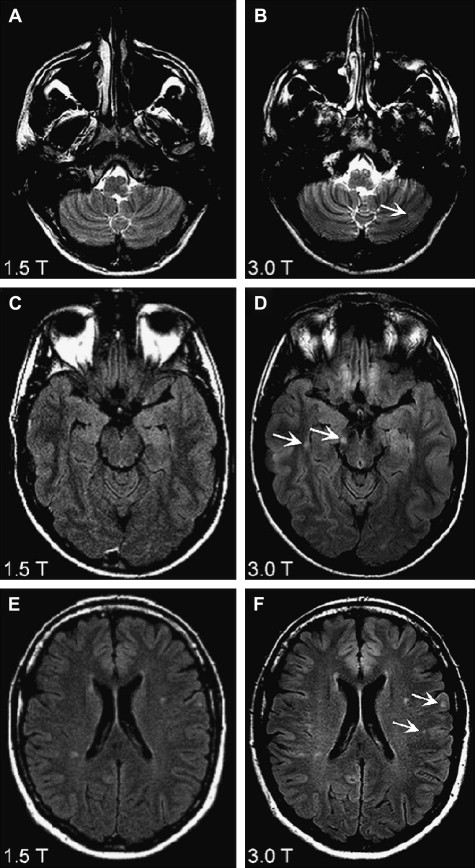
Images are evaluated for radiologic findings as seen in inflammatory diseases, concentrating on focal and diffuse WM and GM abnormalities. MR images obtained from patients with suspected MS are analyzed according to MR imaging criteria for DIS (Barkhof, Swanton), and the recently revised IP diagnostic criteria for MS, which are based on magnetic field strengths of 0.5 to 1.5 T. With 3 T MR imaging scanners being used more routinely in the clinical setting, one should question the accuracy of these criteria in determining lesion load in (suspected) MS. When comparing high (3 T/4 T) with lower (1.5 T) field-strength MR imaging in MS patients, a conclusive finding is an improved detection of WM lesions and contrast-enhanced lesions ( Table 2 ). Another important finding is that at high-field, more lesions are detected in anatomic regions important for establishing the diagnosis MS according to diagnostic criteria, such as periventricular, juxtacortical, and infratentorial WM lesions ( Fig. 1 ). The improvement in infratentorial lesion detection is also important in gaining information on prognosis of the disease, because these lesions have important prognostic value in the prediction of long-term disability in patients with CIS suggestive of MS.
| Study, Year | Patients (N) | Field Strength Used (Sequence) | Most Important Results |
|---|---|---|---|
| White Matter | |||
| Keiper et al, 1998 | CDMS (15) | 1.5 T vs 4 T (T2w FSE) | WM lesion detection increase of 45% |
| Erskine et al, 2005 | SP (8) | 1.5 T vs 4 T (T1w, PD/T2w) | WM lesion detection increase 46% Total WM lesion volume increase 60% |
| Sicotte et al, 2003 | RR, SP (25) | 1.5 T vs 3 T (T1w ± Gd) | Increase in detection of CE WM lesions of 21% Lesion volume CE WM lesion increase 30% Total WM lesion volume increase 10% |
| Bachmann et al, 2006 | RR, PP, SP (22) | 1.5 T vs 3 T (FLAIR) | 3 T imaging superior in lesion conspicuity and quality Significantly more artifacts at 3 T Total WM lesion detection increase 42% |
| Nielsen et al, 2006 | Acute ON (28) | 1.5 T vs 3 T (T1w SE ± Gd, PD/T2w TSE, FLAIR) | 24% increase in detection of CE WM lesions, 26.5% increase in FLAIR lesions |
| Wattjes et al, 2006 | CIS (40) | 1.5 T vs 3 T (T1w SE ± Gd, T2w TSE, FLAIR) | 13% increase in WM lesion detection 7.5% increase in CE WM lesion detection Especially in the infratentorial, juxtacortical and periventricular anatomic region important for diagnosis |
| Gray Matter | |||
| Wattjes et al, 2007 | CIS, CDMS (26) | 3 T (2D-DIR, T2w TSE, FLAIR) | DIR detected a 7% and 15% increase in lesions compared with FLAIR and T2w imaging, respectively Especially in infratentorial region |
| Simon et al, 2010 | CIS, CDMS (34) | 1.5 T vs 3 T (2D-DIR, T1w SE ± Gd, T2w TSE, FLAIR) | 3 T DIR detected 192% more intracortical lesions and 30% more mixed WM/WM lesions than 1.5 T |
Detection of Gray Matter Pathology
GM pathology (cerebral cortex and deep GM structures) is a key feature of MS. It is already present in the earliest stages of the disease, and accumulates and accelerates more in the later and progressive phases. GM damage can manifest as a mixture of focal demyelinating lesions and diffuse abnormalities. Early pathology studies already acknowledged the extensive involvement of GM in MS.
Notwithstanding the recent focus of MR imaging research on GM abnormalities, thus far GM (especially subpial intracortical) lesions are still vastly underdetected by conventional in vivo MR imaging studies when compared with pathology studies. The sensitivity of conventional imaging techniques (T1, PD/T2, FLAIR) in detecting GM damage is poor, because these techniques lack the necessary contrast and resolution to visualize cortical demyelination. The pathophysiology and histopathology of cortical lesions (less inflammatory cell infiltration, no complement activation or blood-brain-barrier damage) and low myelin content of GM, plus partial volume effects from cerebrospinal fluid (CSF) on MR imaging, all contribute to this lack of sensitivity.
Improvement in the sensitivity of GM lesion detection was established with the introduction of the GM-specific double inversion recovery (DIR) sequence, higher resolution imaging of GM by the use of high-field MR imaging and, of course, the combination of these 2 methods. The development of DIR, which is not included in the conventional MR imaging protocol on a regular basis, leads to an improved (gray-white) contrast by depicting only GM. This is managed by using 2 inversion pulses leading to an attenuation of both CSF and WM. Disadvantages are its rather low SNR resulting from the double signal-inversion pulses, and the propensity to (flow and pulsation) artifacts, particularly in the posterior fossa. The development of multislab and, later, single-slab 3D-DIR applications led to a great improvement : a 5-fold increase in cortical lesions in MS patients was detected in comparison with conventional T2-weighted sequences. In addition, an improved distinction was made between mixed GM-WM lesions and purely intracortical lesions.
The introduction of high-field imaging did not immediately lead to an increase in detection of cortical lesions, when applied in postmortem research using conventional PD sequences on a 4.7 T MR imaging system. Most GM lesions were still missed; contrast between GM and GM lesions was found to be very low, independent of sequence or field strength. The combination of higher magnetic field strengths with DIR sequences in vivo seemed to be more successful in visualizing GM pathology. At 3 T, DIR was superior to the standard sequences in the detection of WM, mixed WM/GM, and intracortical GM lesions (see Table 2 ). One of these studies also demonstrated superiority of DIR at 3 T over other sequences for infratentorial WM lesions, which is clinically highly important as stated earlier. Both studies made use of a 2-dimensional (2D)-DIR sequence; implementing 3D-DIR at higher magnetic field (3 T) might result in further improvement of lesion detection by reducing artifacts, but will be accompanied by an increase in acquisition time.
Improved depiction of GM damage was achieved in studies using ultrahigh-field strengths (7 T and higher), the results of which are described in more detail later in this article.
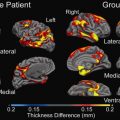
The focus on how to depict GM damage has high clinical relevance, because cortical damage differs between MS disease types and stages, and shows a relationship with physical as well as cognitive disability. Furthermore, when including the presence of intracortical GM lesions in MR imaging diagnostic criteria, an increase in accuracy of these criteria has been reported. However, an official introduction of GM lesions into the diagnostic criteria has not yet been made and needs further multicenter validation. A step in the right direction was recently made by developing consensus recommendations for MS cortical lesion scoring using DIR.
Detection of Active Inflammatory Pathology
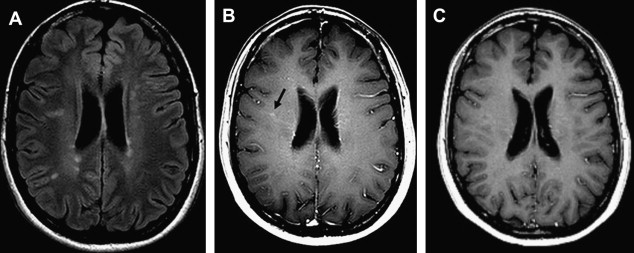
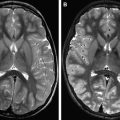
Magnetic field strength influences tissue relaxation times. With 3 T MR imaging, T1 (spin lattice/longitudinal) relaxation time increases by 20% to 40%, whereas T2 (spin spin/transverse) relaxation time decreases by about 5% to 10%. When using T1-shortening contrast agents at higher field strengths, for example, paramagnetic gadolinium-based contrast agents, the overall longer high-field T1 relaxation times will create a relatively stronger effect of T1 reduction by the contrast agent. This effect causes a greater postcontrast signal intensity difference at 3 T in comparison with 1.5 T, which increases the detection of contrast-enhancing inflammatory lesions in MS ( Fig. 2 ). It may even allow dosage reduction at higher field strengths. Nonetheless, because of decreased GM-WM contrast with increasing magnetic field, it remains a challenge to develop an SE T1 sequence for high-field MR imaging systems, which is the standard sequence used to detect inflammatory lesions at lower field strengths.
Paramagnetic contrast agents based on iron oxides such as (ultra) small particles of iron oxide ([U]SPIO), which have shown pluriformity of inflammatory MS pathology complementary to gadolinium-enhanced 1.5 T MR imaging, have not yet been applied at higher magnetic fields.
Detection of Spinal Cord Pathology
MR imaging of the spinal cord has gained more importance in establishing the diagnosis of MS, particularly in the recent IP criteria. As is known from standard field strength studies, conventional MR imaging shows asymptomatic spinal cord lesions in 30% to 40% of CIS patients and in up to 90% of CDMS patients. Besides aiding in diagnosis and differential diagnosis, imaging of spinal cord abnormalities is relevant because these are related to clinical outcome. Advanced MR techniques are sensitive to tissue damage in the spinal cord, and are related to measures of clinical outcome as well.
Postmortem studies using high-field MR imaging showed a better visibility of MS spinal cord pathology including quantitative and GM abnormalities, but the in vivo use of higher magnetic field strengths for imaging spinal cord remains problematic, mainly because of susceptibility, CSF, and pulsation artifacts. In contrast to brain MR imaging studies, in vivo comparison of 1.5 T and 3 T spinal cord MR imaging showed no significant differences in terms of lesion detection and correlations with clinical measures such as the Expanded Disability Status Scale (EDSS). A recent MR imaging study investigating spinal cord volumes at 3 T described a decrease in cervical spinal cord volume in progressive forms of MS and a trend toward increased spinal cord volume in relapsing remitting (RR) MS/CIS patients, which the investigators refer to respectively as atrophy and inflammation/edema–related expansion.
Clinical Value of Conventional High-Field MR imaging in Terms of Diagnostic Criteria
As described, studies investigating the influence of higher magnetic field strengths on lesion load measurement showed an evident improvement in lesion detection. However, the crucial question remains as to whether 3 T MR imaging scanners are of added clinical value in terms of an earlier diagnosis of MS. High-field 3 T MR imaging proved to be able to substantially influence classification of CIS patients according to Barkhof MR imaging criteria: 27.5% of the 40 patients studied fulfilled 1 additional criterion. Diagnostic classification in terms of DIS was mildly influenced: only 1 additional patient had DIS at 3 T on comparison with 1.5 T examinations. During follow-up no additional patients showed DIT at 3 T compared with 1.5 T examination, neither to the revised IP criteria nor to the Swanton criteria. Hence, when using the 2005 IP criteria, 3 T MR imaging does not lead to an earlier diagnosis of MS. When retrospectively applying the data of this cohort to the more liberal 2010 revised IP criteria that are based on MR imaging criteria developed by the MAGNIMS group, again no earlier diagnosis of MS could be established at 3 T when compared with 1.5 T. From these studies it can also be concluded that when using the revised IP criteria, 3 T MR imaging is safe and does not lead to field strength–influenced overdiagnosis of MS resulting from false-positive detection of WM lesions. However, this conclusion, together with the statement that in CIS patients there is no added clinical value of high-field 3 T MR imaging above standard 1.5 T MR imaging, might be too premature, because it was only based on one rather small, single-center, single-vendor data set. Future studies might lead to new and improved criteria for the diagnosis of MS, based on (ultra) high-field MR imaging in combination with novel sequences such as DIR.
Ultrahigh-field MR imaging in MS
Although high-field 3 T MR imaging showed advantages over lower field strength imaging, the true future of MR imaging in MS might reside in ultrahigh-field MR imaging systems (>4 T). Since 2000, when the US Food and Drug Administration (FDA) gave approval for in vivo high-field imaging with magnetic field strengths up to 8 T, researchers worldwide started moving up to ultrahigh-field MR imaging. In MS research the ultrahigh-field machine most commonly used for in vivo brain imaging is a 7 T whole-body MR imaging scanner.
Implementation of in vivo 7 T MR imaging is technically challenging, because disadvantages of scanning at high-field strengths are even more distinct when using an ultrahigh magnetic field. From their own experience the authors can state that sequences that are robust at 1.5 and 3 T do not result in high-quality images at 7 T. The main problems are practical issues related to heterogeneity of the magnetic field and maximum specific absorption rate (SAR) limitations, leading to artifacts that make full brain coverage seemingly difficult. At present, the major drawbacks of 7 T MR imaging have been solved, and the first interesting observations of its application in MS research are being published. There are 2 crucial findings of ultrahigh-field MR imaging in MS: first, an increased detection of lesions when compared with lower field strengths ( Table 3 ), as would be expected from increased resolution and SNR; second, the depiction of additional features of MS pathology, revealing a heterogeneity that is not visible at lower field strength.
| Study, Year | Patients (N) | Field Strength (Sequence) | Most Important Results |
|---|---|---|---|
| Post Mortem | |||
| Kangarlu et al, 2007 | SP (1) | 1.5 T vs 8 T (GRE, T2w SE, FLAIR) | Detection of cortical lesions at 8 T that remained invisible at 1.5 T At histopathologic verification cortical lesions could only be found after observing 8 T images |
| Pitt et al, 2010 | SP (3) | 7 T (3D T2∗ GRE, WM attenuated TFE) | Detection of 93% (3D T2∗ GRE) and 82% (WM attenuated TFE) of cortical lesions compared with pathological examination |
| In Vivo | |||
| Kolia et al, 2009 | (12) | 1.5 T vs 7 T (T1w, PD/T2w) | 23% increased WM lesion detection at 7 T Better differentiation between juxtacortical and cortical lesions at 7 T |
| Mainero et al, 2009 | RR, SP (16) | 7 T (3D-T1w MPRAGE, FLASH T2∗ GRE, T2w TSE) | 7 T is able to classify cortical lesion according to histopathologic lesion type: type 1 (36.2%), type 2 (13.6%), type 3–4 (50.2%) Cortical lesion type 3–4 was related to higher EDSS score |
Increased MS Lesion Detection Using Ultrahigh-Field MR imaging
Postmortem studies using ultrahigh magnetic field strengths discovered cortical lesions at 8 T that remained invisible at 1.5 T. At histopathologic verification, often these cortical lesions could only be found after observing the 8 T MR images. A recent postmortem study showed that 3D-T2∗ gradient echo sequences and WM-attenuated turbo field echo sequences at 7 T were able to detect most cortical lesions verified by pathological examination. Unfortunately, both postmortem studies used a limited number of patients, and further validation with a larger number of samples is warranted.
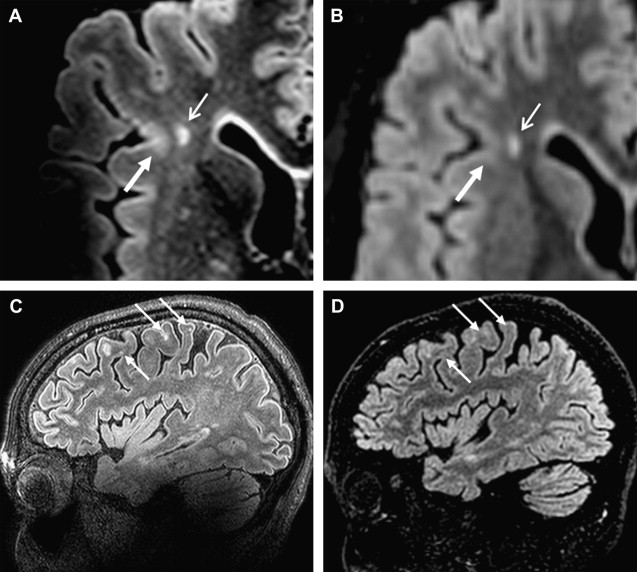
In vivo studies using ultrahigh magnetic field strength show increased detection of MS lesions in WM as well as in cortical GM. The improvement in detection of cortical GM lesions is important, because the depiction of this type of lesions has been difficult at lower field strengths. Mainero and colleagues found that 7 T MR images were able to differentiate cortical lesions in accordance with histopathologic lesion types (type 1: leukocortical; type 2: intracortical; type 3/4: subpial extending partly/completely through cortical layers). Type 3/4 was found to be the most frequent type of cortical plaques (50.2%), and this type was also related to higher EDSS scores. In vivo studies comparing advanced sequences between 7 T MR imaging and lower field strength do not exist, but the authors’ own data show that 3D-FLAIR and 3D-DIR using magnetization preparation (MP) allows high-quality T2-weighted MR imaging in MS at 7 T, and that 7 T 3D-FLAIR improves cortical lesion detection in comparison with 3 T ( Fig. 3 ).
Visualizing Heterogeneity of MS Lesions at Ultrahigh-Field Strength
The main focus of ultrahigh-field imaging in MS patients thus far has been on heterogeneity of lesions, which is studied by making use of the increased magnetic susceptibility at higher field strength. Susceptibility-weighted imaging (SWI) identified the relationship between MS lesions and vasculature, and confirmed that MS lesions follow a strict perivascular distribution. That perivenular inflammation plays a role in MS was already identified in histopathology studies, but the possibility to visualize it in vivo provides opportunities to further investigate what determines lesion location (in a longitudinal setting) and might help in differentiating MS from ischemic WM lesions.
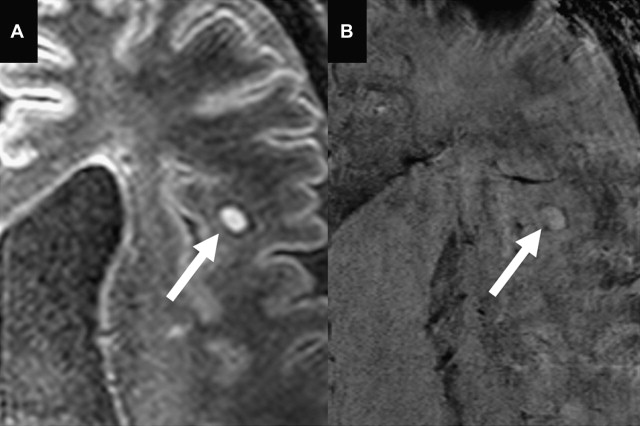
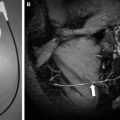
Another specific feature discovered by ultrahigh-field SWI in a subset of MS lesions are hypointense rims ( Fig. 4 ). Hammond and colleagues explained these rims to reflect iron-rich macrophages at the periphery of a lesion, which may indicate the site of active inflammation in tissue and might be of help in staging the disease. Postmortem pathology studies have identified this iron accumulation in MS plaques as well. Pitt and colleagues reported the hypointense rims to correspond to increased density of activated microglia. Hypointense rims have not been conclusively identified at 1.5 T.
At even higher field strengths (9.4 T), T2-weighted scanning was able to discriminate areas of remyelination and demyelination in postmortem MS lesions. More recently, the same investigators studied 21 tissue samples of MS motor cortex, and found 28 GM cortical lesions that were visible on T2-weighted MR imaging as well as on sections immunostained for myelin basic protein. Furthermore, a correlation between quantitative MR and quantitative histology was made, which suggested that in cortical GM, T1 relaxation-time differences may be a predictor of neuronal density and T2 relaxation-time differences may predict myelin content. When these results can be translated into in vivo studies, for instance at 3 T or 7 T, they might possibly have a great impact on clinical translation of demyelination and neuronal loss.
Ultrahigh-field MR imaging in MS
Although high-field 3 T MR imaging showed advantages over lower field strength imaging, the true future of MR imaging in MS might reside in ultrahigh-field MR imaging systems (>4 T). Since 2000, when the US Food and Drug Administration (FDA) gave approval for in vivo high-field imaging with magnetic field strengths up to 8 T, researchers worldwide started moving up to ultrahigh-field MR imaging. In MS research the ultrahigh-field machine most commonly used for in vivo brain imaging is a 7 T whole-body MR imaging scanner.
Implementation of in vivo 7 T MR imaging is technically challenging, because disadvantages of scanning at high-field strengths are even more distinct when using an ultrahigh magnetic field. From their own experience the authors can state that sequences that are robust at 1.5 and 3 T do not result in high-quality images at 7 T. The main problems are practical issues related to heterogeneity of the magnetic field and maximum specific absorption rate (SAR) limitations, leading to artifacts that make full brain coverage seemingly difficult. At present, the major drawbacks of 7 T MR imaging have been solved, and the first interesting observations of its application in MS research are being published. There are 2 crucial findings of ultrahigh-field MR imaging in MS: first, an increased detection of lesions when compared with lower field strengths ( Table 3 ), as would be expected from increased resolution and SNR; second, the depiction of additional features of MS pathology, revealing a heterogeneity that is not visible at lower field strength.
| Study, Year | Patients (N) | Field Strength (Sequence) | Most Important Results |
|---|---|---|---|
| Post Mortem | |||
| Kangarlu et al, 2007 | SP (1) | 1.5 T vs 8 T (GRE, T2w SE, FLAIR) | Detection of cortical lesions at 8 T that remained invisible at 1.5 T At histopathologic verification cortical lesions could only be found after observing 8 T images |
| Pitt et al, 2010 | SP (3) | 7 T (3D T2∗ GRE, WM attenuated TFE) | Detection of 93% (3D T2∗ GRE) and 82% (WM attenuated TFE) of cortical lesions compared with pathological examination |
| In Vivo | |||
| Kolia et al, 2009 | (12) | 1.5 T vs 7 T (T1w, PD/T2w) | 23% increased WM lesion detection at 7 T Better differentiation between juxtacortical and cortical lesions at 7 T |
| Mainero et al, 2009 | RR, SP (16) | 7 T (3D-T1w MPRAGE, FLASH T2∗ GRE, T2w TSE) | 7 T is able to classify cortical lesion according to histopathologic lesion type: type 1 (36.2%), type 2 (13.6%), type 3–4 (50.2%) Cortical lesion type 3–4 was related to higher EDSS score |
Related posts:
 Current State-of-the-Art 1.5 T and 3 T Extracranial Carotid Contrast-Enhanced Magnetic Resonance Angiography
High-Field Atherosclerotic Plaque Magnetic Resonance Imaging
Current State-of-the-Art 1.5 T and 3 T Extracranial Carotid Contrast-Enhanced Magnetic Resonance Angiography
High-Field Atherosclerotic Plaque Magnetic Resonance Imaging
 Vascular Disorders: Insights from Arterial Spin Labeling
 Current Status and Future Perspectives of Magnetic Resonance High-Field Imaging: A Summary
 Pediatric High-Field Magnetic Resonance Imaging
 Ultrahigh-Field Magnetic Resonance Imaging: The Clinical Potential for Anatomy, Pathogenesis, Diagnosis and Treatment Planning in Neck and Spine Disease
Stay updated, free articles. Join our Telegram channel

Full access? Get Clinical Tree


