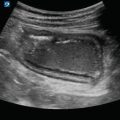
Figure 1.1
B-mode imaging: Brightness mode imaging of the heart. Brightness mode or B-mode is the standard ultrasound mode for all clinical imaging

Figure 1.2
M-mode imaging: Motion mode imaging of the heart. Motion mode or M-mode cardiac evaluates the movement of structures within the body. This image demonstrates the utilization of M-mode to evaluate movement of the left ventricle over time

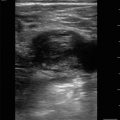
Figure 1.3
High gain: This image demonstrates the parasternal long view of a heart with high gain. Gain is related to brightness of the image. When the gain is too high, the image will be bright and details are lost

Figure 1.4
Low gain: This image demonstrates the parasternal long view of a heart with low gain. Gain is related to brightness of the image. When the gain is too low, the image will be dark and details are lost

Figure 1.5
High depth: This image demonstrates the parasternal long view of a heart with the depth set too deep. The structure of interest should be centered in the screen

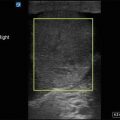
Figure 1.6
Shallow depth: This image demonstrates the parasternal long view of a heart with the depth set too low. The structure of interest should be centered in the screen

Figure 1.7
Ideal depth: This image demonstrates the parasternal long view of a heart with ideal depth and gain settings to properly vision the entire structure of interest as well as the appropriate level of detail

Figure 1.8
Color Doppler: Color Doppler measures shifts in velocity which are color coded according to direction of flow in relationship to the transducer; flow away from the transducer will appear blue, and flow toward the transducer will appear red. Note that it does not relate to venous and arterial flow. In this image, the testicles are being assessed for vascular flow with color Doppler

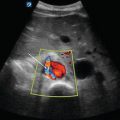
Figure 1.9
Power Doppler: Power Doppler will display a signal in color if there is any motion at all. It does not indicate velocity or direction. In this image, the testicles are being assessed for vascular flow with power Doppler
Transducer Selection
Curvilinear Transducer
Phased Array Transducer
Linear Array Transducer
Endocavitary Transducer