Introduction to Skeletal Radiology and Bone Growth
Lee F. Rogers
L. F. Rogers: Department of Radiology, Wake Forest University School of Medicine, Winston-Salem, North Carolina 27157.
Radiographic examination is the key to the diagnosis of many skeletal abnormalities. It is essential that each bone be examined in its entirety, including the cortex, medullary canal (cancellous bone or spongiosa), and articular ends. The position and alignment of joints are determined. In children, the epiphysis and epiphyseal line or physis must be observed. The adjacent soft tissues are examined.
Obliteration of normal soft-tissue lines and the presence of a joint effusion are of particular importance. When disease is present, it is important to determine whether the process is limited to a single bone or joint or whether multiple bones or joints are involved. The distribution of disease is also a consideration. The presence and type of bone destruction and bone production, the appearance of the edges or borders of the lesion, and the presence or absence of cortical expansion and periosteal reaction are also noted. The radiographic findings are then correlated with the clinical history and the age and sex of the patient to arrive at a logical diagnosis. The diagnosis may be firm in some instances; in other cases, a differential diagnosis is offered because the exact diagnosis cannot be determined.
SKELETAL SCINTIGRAPHY
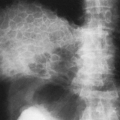
Skeletal scintigraphy or bone scanning is a valuable adjunct to standard film radiography (Fig. 1).1 Bone-seeking radionuclides are taken up in areas of increased bone turnover. This occurs normally at the growth plate in children and at abnormal sites in tumors, infections, and fractures; in sites of reactive bone formation in arthritis; and in periostitis regardless of the etiology. Technetium-99m-labeled polyphosphates are the most common radiopharmaceuticals used, particularly technetium-99m methyldiphosphonate (99mTc-MDP). Fifteen to 20 millicuries (mCi) is injected intravenously, and a scan is obtained 2 hours later. Because the total body dose is 0.009 rad/mCi, the radiation-absorbed dose is very low. The agent is excreted in the kidneys and collects in the bladder. The target organ (i.e., the organ receiving the highest dose) is the wall of the bladder, which is exposed to approximately 0.275 rad/mCi. Bone scanning is more sensitive to areas of bone turnover and destruction than plain film radiography or tomography. The bone scan may be positive despite a normal radiograph (i.e., well before the radiograph becomes abnormal). However, the bone scan is less specific than the radiograph. Areas of increased activity are detected, but the cause of the increase often cannot be stated with certainty, and correlation with plain film radiography, computed tomography (CT), or magnetic resonance imaging (MRI) is necessary to establish a correct diagnosis.
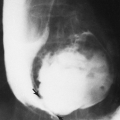
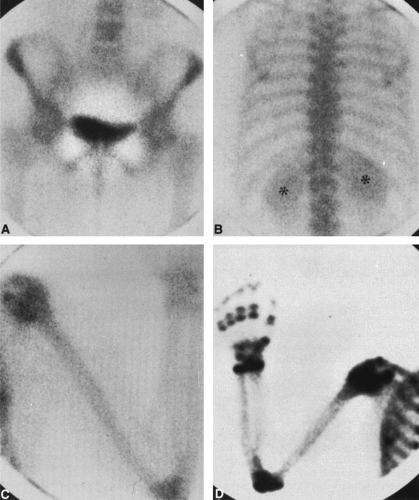 FIG. 1-1. Normal bone scan. A: Normal bone scan of 23-year-old woman. Anterior view of the pelvis. The bones of the pelvis, lower lumbar spine, and proximal femurs are visualized but are poorly defined. The greatest concentration of radioactivity is within the bladder. B: Posterior view of the thoracolumbar spine. The scapulae, vertebrae, and ribs are demonstrated. Radioactivity is identified within the kidneys (asterisk). C: Anterior view of the left upper extremity. The humerus, ulna, radius, and bones of the hand are seen. Diffuse activity is present in the carpus, but the individual carpal bones are not discernible. D: Normal bone scan of the right upper extremity of a 10-year-old girl. Note the band of increased radioactivity in the region of the growth plates, seen particularly well at the distal radius and ulna, metacarpals, and proximal phalanges. |
COMPUTED TOMOGRAPHY
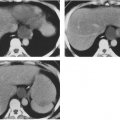
CT is advantageous in the evaluation of the skeletal system. It allows visualization of adjacent soft-tissue structures and also the marrow in the medullary cavity. The positions of surrounding vascular structures can be determined by the use of contrast media. CT has the added advantage of being more sensitive for the detection of bone destruction than plain film radiography or standard tomography. CT images are displayed in the axial or horizontal plane, or even in the sagittal and coronal planes, with image reconstruction. However, image reconstruction degrades the image. Images are displayed with both bone and soft-tissue windows. The soft-tissue window setting allows visualization of surrounding soft tissue but is suboptimal for the bony skeleton (Fig. 1-2A). The bone window setting maximizes the visualization of cortical and medullary bone (Fig. 1-2B).
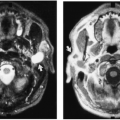
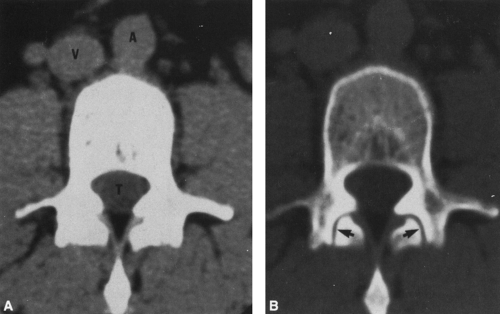 FIG. 1-2. CT of the third lumbar vertebra. A: Within the spinal canal, the soft-tissue window setting demonstrates the paraspinous muscles, the aorta (A), the vena cava (V), and the thecal sac (T) and its contents. B: Bone window setting. This is the same slice shown in Figure 1-2A, but the window setting is set to accentuate bone. The cortex and intramedullary portion of the vertebral body are readily identified. Note the cortex of the pedicles and transverse processes. At this setting, the facet joints (arrows) are visualized but are not identifiable on the soft-tissue setting of Figure 1-2A. |
MAGNETIC RESONANCE IMAGING
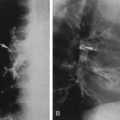
MRI is of great value in the evaluation of the skeletal system, particularly in the detection and evaluation of joint disorders, tumors, infection, bone infarction, and ischemic necrosis.2,9 Because the image is dependent on the presence of hydrogen, which is abundant in marrow fat, MRI visualizes the bone marrow exquisitely. However, the hydrogen content of cortical bone is very low, and MRI therefore is not as sensitive as CT for the evaluation of cortical bone. Cortical bone is shown as black, or very dark, because of its low signal intensity, contrasting sharply with the bright marrow. Similarly ligaments, tendons, and menisci are also low in signal and are seen as black structures; they often are surrounded by a layer of fat that makes them readily apparent. MRI has the added advantage of displaying the anatomy in any plane, including the coronal and sagittal planes, which are distinctly advantageous for demonstration or visualization of abnormalities within bone and their relationships to surrounding soft tissues (Fig. 1-3). Discrimination between and differentiation of various soft tissues and pathologic processes may be enhanced by varying the technical parameters used for the examination. Furthermore, vascular structures are demonstrated and are clearly visualized without the need for injection of contrast medium.
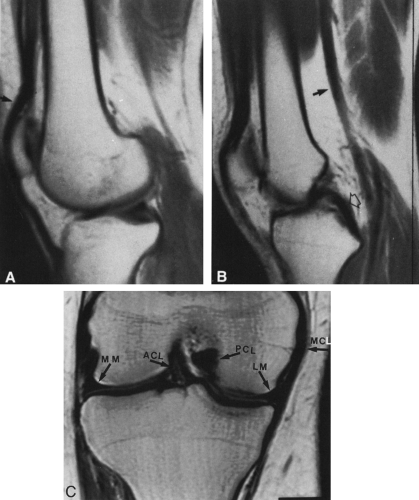 FIG. 1-3. Magnetic resonance image of the knee. A and B in the sagittal plane, C in the coronal plane. A: Note the black lines of the cortex and the white signal of the intramedullary bone and marrow. Muscle is seen as a streaky gray density. The subcutaneous fat and intrapatellar fat pad emit a strong signal because of the high content of hydrogen in fat. The quadriceps tendon is readily identified (arrow). B: Sagittal section obtained more medially demonstrates the popliteal artery (arrow) and the posterior cruciate ligament (open arrow). C: Coronal proton density image demonstrates the lateral (LM) menisci and medial (MM), the medial collateral ligament (MCL), and the anterior (ACL) and posterior (PCL) cruciate ligaments. |
SKELETAL GROWTH AND MATURATION
Ossification of the Skeleton
The process of bone formation in cartilage, known as endochondral ossification, causes bones to grow in length. Some bones are formed in membrane by a process known as membranous bone formation; the bones of the cranial vault are the principal example. Ossification occurs in both cartilage and membrane in the mandible and clavicle. The tubular bones grow in transverse diameter by bone formation within the osteogenic cells of the inner layer of the periosteum. This could be considered a form of membranous bone formation.
At birth, the shafts of the long tubular bones are ossified, but both ends (epiphyses), with a few exceptions, consist of masses of cartilage. Cartilage is relatively radiolucent compared with bone; it has the same density as soft tissue on a conventional radiograph. Therefore, at birth the ends of the bones are separated by radiolucent spaces representing the cartilaginous epiphyses. At variable times after birth, one or more ossification centers appear in the epiphyses (the epiphyseal ossification centers). Exceptions occur at the distal femur and proximal tibia epiphyses, where ossification centers appear during the last 1 or 2 months of intrauterine life. The short tubular bones are similar to the long bones


Related posts:
Stay updated, free articles. Join our Telegram channel
Full access? Get Clinical Tree
