IVIM MRI of the Breast
Breast cancer is one of the most common neoplasms among women worldwide [1]. Tumor angiogenesis plays a crucial role in local tumor growth and distant metastasis and is considered an important prognostic factor in breast cancer [2, 3]. The intravoxel incoherent motion (IVIM) model can investigate both tissue diffusivity and tissue microcapillary perfusion without the need for contrast agents, which are currently essential in breast magnetic resonance imaging (MRI) in clinical practice. This approach was explored in human brain and bone by Le Bihan et al. in the 1980s [4] and now is experiencing a dramatic revival in neuroimaging and oncology.
The IVIM model was first investigated in breast cancer patients by Sigmund et al. in 2011 [5]. They found some nonsignificant variations in perfusion fraction, fp (which is equivalent to flowing blood volume fraction, f IVIM), between invasive ductal carcinoma and other histologic subtypes (10.5 ± 5.0% vs. 6.9 ± 2.9%, p = 0.06). Since then, numerous studies with larger cohorts have been initiated by these authors and others to investigate the perfusion and diffusion characteristics of different breast lesions.
Recent developments in MRI hardware have enabled the acquisition of higher b values (larger than 600 s/mm2) compared with those in the 1980s. At the same time, the original analysis of the IVIM signalcomponenthas been updated to account for non-Gaussian DWI and noise floor effects observed at high b values (especially with values larger than 1000 s/mm2). Accordingly, the combinationof IVIM and non-Gaussian DWI has recently been explored [6, 7]. In addition to IVIM parameters, non-Gaussian diffusion can be investigated using appropriate models, such as the kurtosis model, which provides estimates of ADC0; the theoretical “free diffusion” ADC (apparent diffusion coefficient), which would be obtained at a b value of 0 s/mm2; and K, the kurtosis parameter that quantifies the non- Gaussian diffusion effect.
8.1 Using IVIM to Distinguish Malignant from Benign Lesions and Normal Breast Tissue
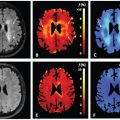
Some studies have revealed that the fp in malignant lesions is significantly higher than that in benign lesions and normal breast tissue [7–9]; however, there is a large overlap with benign lesions. Examples of typical malignant and benign breast lesions are shown in Figs. 8.1 and 8.2. A combination of high flowing blood volume fraction (f IVIM)/high kurtosis (K)/low ADC0 is often observed at the periphery of tumors, while the necrotic central part exhibits an opposite pattern, in good agreement with contrast-enhanced (CE) images in Fig 8.1.
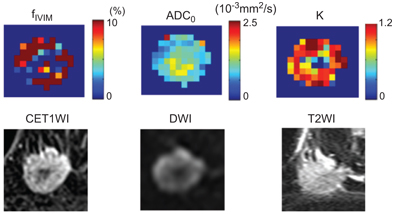
Figure 8.1 f IVIM, ADC0 (theoretical ADC at b value of 0 s/mm2), and K (kurtosis) maps and the conventional MR images of an invasive ductal carcinoma in a 44-year-old woman. (Upper row) f IVIM, ADC0, and K maps. (Lower row), contrast- enhanced (CE) T1-weighted images (T1WI), DWI, and T2-weighted images (T2WI).
Fibroadenomas display a low f IVIM/high ADC0/low K combination, with weak and slow/persistent kinetics in the lesion on dynamic contrast–enhanced magnetic resonance imaging (DCE MRI, Fig 8.2).
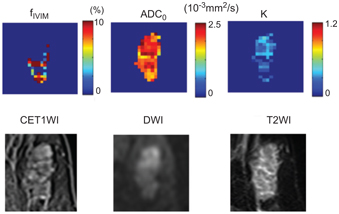
Figure 8.2 f IVIM, K, and ADC0 maps and conventional MR images of a fibroadenoma in a 63-year-old woman. (Upper row) f IVIM, K, and ADC0 maps. (Lower row) CE T1WI, DWI, and T2WI.
Nine studies of IVIM in breast tumor patients, totaling 714 women, are summarized in a review on breast diffusion-weighted imaging (DWI) [10]. According to this review, malignant lesions had significantly lower tissue diffusivity (Dt) values than benign lesions in all five studies that compared malignant to benign lesions, yielding a mean sensitivity of 86 ± 13%, specificity of 81 ± 19%, and accuracy of 84 ± 12%. Malignant lesions had significantly higher fp values in 4 of 5 studies, with a mean sensitivity of 82 ± 8%, specificity of 81 ± 20%, and accuracy of 84 ± 2% compared with benign lesions.
An updated review comprises 15 studies [5,7–9,11–21] on IVIM metrics or analysis in human breast cancer lesions, with a total of 1089 patients. Among these studies, 8 showed significantly lower Dt in malignant lesions (for 7 reporting studies, sensitivity 87±10% and specificity 79±17%) and 7 showed significantly higher fp in malignant lesions (for 6 reporting studies, average sensitivity 81±7% and specificity 75±13%). In all studies reporting diagnostic performance [8,9,11,12,21], IVIM outperformed ADC. The approach of combining parameters to improve diagnostic accuracy has been also explored [11,22–24].
8.2 IVIM for Identification of Prognostic Factors/Subtypes in Breast Cancers
Improvements in breast cancer treatment highlight the increasing importance of prognostic factors [25]. Immunohistochemistry (IHC) biomarkers, such as the estrogen receptor (ER), progesterone receptor (PgR), human epidermal growth factor receptor 2 (HER2), and the proliferation marker Ki-67, together with clinicopathologic features, are conventionally used to classify breast cancer and predict disease outcome [26]. Breast cancer can be classified into several subtypes on the basis of these molecular markers, that is, Luminal A, Luminal B and HER2 negative, Luminal B and HER2 positive, HER2 enriched, and triple negative. Stratification of breast cancer by clinically relevant subtypes is required for treatment planning [27]. More and more studies have investigated this [11,13,14,19,23,24,28]. Interestingly, some researchers have estimated the histogram metrics of IVIM. The findings from each of the above- mentioned studies are summarized in Table 8.1. Some groups found that IVIM and diffusion parameters and their histogram metrics differed depending on ER or PgR expression. Cho et al. reported that fp and pseudodiffusivity (Dp) were significantly correlated with hormonal factor expression (ER or PgR) [11]. They also found that the histogram IVIM parameters might show less vendor system variability and higher combined performance compared to mean IVIM values alone, when comparing data acquired at different MR vendor systems [29]. Suo and colleagues found that the fast component of diffusion (Df) was significantly correlated with Ki- 67 expression, while ADC, the slow component of diffusion (Ds), the fraction of fast diffusion (f), the distributed diffusion coefficient (DDC), and the mean diffusivity (MD) were significantly correlated with ER expression [19].
Table 8.1 Correlation of IVIM and DWI parameters with molecular prognostic factors in breast cancers. All studies were conducted using 3T MRI scanners
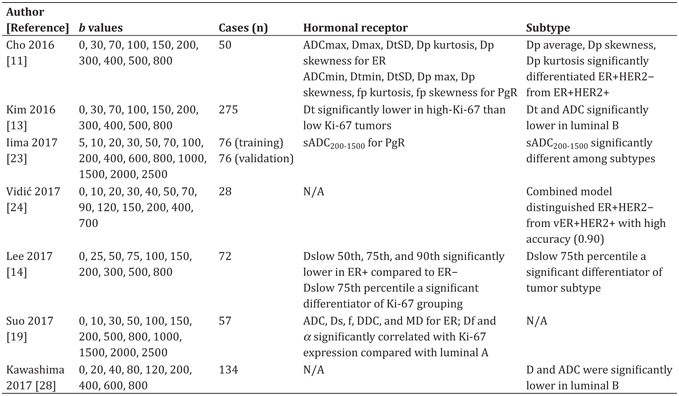
Some IVIM parameters were found to be significantly linked to different tumor subtypes. Iima et al. have found that synthetic ADC (sADC200–1500) (calculated using b = 200 and 1500 s/mm2) was significantly different among tumor subtypes (p = 0.006) [30]. Kim et al. and Kawashima et al. found that both Dt and ADC values in luminal B cancers were significantly lower in luminal A cancers and other tumor subtypes [13, 28].
8.3 The Multiparametric Approach: IVIM in Combination with Dynamic Contrast– Enhanced MRI, DWI, or Positron-Emission Tomography/MRI
DCE MRI has been established as a valuable tool in breast cancer diagnosis, with excellent sensitivity and variable specificity [31, 32]. Multiparametric MRI, including IVIM, has been developed to overcome the limitations in the specificity of DCE MRI [33, 34].
The correlation between IVIM and DCE MRI parameters has been investigated. Liu and colleagues found that combined microvascular volume fraction (f) values had a moderate correlation with the blood volume fraction (V p) (r = 0.692) and a poor correlation with the volume transfer constant (K trans) (r = 0.456) in 36 malignant and 23 benign breast lesions [15]. Jiang and colleagues found that areas under the curve (AUCs) of f plus pseudodiffusion coefficient (D*) (0.834) were not significantly different from the AUCs of DCE-derived parameters (0.876–0.904) [35] in 31 malignant and 35 benign breast lesions. However, a correlation between IVIM parameters and microvascular density obtained from CD31 stain was not observed in a chemically induced rat model of mammary carcinoma [36]. Conversely, numerous studies found a correlation between microvessel density and IVIM parameters in other organs; a correlation was observed between microvessel density and IVIM perfusion measures Dp and fp in mouse colorectal cancer [37] and gastric cancer [38] models and between microvessel density and fp in a rat brain glioma model [6] and a mouse model of hepatocellular carcinoma (HCC) [39], pancreatic ductal adenocarcinomas and pancreatic neuroendocrine tumors [40], and meningiomas [41]. D* and fD* values had correlation with the mean vessel diameter (MVD) in patients with rectal cancer [42]. Dp was significantly correlated with MVD in abdominal organs of mice (r = 0.90, p = 0.037) [43].
Wang and colleagues investigated several indicators, including the initial enhancement ratio (IER), the time-signal intensity curve (TIC), ADC, the diffusion coefficient (D), D*, and f in 23 benign and 31 malignant breast tumors [44]. They found that D derived from IVIM had the highest AUC in distinguishing malignant from benign breast tumors. Both D and TIC were identified as independent predictors of malignancy, with the combination of D and TIC providing an AUC of up to 0.990. Ma et al. assessed the diagnostic performance of DCE MRI and combined DCE MRI and IVIM DWI for 47 benign and 81 malignant breast tumors [16]. DCE MRI provided 90.1% sensitivity, 70.2% specificity, and 82.8% accuracy. The combination of DCE MRI and IVIM DWI provided 88.8% sensitivity, 85.1% specificity, and 87.5% accuracy. The authors concluded that IVIM DWI may be helpful as an adjunct to DCE MRI to improve specificity and accuracy. Dijkstra et al. reported that the combined diagnostic approach of DCE MRI and IVIM improved specificity significantly when compared with DCE MRI alone (from 30.4% to 56.5%; p = 0.016) as a problem solver for distinguishing BI-RADS 3 and 4 lesions in 139 breast lesions (including 7 BI-RADS 3 and 19 BI-RADS 4 lesions) [45].
The clinical usefulness of using IVIM in 18-fluorodeoxyglucose positron-emission tomography/MRI (FDG-PET/MRI) has also been investigated. Ostenson and colleagues found that the correlation coefficient of the standardized uptake value (SUV) and Dt was a significant indicator for distinguishing between treated and nontreated patients. The correlation of SUV and fp was negative for all cohorts, suggesting the possibility that lesions with stronger limited diffusion and greater negative correlation coefficients of SUV with fp might indicate more aggressive tumor growth [17].
The merit of IVIM in combination with other techniques, such as DCE MRI or FDG-PET/MRI, includes the potential to improve the diagnostic accuracy or predict the treatment response of breast cancers without any gadolinium contrast agents. The multiparametric approach can be applied using only DWI-related parameters. Recent studies have shown improved diagnostic performance for differentiation between malignant and benign breast tumors using an IVIM and DWI multiparametric method with a support vector machine [24, 46]. Combined IVIM parameters provided significantly better specificity than ADC alone (43.5%–52.5% vs. 13.0%–21.7%, p ≤ 0.0034), using a semiautomated method in 139 breast lesions [12]. It has been shown that a multiparametric approach combining only IVIM and non-Gaussian DWI is almost as accurate as the current diagnostic performance for the differentiation of malignant and benign breast tumors using BI-RADS for MRI [30]. Our study comprised 199 patients with breast tumors. Multiparametric threshold scores or probabilities using Bayesian analysis were established to maximize the diagnostic ability of flowing blood volume fraction (f IVIM), ADC0, and K parameters. Sensitivity and specificity with two independent radiologists interpreting ranges between 89.5%–96.1% and 66.7%–88.3%, respectively, for the multiparametric DWI approach, which is comparable to those for BI- RADS (100% sensitivity and 79.2% specificity). These diffusion MRI- derived approaches have the potential to be an appealing alternative to DCE MRI in patients in whom contrast agents are contraindicated, such as pregnant patients or patients with renal dysfunction. This is also an important feature to consider given the accumulating evidence of gadolinium deposition in the brain [47].
8.4 IVIM for Prediction of the Treatment Response
The performance of IVIM in the prediction of the treatment response (mainly neoadjuvant chemotherapy [NAC]) in breast cancer has been recently explored. Cho and colleagues found that the pretreatment average, skewness, and K of Dp were significant differentiators of responders from nonresponders in 32 lesions [48]. Kim and colleagues assessed 46 patients with stage II or III breast cancer and found that pretreatment IVIM histogram parameters, including the mean, 25th percentile, 50th percentile, and 75th percentile of D obtained from the histogram of the whole tumor (D mean, D 25, D 50, and D 75, respectively), were significantly higher in good responders than in poorer responders [49]. Che et al. showed that the f value before NAC of patients with a pathologic complete response (pCR) was significantly larger than that of non-pCR patients and the change in f after two cycles of NAC was also significantly larger than that in the non-pCR group in 28 patients with locally advanced breast cancer [50]. These IVIM values and histogram metrics might serve as prognostic biomarkers for the selection of neoadjuvant treatment.
IVIM has also been investigated for the evaluation of radiotherapy response in bone metastases from breast cancer [51] or prediction of the outcome [52], early arterial blood flow stasis, or tumor size change and RECIST response [53] in radioembolization of liver metastases from breast cancer.
8.5 IVIM in Lactation
Evaluation of the lactating breast by DCE MRI is challenging due to marked background parenchymal enhancement. IVIM might be a promising alternative method in this context, yet baseline data are currently limited. Breast appearance in lactation depends upon milk content (i.e., pre- or post-breastfeeding). Nissan et al. have reported a significant change in diffusion tensor imaging (DTI) parameters (larger MD and lower fractional anisotropy [FA]) in lactating compared with postweaning women [54]. However, no evidence exists on the optimal timing to scan lactating breasts (i.e., pre- or post-breastfeeding) so far. We have investigated the effect of breastfeeding on IVIM and non-Gaussian diffusion (NGD) parameters in lactating women (Fig 8.3). A significant increase in f IVIM values after breastfeeding (1.97 vs. 2.97%, p < 0.01) was found [55], consistent with increased milk flow in ducts, as milk production is stimulated by breastfeeding [56]. Significant decreases in ADC0 and sADC values, as well as increases in K values, in post- compared with pre-breastfeeding were found in the study.

Figure 8.3 Increase in post-breastfeeding f IVIM and decrease in post- breastfeeding ADC0 values can be observed compared with pre-breastfeeding values.
8.6 Optimal Fitting Method and Choice of b Values
Conventional IVIM assumes the biexponential model, which can be numerically challenging without special care in fitting. Several approaches have been explored to overcome this challenge, and IVIM parameters were compared using different curve-fitting methods [57, 58]. Cho and colleagues have compared “free” (conventional biexponential) and “segmented” (two-step) fitting both for conventional (0, 30, 70, 100, 150, 200, 300, 400, 500, and 800 s/ mm2) and optimized (0 and 3 repetitions of 20, 300, and 800 s/mm2) b value datasets. They found that segmented fitting with optimized b values provided higher precision and accuracy in 14 patients with breast cancer. Relative bias in fp and Dt was reduced significantly with segmented compared with free-fitting approaches. Notably, their simulations and patient experiments indicate that fp values estimated with free fitting (20.39%–21.41%) were more than twice as high as those estimated with segmented fitting (6.00%–7.89%), with a signal-to-noise ratio (SNR) = 10 in breast cancer (see more detailed results along different SNR values in Table 1 by Cho et al., Ref. [57]).
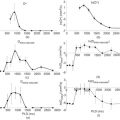
Similar results was found by Suo and colleagues [58]. They used seven b values (0, 50, 100, 150, 200, 500, and 800 s/mm2) and reported that the precision of D* and f determination was maximized with Method 2 (first estimation of D and then estimation of f and D*) and Method 3 (first estimation of D and f and then estimation of D*). They also found that the f value with (conventional) direct fitting with a biexponential model (Method 1; 16.33 ± 5.21%) was significantly larger than with segmented fitting (Method 2; 7.61 ± 2.33%; Method 3; 6.10 ± 3.19%). Moreover, f estimated using Method 2 showed moderate correlation with the relative enhancement ratio (RER) and the initial area under the curve (iAUC) from DCE MRI. Investigating 29 breast tumors, Yuan et al. have reported that the biexponential model does not necessarily better represent the DWI signal decay compared with the monoexponential model [20]; however, they used b values up to 1000 s/mm2, and the analysis might have been partially confounded by non-Gaussian effects observed at high b values. It is important to be aware that non-Gaussian DWI (kurtosis) and noise floor effects are observed at high b values and b needs to be kept low enough to keep the signal free from these effects (Fig 8.4) [59]. b values reached up to approximately 200 s/mm2 when the initial IVIM model was developed by Le Bihan et al. [4]; thus NGD effects when using medium or high b values were not considered at that time. The IVIM effect can be overestimated when using higher b values, as shown in Fig 8.4, and those high IVIM (f, fp, f IVIM) values likely reflect residual tissue diffusion non-Gaussianity. The artifactual IVIM effect will increase with increasing b values. More importantly, malignant tissues have more curvature in the signal decay, so the artifactual IVIM effect will be greater for malignant lesions than benign lesions or normal tissue where curvature is less expected (the estimation of both IVIM and non-Gaussian DWI with noise correction is described in Ref. [7]).
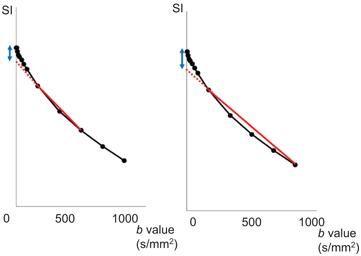
Figure 8.4 Pitfalls in the estimation of IVIM parameters illustrated by example data. An example of signal attenuation in typical malignant breast tissue. IVIM estimation includes b values up to 600 s/mm2 (left) and 1000 s/mm2 (right). The red line indicates apparent diffusion coefficient between b values of 200 and 600 s/mm2 (left), and between b values of 200 and 1000 s/mm2 (right). The IVIM effect is exaggerated (the blue arrow in the figure on the right compared to that in the figure on the left) if one includes larger b values (>800–1000 s/mm2), because of the lower degree of signal attenuation at high b values due to the non-Gaussian DWI and noise floor effects. SI: signal intensity
Stay updated, free articles. Join our Telegram channel

Full access? Get Clinical Tree


