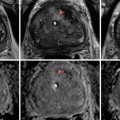
Fig. 17.1
CT scan with IV contrast showing a right renal mass with renal vein and IVC thrombus (arrow). The renal mass on the right is heterogeneous. The left kidney has an upper pole simple cyst that measures 9 HU (arrowhead)
Imaging for Kidney Pathology
The kidney plays an essential role in blood filtration and the maintenance of electrolyte levels. It is a well-vascularized organ receiving about 20 % of the cardiac output and plays an important role in the regulation of blood pressure. Several pathologies develop in the adult kidney and are not limited to renal masses, obstruction with and without hydronephrosis, nephrolithiasis, lymphoma, and urothelial carcinoma. Renal masses are found in the parenchyma or collecting system. Those are usually solid or cystic and are differentiated by imaging. Renal masses will be discussed in detail later in the chapter.
Collecting system or ureteral obstruction often leads to hydronephrosis and symptoms such as pain. Typically, patients with abdominal or flank/back pain are evaluated with US or CT. Both modalities are suitable to detect and grade hydronephrosis. Grading is done based on the Society for Fetal Urology (SFU) grading system established in 1993. Patients without calyx or pelvic dilation are classified as grade 0, pelvic dilation only as grade 1, mild calyx dilation as grade 2, severe calyx dilation as grade 3, and calyx dilation accompanied by renal parenchymal atrophy as grade 4 [2] (Tables 17.1 and Fig. 17.2).
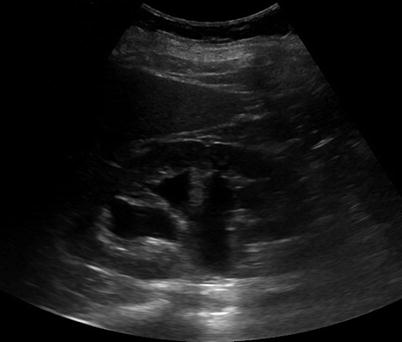
Table 17.1
SFU grading of hydronephrosis
SFU grade | |
|---|---|
0 | No calyx or pelvic dilation |
1 | Pelvic dilation only |
2 | Mild calyx dilation |
3 | Severe calyx dilation |
4 | Calyx dilation accompanied by renal parenchymal atrophy |
Fig. 17.2
Ultrasound image showing hydronephrosis with dilated pelvis and calyxes consistent with grade III SFU hydronephrosis
Nephrolithiasis is a major cause of obstruction and pathology of the kidney. While this topic is beyond the scope of this chapter, it will be discussed briefly. Imaging has an essential role in the diagnosis, management, and follow-up of patients with stone disease. A variety of imaging modalities are available for evaluation including conventional radiography such as x-ray of the kidney, ureters, and bladder (KUB), US, MR urography, and CT scans, each with its advantages and limitations. Intravenous urograms (IVU) were used in the past and this modality has declined in its utility with the increasing use of CT. In some scenarios, especially in patients with poor renal function, to better identify the exact stone location or collecting system anatomy, there may be a role for cystoscopy and a retrograde pyelogram.
There are several types of stones based on composition. The most common kidney stones in the United States are calcium based [3]. Other encountered stones include uric acid, magnesium ammonium phosphate, cystine, and indinavir stones. A KUB can be used to identify large calcium-based stones; however, uric acid stones are missed as the majority are radiolucent. Detection of stones by KUB may also be hindered by overlying bowel gas, patient body habitus, and extrarenal calcifications such as phleboliths. The advantages of a KUB include its wide availability, minimal radiation exposure, and low cost. US, the preferred imaging modality in pregnancy [4, 5], may be used in the evaluation of nephrolithiasis including uric acid stones. Advantages of US include its noninvasiveness, lack of radiation and intravenous contrast, and wide availability and relatively low cost. Limitations include poor sensitivity for ureteral stones and stones smaller than 3 mm [6]. In addition, US is highly nonspecific and may be unable to differentiate between ureteral obstruction secondary to calculi and physiologic hydronephrosis of pregnancy [5]. In these situations, further imaging with unenhanced CT, the gold standard for diagnosis of urinary calculi, may be required. Interestingly, the recent study published in the New England Journal of Medicine comparing US versus CT for nephrolithiasis showed that patients who were imaged with an US as the initial imaging modality were exposed to a lower total amount of radiation than were patients who received CT as the initial imaging modality, with no significant difference in high-risk diagnoses with complications, total serious adverse events, or related serious adverse events. The secondary outcomes of pain scores, hospital admissions, and emergency department readmissions during follow-up also did not differ significantly among the groups [7]. CT provides more information on the location of stones, nearby anatomy, and may aid in determining composition by measuring stone density using Hounsfield Unit (HU) measurements. Significant difference is seen in HU between pure uric acid stones and other stone types. Kuwahara et al. conclude that the determination of calculus composition by HU measurement is possible only for oxalate calculi of more than 1,600 HU and uric acid calculi of less than 500 HU [8]. CT is also useful in identifying other abdominal pathologies that may mimic symptoms of nephrolithiasis such as appendicitis, cholecystitis, and ovarian pathologies.
MRI is sometimes used in the evaluation of nephrolithiasis especially in pregnant women; however, it has a limited use in nephrolithiasis as it is expensive, time consuming, and not readily available. In addition, distinguishing stones from tumors or blood clot can be difficult because these entities all appear as a signal void [6]. While MRI is relatively insensitive for the direct detection of urinary calculi, it has the ability to detect the secondary effects of obstructive urolithiasis. Using rapid, single-shot abdominopelvic T2-weighted sequences with and without fat saturation provides an examination that can detect the sequelae of clinically active stone disease, in addition to alternate inflammatory processes that may mimic the symptoms of renal colic [9].
Other causes of obstruction include ureteropelvic junction (UPJ) obstruction congenital and acquired due to a crossing vessel (Fig. 17.3), stricture, trauma, etc. These conditions are commonly evaluated with CT and MRI. CT angiography may be used to evaluate UPJ obstruction due to a crossing vessel and can be used in surgical planning. Krepkin et al. evaluated the use of MR renography (MRR) and concluded that in patients with UPJ obstruction MRR can measure split renal function, estimate the glomerular filtration rate with moderate correlation, and accurately discriminate mechanical from functional obstruction [10].
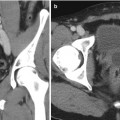
Fig. 17.3
CT angiogram showing right hydronephrosis caused by a crossing vessel at the ureteropelvic junction. The artery can be seen branching off the aorta and supplying the lower pole of the right kidney (arrow)
Urothelial Carcinoma
Solid masses can be present in the renal parenchyma or collecting system. When the collecting system is involved, urothelial carcinoma (UC) should be considered. Imaging with a delayed excretory phase is best for evaluation of the collecting system. Patients precluded from receiving intravenous contrast agents may particularly benefit from MR urography. UC occurs mainly in the bladder but could also develop in the upper urinary tract and account for 5–10 % of urothelial carcinomas. In the upper tract, it most frequently arises in the renal pelvis, followed by the infundibular and calyceal regions. Contrast-enhanced CT and MRI have become the most widely used imaging modalities for radiological evaluation of the upper urinary tract. On unenhanced studies, the intraluminal portion of a lesion often shows increased attenuation with respect to surrounding urine. UC does not typically deform the renal contour. In rare cases, invasion of sinus structures with infiltration of the sinus fat or collecting system elements may be subtle indicators of a UC presence on unenhanced images. After contrast administration, the mass typically enhances, although to a lesser degree than normal renal parenchyma and to a lesser degree than conventional RCC. CT urography which includes excretory-phase imaging improves visualization of collecting system abnormalities, and these lesions sometimes are seen as sessile filling defects. While CT urogram is the most common modality used for upper tract UC, diffusion-weighted MRI (DW-MRI) is gaining popularity. DW-MRI is a type of functional imaging, which is increasingly being utilized and provides helpful information for the diagnosis of UC in a noninvasive manner. The addition of DW-MRI to a routine MRI protocol requires only a few minutes, and it can be acquired using most current clinical MRI scanners. Growing evidence has emerged showing that DW-MRI can serve as an imaging biomarker for characterizing the pathophysiology of cancer. The imaging signal confers information about the biophysical properties of tissues, such as cell organization and density. The apparent diffusion coefficient (ADC) measures the magnitude of diffusion of water molecules within tissue using DW-MRI. Sasamori et al. found that the mean ADC of infiltrating UC was significantly lower than that of clear cell RCC, possibly reflecting the high cellularity of UC [11]. The potential of DW-MRI as an imaging biomarker is just emerging, and further studies are essential to validate and standardize this modality [12]. UC is typically isointense relative to the renal medulla on T1-weighted images, making the detection of small tumors in the collecting system virtually impossible. Larger infiltrative tumors may obliterate the fat in the renal sinus, which may be appreciated on T1-weighted images without the use of fat-saturation techniques. Enhancement of a focal filling defect in the collecting system is strongly suggestive of a UC. Differentiation between blood clots and enhancing filling defects is best accomplished by reviewing subtracted data sets.
Lymphoma
The kidney is one of the abdominal organs in which extranodal lymphoma can be found, and just like metastatic disease to the kidney, renal lymphoma is usually clinically silent. Lymphoma may involve the kidneys via hematogenous spread, in which a single mass or multiple bilateral masses are present, or by direct extension of retroperitoneal lymphoma. Lymphoma may mimic RCC and in some cases difficult to differentiate. Diffuse lymphomatous infiltration producing smooth generalized renal enlargement occurs in approximately 20 % of patients, and it is almost always bilateral. When lymphoma diffusely infiltrates a kidney, the kidney enlarges but maintains its reniform shape [13]. On CT imaging, renal lymphoma is seen as a soft tissue attenuation mass that enhances homogeneously but less intensely than normal renal parenchyma after contrast material administration. Nephrographic phase CT imaging is essential, since lymphomatous deposits in the kidney may be small and medullary in location, making them inconspicuous on corticomedullary phase images. On MRI, relative to the renal cortex, lymphomatous masses are isointense or slightly hypointense on T1-weighted MRI and hypointense on T2-weighted images. Minimal heterogeneous enhancement is seen on early and delayed gadolinium-enhanced MRI in most patients. In addition, patients with renal lymphoma nearly always have evidence of disease elsewhere. If imaging findings are typical, then differentiation from RCC is usually not in question yet the biopsy is usually performed to confirm the diagnosis of lymphoma. In this situation, systemic therapy for lymphoma can be instituted, with the anticipation that the renal disease will respond in the same manner as the systemic disease. On rare occasions, renal lymphoma occurs as a solitary mass or exhibits unusual imaging characteristics, making differentiation from RCC difficult. In these circumstances, image-guided biopsy results are also diagnostic [14].
Renal Cysts and Masses
Renal masses are divided into cystic and solid. Renal cysts are among the most common renal lesions detected on cross-sectional imaging. While the majority are isodense to water with an attenuation values of <20 HU and easily diagnosed on CT, some renal cysts do not fulfill the established diagnostic criteria and can prove difficult to define. Simple cysts are best defined using sonographic criteria. These include (1) absence of internal echoes, (2) posterior enhancement, (3) round/oval shape, and (4) sharp, thin posterior walls. Since its publication in 1986, the Bosniak classification of renal cysts has been widely used to classify these lesions and to separate cystic lesions that can be safely followed from those requiring surgical resection (Table 17.2; Fig. 17.4) [15]. Because differentiating Bosniak II and III cysts was found to be particularly challenging, the original classification system was modified to a II F intermediate group [16]. Although other imaging modalities are frequently used in the evaluation of renal masses such as US and MRI, CT with and without contrast enhancement remains the primary diagnostic technique [17]. Currently, it is not recommended to use US for the initial evaluation of complex cystic renal masses largely because contrast enhancement, which is an important criterion for malignancy, cannot be assessed [18]. On the other hand, studies have shown that MRI features correlate well with histopathologic and CT findings and therefore MRI is an appropriate modality for cyst classification [18]. MRI may be used in equivocal cases to identify very thin septa or demonstrate enhancement not otherwise perceived on CT. The presence of enhancement within a renal lesion after the administration of gadolinium-based contrast material is the most reliable criterion for distinguishing solid masses from cysts. Comparison of pre- and postcontrast T1-weighted images is the key to the detection and characterization of renal lesions. Precontrast T1-weighted images are helpful in the characterization of certain aspects of cystic and solid lesions. Simple cysts are hypointense relative to the normal renal parenchyma on T1-weighted images due to their long relaxation time. Increased signal intensity within cysts may indicate the presence of hemorrhage or proteinaceous fluid. Similarly, hemorrhagic solid renal masses may display areas of increased signal intensity on T1-weighted images. Simple cysts are markedly T2 hyperintense, have a thin or imperceptible wall, display no internal architecture, and do not enhance. For cysts requiring follow-up, US and MRI are often used to minimize patient exposure to radiation.
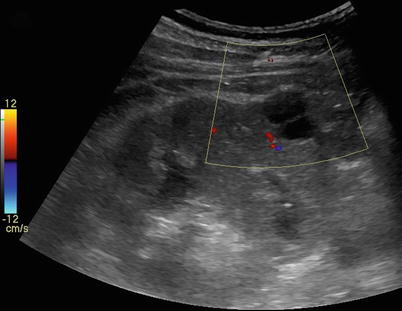
Table 17.2
Bosniak classification of renal cysts
Category I: malignant risk less than 1 %; no follow-up required Uncomplicated, simple benign cyst Anechoic, posterior enhancement (through transmission), round or oval shape, thin, smooth wall Homogeneous water content, sharp delineation with the renal parenchyma, no calcification, enhancement, or wall thickening |
Category II: malignant risk less than 3 %; no follow-up required <1 mm septations (hairline thin) Fine calcifications within the septum or wall <3 cm in diameter Hyperdense cysts (>20 Hounsfield units) |
Category IIF: malignant risk 5–10 %; follow-up recommended Multiple thin septum Septa thicker than hairline or slightly thick wall Calcification, which may be thick Intrarenal, >3 cm No contrast enhancement |
Category III: malignant risk 40–60 %; surgical excision recommended Uniform wall thickening/nodularity Thick/irregular calcification Thick septa Enhances with contrast |
Category IV: malignant risk greater than 80 %; surgical excision recommended Large cystic components Irregular margins/prominent nodules Solid-enhancing elements, independent of septa |
Fig. 17.4
Renal US of a patient showing a renal cyst with one septation
Metastases to the Kidney
The most common tumor to metastasize to the kidney is carcinoma of the lung. Renal metastases may be multiple and bilateral and frequently are associated with metastases to other organs. Although they have nonspecific CT and MRI features, renal metastases commonly demonstrate infiltrative growth patterns. When the clinical history is available, the diagnosis may be obvious. In a patient with a history of malignancy without other metastases and a solitary renal mass, the renal mass is more likely to represent a renal cell carcinoma and not a metastasis. Nevertheless, it is possible that a single renal metastasis could occur, and differentiation from a renal cell carcinoma may not be obvious. In this situation, a renal biopsy may be diagnostic [13].
This chapter will now focus on imaging modalities to evaluate solid renal masses. As we have already discussed, different imaging modalities are available to the practicing urologist for the evaluation of a renal mass. The goal of renal lesion characterization by CT or MRI is to separate surgical lesions (RCC, cystic renal cell carcinoma, oncocytoma) from nonsurgical lesions (cyst, hemorrhagic cyst, angiomyolipoma (AML), pseudotumor). While US is a safe and readily available modality at a low cost, its use can be limited by body habitus as the sound waves are highly attenuated by the excess body tissue. 3–7 MHz transducers are used to evaluate the kidneys and surrounding structures such as the inferior vena cava (IVC) and renal veins. US can be helpful in assessing the IVC for tumor thrombus and evaluating the extent of the thrombus. However, CT and MRI have the advantage of identifying metastatic disease (Fig. 17.5) and to differentiate tumor thrombus from bland thrombus, because tumor thrombus is vascular unlike bland thrombus. US is also used intraoperatively to identify the extent of the thrombus as well as to locate multiple solid masses in multifocal RCC.
Fig. 17.5
CT scan with IV contrast showing a patient with right renal mass with retroperitoneal lymphadenopathy (arrow) and infiltration of Gerota’s fascia (arrow)
Contrast-Enhanced Ultrasound
Contrast-enhanced ultrasound (CEUS) is a modality developed over the last decade. It provides blood flow and tissue perfusion information based on a microbubble contrast agent and contrast-specific imaging software. Ultrasound contrast agents remain in the vascular system and are not excreted into the renal collecting system so these agents are not nephrotoxic and can be administered in patients with renal insufficiency. The microbubbles are removed from circulation by the lungs and liver. There is growing clinical evidence that CEUS is a reliable diagnostic tool in differentiating solid tumors and complicated cysts of the kidney and in the classification of cystic lesions as benign or malignant. Solid renal tumors generally show an early intense arterial enhancement equal or greater than that of the surrounding renal parenchyma. Intralesional areas without contrast enhancement suggest the presence of necrosis [19]. CEUS use has also been described to be as effective as CT and MRI for the follow-up of small renal masses after cryoablation [20]. While CEUS is being used in other countries for the evaluation of liver and kidney lesions, it is only approved in the United States by the FDA for use in cardiac imaging.
Computed Tomography
Four distinct phases of renal enhancement can be imaged depending on acquisition time. The timing of these phases varies with the speed of intravenous contrast injection [21].
1.
Arterial phase: This is a short phase, which occurs at about 15–25 seconds after the initiation of intravenous contrast injection; there is maximum opacification of the renal arteries during this phase. The renal veins also usually opacify in the late arterial phase.
2.
Corticomedullary phase: This phase starts at about 25–70 seconds after the initiation of intravenous contrast injection. There is intense enhancement of the renal cortex due to preferential arterial flow to the cortex and glomerular filtration of the contrast material while the medulla remains relatively less enhanced. This phase provides information about the vascularity of solid renal masses and is also the best phase for maximum opacification of the renal veins.
3.
Nephrographic phase: This phase begins at 80–120 seconds and the contrast filters through the glomeruli into the collecting ducts and provides homogeneous enhancement of the normal renal parenchyma. This is the best phase for the detection of subtle parenchymal lesions.
4.
Excretory phase: Starts at 180 seconds and at this point the contrast excretion allows opacification of the calyces, renal pelvis, and ureters, while the intensity of the nephrogram progressively declines. For a complete excretory phase, images at 240 seconds should be acquired to ensure opacification of the ureter.
For evaluation of renal masses, a minimum of two acquisition sequences are required for detection and characterization of renal lesions. An initial series of unenhanced scans provides a baseline to measure the enhancement within the lesion after the administration of intravenous contrast and a corticomedullary or nephrographic phase [22, 23


Related posts:
Stay updated, free articles. Join our Telegram channel
Full access? Get Clinical Tree
