Kidneys
Anatomy of the Retroperitoneal Space
A detailed understanding of the retroperitoneal fascial planes and compartments is a prerequisite for accurate interpretation of abdominal CT. The retroperitoneum is the anatomic compartment between the posterior parietal peritoneum and the transversalis fascia extending from the diaphragm to the pelvic brim. It is divided into three distinct compartments—anterior pararenal, perirenal, and posterior pararenal spaces—by the anterior renal fascia and posterior renal fascia ( Fig. 15.1 ).
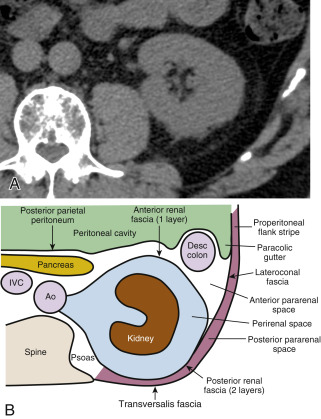
The anterior pararenal space extends between the posterior parietal peritoneum and the anterior renal fascia. It is bounded laterally by the lateroconal fascia, which is the continuation of the posterior layer of the posterior renal fascia. The pancreas, duodenal loop, and ascending and descending portions of the colon are enveloped by fat within the anterior pararenal space. This compartment is continuous across the midline, allowing spread of fluid processes and gas.
The anterior renal fascia and posterior renal fascia encompass the kidney, renal pelvis, proximal part of the ureter, adrenal gland, renal and perirenal blood vessels, and lymphatics invested by perirenal fat within the perirenal space . The perirenal space is an inverted cone shape extending from the diaphragmatic fascia to the iliac fossa. The anterior renal fascia (Gerota fascia) is thin and consists of one layer of connective tissue. The posterior renal fascia (Zuckerkandl fascia) is thicker and consists of two layers of connective tissue. The anterior layer of the posterior renal fascia is continuous with the anterior renal fascia. The posterior layer of the posterior renal fascia is continuous with the lateroconal fascia, forming the lateral boundary of the anterior pararenal space. The anterior and posterior layers of the posterior renal fascia may be separated by inflammatory processes, such as pancreatitis, extending from the anterior pararenal space. The perirenal space is discontinuous across the midline owing to fusion of the renal fascial layers with connective tissues surrounding the aorta and inferior vena cava. The perirenal space on the right abuts the bare area of the liver, allowing spread of inflammatory and neoplastic processes from the right kidney to the liver. On the left the perirenal space abuts the left subphrenic space. The ureter passes through the apex of the cone of the perirenal space as it courses to the pelvis.
The posterior pararenal space is a potential space, occupied only by fat, blood vessels, and lymphatics, extending from the posterior renal fascia to the transversalis fascia. The posterior pararenal fat continues into the flank as the properitoneal fat stripe seen on conventional radiographs of the abdomen. Air and fluid processes in this compartment may extend to the anterior abdominal wall. This compartment does not extend across the midline, limited medially by the lateral edge of the psoas and quadratus lumborum muscles.
The kidneys are covered by a tight fibrous capsule that produces a sharp margin defined by perirenal fat on CT. The perirenal fat extends into the renal sinus, outlining blood vessels and the renal collecting system. Connective tissue septa extend between the fibrous capsule of the kidney and the renal fascia. These septa divide the perirenal space into multiple compartments and may be seen as prominent stranding densities in the perirenal fat when they are thickened by inflammation, hemorrhage, or ischemia. Inflammatory fluid or hemorrhage in the perirenal space is not free flowing but is compartmentalized by these bands of fascia. Collections of fluid or blood beneath the fibrous capsule of the kidney will compress and distort the renal parenchyma, often without affecting the perirenal fat.
The renal arteries and veins can be identified from the great vessels to the kidneys. The right renal artery courses behind the vena cava. The right renal vein extends anterior to the right renal artery directly from the right kidney to the vena cava. The left renal vein crosses between the aorta and the superior mesenteric artery, passing anterior to the left renal artery, which extends directly from the aorta to the left kidney. The aorta, inferior vena cava, and their branches are invested by fascial layers that usually, but not always, prevent communication with the pararenal and perirenal spaces.
Technical Considerations
Because the kidneys actively concentrate contrast medium within the parenchyma, most renal abnormalities are best seen on CT after intravenous contrast medium administration. Unenhanced CT is performed to demonstrate calcifications and calculi that may be obscured by contrast medium administration. Multidetector CT (MDCT) is optimal for renal evaluation and is the current technique of choice. The sensitivity for detection of renal masses differs considerably with the imaging modality: 67% for traditional excretory urography, 79% for sonography, and at least 95% for MDCT.
- •
The CT urogram (CT intravenous pyelogram – also known as the CT-IVP) has evolved as the imaging method of choice to provide the most comprehensive evaluation of the urinary tract, often used in the setting of hematuria:
- –
No bowel preparation or oral contrast medium is needed. A noncontrast CT scan is obtained from the kidneys through the bladder to document the presence of calculi or parenchymal calcifications.
- –
Between 125 and 150 mL of 60% iodine nonionic contrast medium is injected intravenously at 3 to 4 mL per second.
- –
A nephrogram phase scan is obtained at 80-second scan delay with 2.5-mm or thinner collimation and a single breath hold.
- –
A pyelogram phase scan is obtained at 5 to 8 minutes after contrast medium injection with thin slices (1.25 mm) through the full length of kidneys, ureters, and bladder. Images are reconstructed in axial, coronal, and sagittal planes ( Fig. 15.2 ).

FIG. 15.2
CT urogram.
(A) Coronal view of the left kidney showing normal calyces appearing as cup-shaped (arrow) or circular (arrowhead) structures depending on the plane of the CT section. (B) An oblique view of the left kidney, collecting system (arrowhead) , ureter (arrows) , and bladder (B) was created from a series of thin-slice axial CT images. It nicely demonstrates the course and size of the ureter. Portions of the normal ureter may be nonopacified because of ureteral peristalsis.
- –
- •
CT for renal masses. We use MDCT with contiguous thin slices with a single breath hold at identical locations before and after bolus contrast medium administration.
- –
A precontrast scan is performed through both kidneys ( Fig. 15.3A ) to document the presence of calculi and calcifications and to serve as a baseline to assess lesion enhancement.

FIG. 15.3
CT of renal mass.
Noncontrast (A), corticomedullary phase (B and C), and nephrogram phase (D) images from a helical CT study demonstrating a small renal carcinoma (arrowheads) arising from the left kidney. The tumor is nearly isointense with the renal parenchyma in the noncontrast study. Early arterial enhancement of the tumor coincides with enhancement of the renal cortex on the corticomedullary phase images. The tumor is mildly hypointense compared with the renal parenchyma during the nephrogram phase.
- –
Between 100 and 150 mL of 60% iodine nonionic contrast medium is given intravenously by a power injector at 2.5 to 3.0 mL per second.
- –
A corticomedullary phase scan is obtained with a 30-second scan delay ( Fig. 15.3B and C ). This scan extends from the dome of the diaphragm through the bottom of the kidneys. Scanning during this phase is used to evaluate other abdominal organs for metastatic disease and to evaluate the renal arteries and veins.
- –
A nephrogram phase scan is obtained at 80 to 90 seconds after contrast medium administration ( Fig. 15.3D ). The scan extent includes only the kidneys from top to bottom.
- –
A pyelogram phase scan is added at 3 to 5 minutes after injection of contrast medium.
- –
The scan may be continued through the pelvis to evaluate the retroperitoneum, ureters, and bladder.
- –
- •
Corticomedullary phase scans. When one is scanning the abdomen for reasons other than renal mass characterization, renal images are commonly obtained with contrast enhancement limited to the renal cortex ( Fig. 15.3B and C ). The corticomedullary phase is usually seen at about 30 to 50 seconds after contrast medium injection into an arm vein. This phase is of limited use for detection of renal masses because only the renal cortex is enhanced and the medullary portions of the kidney remain unenhanced. The corticomedullary phase defines the renal artery and vein better than the nephrogram phase.
- •
Stone protocol CT. Renal stone CT (sometimes called CT-KUB – CT of the kidneys, ureters, and bladder) is a noncontrast helical MDCT of the urinary tract used to diagnose the presence of urinary tract calculi and to detect acute urinary tract obstruction caused by stones.
- –
No oral or intravenous contrast medium is administered.
- –
Data acquisition is continuous from the top of the kidneys through the base of the bladder (mid-T12 level through the pubic symphysis) with use of 0.625- to 2.5-mm collimation. Images may be viewed at 1.25- to 2.5-mm slice thickness. Thin slices allow identification of very small stones that may be overlooked with thicker slices.
- –
Turning the patient to the prone position will allow differentiation of stones impacted at the ureterovesical junction from stones that have already passed into the bladder.
- –
Whenever the noncontrast renal stone CT findings are equivocal, intravenous contrast medium may be given to clarify the diagnosis.
- –
Congenital Anomalies
Horseshoe Kidney
Congenital fusion of the lower poles of the kidneys is a relatively common (1 in 400 births) congenital anomaly.
- •
The isthmus extends across the aorta just below the origin of the inferior mesenteric artery, which prevents the normal ascent of the kidneys to the renal beds ( Fig. 15.4 ). The tissue connecting the lower poles of the kidneys may be functioning renal parenchyma or fibrous bands

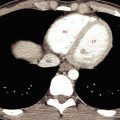
FIG. 15.4
Horseshoe kidney.
The lower poles of the right kidney (R) and the left kidney (L) are fused across the midline anterior to the aorta (A) and inferior vena cava (V) . The fused kidney is held low in position within the abdomen because its ascent to its normal location is impaired by the origin of the inferior mesenteric artery (arrow) .
- •
The fused kidneys are low in position and malrotated, with the renal pelvis directed anteriorly and the lower poles converging instead of diverging. Malposition is associated with multiple renal arteries of anomalous origin and urinary stasis often resulting in stone formation and recurrent infection. Venous drainage is also usually aberrant.
- •
In one-third of cases other congenital anomalies of the urologic, skeletal, neurologic, and gastrointestinal systems are also present.
- •
Transitional cell carcinoma (TCC) is three to four times more common in individuals with horseshoe kidneys than in the general population.
Renal Masses
The features that must be evaluated to characterize a renal mass are the presence and type of calcification, attenuation of the mass before and after contrast medium administration, the margin of the mass with the kidney and with surrounding tissues, and the presence and thickness of septa and the thickness of the wall of cystic masses. Artifactual pseudoenhancement, related to a beam-hardening effect from iodinated contrast medium, may increase attenuation of lesions by up to 10 Hounsfield units (HU). Attenuation must increase by a minimum of 20 HU following bolus intravenous contrast medium administration to be considered enhancement. An increase in attenuation of less than 10 HU is not considered enhancement. An increase in attenuation of 10 to 20 HU is equivocal enhancement.
Renal Cell Carcinoma
Renal cell carcinoma (RCC) accounts for 90% of solid tumors of the kidney. Most large lesions can be easily diagnosed by CT. Small lesions are commonly indeterminate. About 15% to 20% of small solid renal tumors are benign. Histologic subtypes of RCC have distinctive imaging findings and differ in treatment response and prognosis:
- •
Clear cell, also called conventional, RCC accounts for 70% of RCCs. Tumors are typically heterogeneous with mixtures of solid tissue, cysts, and foci of hemorrhage and necrosis ( Fig. 15.5 ). Tumors arise from the renal cortex and show expansile growth with hypervascularity. Tumor enhancement is greatest, typically exceeding 84 HU, in the corticomedullary phase and remains high in the nephrogram and excretory phases. Multicentric and bilateral tumors are rare (<5%). Clear cell RCC has the least favorable prognosis.

FIG. 15.5
Bilateral clear cell renal cell carcinomas.
Renal cell carcinomas (C) arise from the upper poles of both kidneys. The low-attenuation regions within the tumors are areas of necrosis and hemorrhage. Enhanced tumor vessels (arrow) are seen in the perirenal fat. Metastases are present in the liver (arrowheads) .
- •
Multilocular cystic RCC is a variant of clear cell RCC. Clusters of cysts of variable size are bound by a thin fibrous capsule and have septa of variable thickness that are lined with clear cell RCC ( Fig. 15.6 ). About 20% have calcification in the wall or septa. Cystic RCCs show slower growth and have lower propensity for metastases and tumor recurrence than solid tumors.

FIG. 15.6
Multilocular cystic renal cell carcinoma.
Nephrogram phase CT image showing a low-attenuation heterogeneous mass projecting from the left kidney. Enhanced septa (arrows) are faintly demonstrated.
- •
Papillary (chromophil) RCCs account for 10% to 15% of RCCs. They occur most commonly in end-stage failed kidneys arising from distal convoluted tubules. On CT they appear as hypovascular homogeneous solid tumors ( Fig. 15.7 ). Enhancement is far less prominent than with clear cell RCC. Bilateral and multicentric tumors are more common than with other cell types. As the tumors become large they may develop hemorrhage, necrosis, and calcification. Very rarely tumors may contain macroscopic fat because of the presence of cholesterol-filled macrophages. Cystic papillary RCCs have enhancing nodules or papillary projections that project from the cyst wall ( Fig. 15.8 ). On discovery, 70% of papillary RCCs are confined to the kidney, resulting in a good prognosis with surgical removal.

FIG. 15.7
Papillary renal cell carcinoma.
Postcontrast CT image during corticomedullary phase showing low-grade enhancement within a poorly defined mass arising from the right kidney. During the corticomedullary phase the tumor (T) is difficult to distinguish from unenhanced renal medulla (M) .

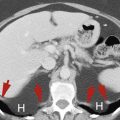
FIG. 15.8
Metastasis to the kidney.
Coronal plane CT image of a patient with colon cancer showing numerous ill-defined low-attenuation lesions in both kidneys (yellow arrows) and in the liver (red arrowheads) .
- •
Chromophobe RCCs account for 5% of RCCs. This tumor arises from collecting duct cells. On ultrasound imaging, small chromophobe RCCs appear homogeneously hyperechoic, mimicking the appearance of small angiomyolipoma (AML). This finding necessitates the performance of CT or MRI to differentiate the two lesions. Characteristically chromophobe RCCs show homogeneous enhancement, even when large. However, a variety of appearances are reported, including central scar, necrosis, and calcifications. A spoke-wheel pattern of enhancement of some tumors mimics oncocytoma. Most tumors (86%) are stage 1 or stage 2 at the time of discovery, resulting in a relatively good prognosis.
- •
Hereditary cancer syndromes account for 5% of RCCs and are associated with early development of multicentric and bilateral RCCs. Von Hippel–Lindau syndrome is associated with clear cell RCC ( Fig. 15.9 ), whereas Birt-Hogg-Dubé syndrome is associated with chromophobe RCC.

FIG. 15.9
Renal cell carcinoma in von Hippel–Lindau syndrome.
CT in a patient with von Hippel–Lindau syndrome reveals the development of two renal cell carcinomas (red arrowheads) in the right kidney. Tumor thrombus (yellow arrow) extends into the right renal vein. Both kidneys contained multiple cysts (green arrow) and angiomyolipomas. The patient had a history of partial nephrectomy on the left for renal cell carcinoma.
- •
Other rare cell types each account for less than 1% of RCCs. Renal medullary carcinoma is associated with sickle cell trait occurring in patients younger than 40 years. The tumor arises in the medulla and is infiltrative and heterogeneous in appearance. Collecting duct RCC is highly aggressive, with an infiltrative growth pattern. Mucinous tubular and spindle cell RCCs are found predominantly in women. Translocation (juvenile) RCCs occur in children and young adults.
- •
On unenhanced CT, RCCs contain noncalcified solid areas measuring 20 to 70 HU. Homogeneous lesions with attenuation outside this range tend to be benign. This finding is of increasing importance as current practice favors the obtaining of increasing numbers of unenhanced abdominal CT scans.
- •
Small solid renal lesions (<3 cm) are being discovered with increased frequency by CT, MRI, or ultrasound imaging. Benign and malignant lesions overlap in appearance, with 15% to 20% of these small lesions being benign. Differential diagnosis includes RCC, oncocytoma, AML without visible fat, papillary adenoma, and metanephric adenoma. Percutaneous biopsy is used to diagnose these lesions before percutaneous ablation procedures or surgery.
CT Staging of Renal Cell Carcinoma
RCC responds poorly to all types of radiation therapy and chemotherapy despite many innovative new therapy attempts. The only completely effective therapy remains surgical excision or percutaneous ablation of all tumor. CT is highly accurate in assisting the urologist in planning surgery or ablation procedures. Nephron-sparing surgery with partial nephrectomy performed laparoscopically or with robotics, or procedures such as radiofrequency ablation or cryoablation, decrease the morbidity of treatment of small tumors. Immunotherapy shows promise in the treatment of advanced disease. (See the internet link to TMN staging of renal carcinoma).
- •
Extension of tumor through the renal capsule into the perinephric fat is not accurately demonstrated by CT. However, this differentiation does not affect the surgical approach to the lesion.
- •
Tumor may grow into the main renal vein (20%–35%) ( Fig. 15.10 ) and inferior vena cava (IVC) (4%–10%) ( Fig. 15.11 ). Venous invasion consists of tumor growing within the vein often associated with variable amount of bland thrombus. Involved veins are usually enlarged. Tumor thrombus is seen as nodular low density within the vein. Enhancement of the thrombus within the vein is evidence that the thrombus consists of growing tumor. Determining the presence or absence of venous involvement is essential to surgical planning ( Fig. 15.10 ). CT is 95% accurate in the determination of venous involvement.

FIG. 15.10
Tumor invasion of the left renal vein.
Coronal plane CT clearly shows tumor (yellow arrows) extending from the left upper pole renal carcinoma (T) into the left renal vein. A segment (white arrow) of the left renal vein near the inferior vena cava (V) is spared, allowing the urologist space to clamp the left renal vein and avoid venous spread of tumor during surgery. A , Aorta.

FIG. 15.11
Tumor invasion of the inferior vena cava.
An infiltrative renal cell carcinoma (T) largely replaces the parenchyma of the right kidney. Tumor thrombus is seen as a filling defect (arrow) in the inferior vena cava.
- •
Filling defects within the collecting system on the pyelographic phase of CT is reliable evidence of tumor invasion of the collecting system.
- •
Regional lymph nodes greater than 2 cm in short axis nearly always contain metastatic tumor. Involved lymph nodes are most common in renal hilum, pericaval, and periaortic regions.
- •
Lymph nodes 1 to 2 cm in short axis are indeterminate, hyperplastic versus metastatic, and should always be removed at surgery to determine prognosis. Lymphadenectomy does not improve prognosis.
- •
Lymph nodes smaller than 1 cm in short axis are usually benign.
- •
Hematogenous metastases are most common in lung, liver, and bone.
- •
Adrenalectomy is optional if the adrenal gland appears normal on CT.
Recurrence of Renal Cell Carcinoma
CT is highly accurate for surveillance of recurrent disease after surgery. Recurrence of RCC usually occurs in the first 6 years after surgery. The median time for appearance of detectable recurrent disease is 15 to 18 months after nephrectomy. The risk of recurrence increases with the stage of the tumor at the time of the initial surgery. Occasionally the tumor will recur after the patient has apparently been disease-free for 10 years or more.
- •
Local recurrence in the renal fossa occurs in 5% of patients ( Fig. 15.12 ). Recurrent tumor appears as an irregularly enhancing mass that commonly involves the psoas or quadratus lumborum muscles. Adjacent structures, including bowel, which usually occupies the renal fossa after nephrectomy, are displaced.

FIG. 15.12
Renal cell carcinoma recurrence.
CT performed 1 year after left-sided nephrectomy for renal cell carcinoma reveals a recurrent mass (red arrowhead) in the left renal bed involving the left adrenal gland (yellow arrow) and the spleen (S) .
- •
Lymphatic recurrence usually occurs in lymph nodes close to the renal vascular pedicle.
- •
Distant metastases develop in 20% to 30% of patients. The most common sites are the lungs (50%–60%), mediastinum, bone, liver, contralateral kidney or adrenal gland, and brain.
- •
Late metastases (>10 years after surgery) are most common to lung, pancreas, bone, skeletal muscle, and bowel. Surgical resection of isolated late metastases may be curative.
Oncocytoma
Oncocytoma is a benign solid tumor that arises from the proximal renal tubule. Most tumors are found in men in their 60s. They account for about 5% of renal neoplasms. Unfortunately, no imaging test can reliably differentiate these benign tumors from RCC. Treatment is surgical. Exploration with limited tumor excision may be attempted if CT findings suggest the possibility of oncocytoma.
- •
The “classic” CT features of oncocytoma, which unfortunately can also be seen with RCC, are homogeneous attenuation after contrast medium administration and a central, sharply marginated, stellate, low-attenuation scar (∼33% of tumors). Most are solitary, well-defined, homogeneous tumors arising in the renal cortex. Features more characteristic of RCC, such as heterogeneous attenuation, necrosis, and hemorrhage, may also be seen with oncocytoma ( Fig. 15.13 ).

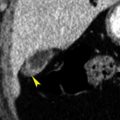
FIG. 15.13
Oncocytoma.
Coronal plane CT during the nephrogram phase shows a small heterogeneous mass (arrow) arising from the upper pole of the right kidney. Although pathology revealed a benign oncocytoma, on CT the mass is indistinguishable from a renal carcinoma.
Angiomyolipoma
Angiomyolipoma (AML) is the most common benign tumor of the kidney. It is composed of blood vessels ( angio ), smooth muscle ( myo ), and fat ( lipoma ). Tumor arteries have thicker than normal, but abnormally weak, vessel walls and are predisposed to aneurysm formation. Larger tumors and larger aneurysms have a higher rate of rupture, making hemorrhage the most common complication. AML occurs in two distinct clinical settings. The sporadic and usually solitary tumor (80%–90%) is most common in middle-aged women (female-to-male ratio 4:1; average age 43 years). Multifocal and bilateral tumors occur in patients with tuberous sclerosis. Many tumors are discovered incidentally during CT, MRI, or ultrasound imaging for other reasons. The presence of distinct pockets of fat allows a specific CT diagnosis of AML.
- •
The proportion of each tissue element present within the tumor determines the imaging appearance.
- •
CT typically shows a well-marginated predominantly fat-containing lesion arising from the cortex ( Fig. 15.14 ). Most tumors are smaller than 5 cm. Vascular and smooth muscle portions of the tumor appear of soft-tissue density on noncontrast CT and enhance with contrast medium administration.

FIG. 15.14
Solitary angiomyolipoma.
Foci of distinct fat density (arrows) define this renal tumor (T) as an angiomyolipoma. Compare the fat density within the lesion with the fat surrounding the kidney. Areas of soft-tissue density, representing smooth muscle and enhanced blood vessels, are also evident within the mass.
- •
The diagnostic feature of AML on CT is the presence of fat (CT density <–10 HU) ( Fig. 15.14 ). Compare low-attenuation areas within the tumor with perirenal and subcutaneous fat. Soft-tissue density elements are often dispersed throughout the background of distinctly fatty tissue. At other times soft-tissue density predominates and diagnosis is made by the presence of small discrete pockets of fat. Thin-section CT (1–3-mm collimation) is recommended for confident diagnosis. Use of intravenous contrast medium is not necessary to confirm the presence of fat within the lesion. Approximately 95% of tumors can be characterized by the presence of fat within the lesion.
- •
Sonography characteristically demonstrates AML as small (<3 cm) well-defined echogenic tumors. Unfortunately, up to 32% of small (<3 cm) RCCs also appear as echogenic masses. Therefore CT characterization of all small echogenic renal mass lesions is recommended.
- •
Hemorrhage is common with AML because of the characteristically weak wall of the tumor blood vessels. Hemorrhage commonly extends into the perirenal space, may obscure fat density within the tumor, and often makes tumor margins indistinct ( Fig. 15.15 ). The risk of hemorrhage is increased when tumors exceed 4 cm in size.

FIG. 15.15
Angiomyolipoma complicated by hemorrhage.
Postcontrast CT reveals an infiltrative renal tumor (T) with hemorrhage (red arrowheads) within the tumor and extending to the perirenal space. Although much of the tumor is obscured by hemorrhage, distinct foci of fat density (yellow arrow) are present to characterize the tumor as an angiomyolipoma.
- •
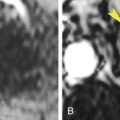
Approximately 5% of AMLs are lipid-poor and show no areas of distinct fat attenuation on CT. Lipid-poor AMLs have attenuation values higher than –10 HU on unenhanced CT. These tumors may be indistinguishable from RCC. Some of these lesions may show a loss of signal intensity on opposed-phase MRI. However, some clear cell RCCs may show similar signal loss on opposed-phase MRI. The presence of fat in RCC has been attributed to osseous metaplasia of stromal portions of the tumor with growth of fatty marrow, or the presence of fat-laden macrophages in chromophobe RCCs. Calcifications are usually present in association within fat deposits arising from bone marrow. Intratumoral calcifications are virtually never present with AML. Fat-containing RCCs often show other signs of malignancy. AML is suggested if the lesions show homogeneous high attenuation on unenhanced CT and show homogeneous increased attenuation on enhanced CT ( Fig. 15.16 ). Biopsy is usually required to differentiate lipid-poor AML from RCC.

FIG. 15.16
Lipid-poor angiomyolipoma.
(A) Noncontrast CT reveals a faintly visualized high-attenuation lesion (arrowhead) within the right kidney. CT attenuation of the lesion was measured at 41 Hounsfield units (HU). (B) Early postcontrast CT shows enhancement of the lesion (arrowhead) to 85 HU. Biopsy was required to confirm benign angiomyolipoma.
- •
In patients with tuberous sclerosis, multiple AMLs are usually found in both kidneys (80% of patients). Up to 50% of patients have multiple renal cysts. AMLs are often large, and the risk of hemorrhage is increased ( Fig. 15.17 ). Approximately 2% to 3% of patients develop RCC at a young age (average 28 years).

FIG. 15.17
Tuberous sclerosis: bilateral angiomyolipomas.
Both kidneys, in this patient with tuberous sclerosis, are extensively replaced by angiomyolipomas. The tumor (T) arising anteriorly from the right kidney extends all the way to the anterior abdominal wall. Low-attenuation areas (yellow arrow) within the tumor are nearly identical in density to subcutaneous and intra-abdominal fat, confirming the diagnosis of angiomyolipoma. Soft-tissue density nodules and strands correspond to smooth muscle components of the tumor. Bright dots (red arrow) represent blood vessels within the highly vascular tumor. Multiple angiomyolipomas (yellow arrowheads) distort the parenchyma of both kidneys. Functioning renal parenchyma enhances brightly with contrast medium. Despite extensive renal involvement by tumor, this patient had normal renal function.
- •
Tumors may grow extensively into the perirenal space. Tumor margins are commonly indistinguishable from perirenal fat. These lesions resemble retroperitoneal liposarcomas. A distinct defect in the kidney from which AMLs arise is a distinguishing feature. AMLs characteristically increase in size when they spread outside the renal capsule. Liposarcomas may displace or compress the kidney but usually do not invade the kidney.
Transitional Cell Carcinoma
Transitional cell carcinoma (TCC) may arise anywhere along the uroepithelium lining the intrarenal collecting system, renal pelvis, ureter, or bladder. Most tumors (90%) arise in the bladder, with only 5% to 10% arising within the upper tracts (intrarenal collecting system, renal pelvis, ureter). A characteristic of TCC is that additional TCC may be present synchronously, or may arise subsequently elsewhere in the uroepithelium. A concurrent bladder cancer has been reported in 17% of cases of upper tract TCC. Most cases present with gross or microscopic hematuria. CT urography has replaced intravenous urography as the imaging method of choice for detection of upper tract urothelial carcinoma as it has a higher diagnostic accuracy (95% vs. 85%). CT is also preferred for tumor staging. For optimal distension of the collecting system and ureter, injection of a diuretic during a CT urogram has been recommended. Several patterns of disease have been described:
- •
On unenhanced CT, TCC is typically of the same attenuation as the renal parenchyma. With contrast medium, TCC shows variable, but usually poor, enhancement.
- •
Single or multiple filling defects in the renal pelvis (35%) have a smooth surface or a stippled papillary pattern ( Fig. 15.18 ) with tracking of contrast medium into the interstices of the tumor. Renal sinus fat may be compressed or invaded by the tumor.

FIG. 15.18
Transitional cell carcinoma: renal pelvis.
Pyelogram phase CT of the left kidney demonstrates a transitional cell carcinoma appearing as a soft-tissue attenuation mass (T) surrounded by high-attenuation contrast agent within the renal pelvis. The tumor extends through the wall of the renal pelvis into the perirenal fat (arrow) . The tumor is papillary in nature with contrast outlining its irregular border.
- •
Filling defects within dilated calyces (26%) may obstruct at the infundibulum. A “phantom” calyx fails to opacify and may be associated with a focal delayed or increasing dense lobar nephrogram.
- •
Thickening of the wall of the renal pelvis ( Fig. 15.19 ) may be relatively subtle.

FIG. 15.19
Transitional cell carcinoma: renal pelvis.
Pyelogram phase CT in a patient with hematuria reveals irregular thickening (arrows) of the walls of the renal pelvis. a , Left renal artery.
- •
Absent or decreased contrast medium excretion (13%) is caused by long-standing obstruction at the ureteropelvic junction.
- •
Diffuse hydronephrosis with renal enlargement (6%) is seen with tumor obstruction at the ureteropelvic junction.
- •
Most ureteral uroepithelial tumors (>70%) occur in the distal part of the ureter. Tumors appear as small filling defects in the contrast-filled ureter or as circumferential thickening of the wall of the ureter on CT urography ( Fig. 15.20 ). The part of the ureter proximal to the tumor may be dilated. Calcified ureteral TCC may be mistaken for calculi. The location of the calcified tumor at a position atypical for impacted calculi may be a clue to diagnosis. Calculi typically impact at the ureteropelvic junction, pelvic brim, or ureterovesical junction.