Lacunar Stroke and Microangiopathy
Brian D. Zipser
Bhavya Rehani
Pamela W. Schaefer
Ischemic cerebrovascular disease affecting the small vessels, microangiopathy, includes lacunar infarctions and white matter ischemic changes (leukoaraiosis) (Table 46.1). Perfusion imaging is often used in the evaluation of acute stroke to increase the conspicuity and detection of ischemic lesions and to identify infarct core if diffusion-weighted imaging (DWI) is not available. Perfusion imaging is also used to identify tissue at risk of infarction if reperfusion is not achieved. Because many lacunar infarctions present with acute neurologic events, they are frequently assessed with perfusion imaging. Leukoaraiosis is typically not routinely imaged using perfusion sequences, although perfusion imaging can be of use in the evaluation for vascular etiologies of dementia. For both lacunar infarctions and leukoaraiosis, perfusion imaging provides insight into the underlying pathophysiology and clinical sequela.
Lacunar infarctions are small infarctions in the distribution of single perforating arteries that range in caliber from 100 to 400 μm. These infarctions are typically less than 15 mm in diameter and involve, in descending frequency, the deep gray nuclei (putamen, caudate and thalamus), pons, internal capsule, and cerebral white matter.1,2,3 Perforating arteries supply discrete vascular territories and include perforating branches from the internal cerebral artery, anterior choroidal artery, anterior communicating artery, anterior cerebral artery (proximal A1 branches and the recurrent artery of Heubner), middle cerebral artery (medial and lateral lenticulostriate arteries), posterior communicating artery, posterior cerebral artery (P1 segment thalamoperforating arteries and P2 segment thalamogeniculate arteries), and posterior choroidal artery.4 For more details on intracerebral vascular anatomy, the reader is referred to Chapter 40.
The prevalence of asymptomatic lacunar infarctions in community cohorts of patients at least 60 years old is approximately 8% to 20%5,6,7,8 and increases with age. The vast majority of lacunar infarctions (up to 89.3%) are asymptomatic.8 These silent lacunar infarctions are associated with hypertension and carotid artery stenosis,7,9 with a greater incidence of silent infarctions occurring in women.7,8
The majority of symptomatic lacunar infarctions present with acute onset of neurologic deficits. Over 70 lacunar syndromes have been described.10 There are five classical clinical syndromes: (a) pure motor hemiparesis (most often in the posterior limb of the internal capsule, but also in the corona radiata, mesencephalon, pons, or medullary pyramid), (b) pure sensory stroke (lateral nucleus of the thalamus, thalamocortical projections or brainstem sensory pathways), (c) sensorimotor stroke (straddling the lateral thalamus and posterior limb of the internal capsule, or in the putamen, thalamus, or posterior limb of the internal capsule), (d) ataxic hemiparesis (50% due to lacunar infarction; lesion in the cortico–ponto–cerebellar, dentate rubro–thalamo–cortical, or somesthetic proprioceptive pathways in the basis pontis or posterior limb of the internal capsule, corona radiata, thalamus, lenticular nucleus, cerebellum, or frontal cortex), and (e) dysarthria clumsy hand syndrome (basis pontis, anterior limb of the internal capsule, corona radiata).2,11,12 Chronic cognitive impairment and nonacute extremity dysfunction have also been attributed to lacunar infarctions.8
Lacunar infarctions are often associated with severe white matter hyperintensities, particularly in the periventricular and deep white matter.5 Demographic factors associated with lacunar infarctions include hypertension, age, diabetes, and elevated hematocrit. Although the short-term prognosis of lacunar infarctions is favorable, there is an increased risk of death, stroke recurrence, and dementia.
TABLE 46.1 CEREBRAL MICROANGIOPATHY | ||||||||||||||||||
|---|---|---|---|---|---|---|---|---|---|---|---|---|---|---|---|---|---|---|
| ||||||||||||||||||
Leukoaraiosis refers to the imaging finding of white matter rarefaction with hypodensity on computed tomography (CT) and hyperintensity on fluid-attenuated inversion recovery (FLAIR) T2-weighted magnetic resonance imaging (MRI) sequences, most often attributed to microangiopathic changes. The underlying microvascular changes have been attributed to various diseases, including hypertension, diabetes, cerebral amyloid angiopathy, and cerebral autosomal dominant arteriopathy with sub-cortical infarcts and leukoencephalopathy.13 Leukoaraiosis is most often associated with age, although hypertension and diabetes are strong risk factors. Periventricular leukoaraiosis has been associated with reduced respiratory function, cerebral atrophy, and history of cardiac disease14,15 as well as an increased risk of stroke, dementia, and death.16 Subcortical white matter leukoaraiosis is most strongly associated with hypertension and glycated hemoglobin level (which reflects glucose homeostasis over 3 months) in diabetic patients and hypertension and respiratory function in nondiabetic patients.15
Leukoaraiosis progresses in 17.9% to 92.2% of patients. Progressively worsening white matter hyperintensities have been associated with cognitive decline and dysexecutive syndrome17,18 and can be greater in subcortical versus periventricular white matter and frontal versus occipital lobe white matter.18 Regular treatment of hypertension may prevent progression.19
Pathophysiology
The majority of lacunar infarctions are attributed to intrinsic small vessel disease, which includes (a) microatheroma, affecting larger perforating arteries (200 to 400 μm); (b) lipohyalinosis, affecting smaller perforating arteries (<200 μm); and (c) fibrinoid necrosis, affecting capillaries and arterioles.12 Intrinsic diseases of the small vessels can produce lacunar infarction from decreased cerebral blood flow (CBF) and decreased autoregulation.12,20 Endothelial disruption with blood–brain barrier dysfunction and prothrombotic states can also play a role in the pathogenesis of lacunar infarctions.21,22
A suspected small artery disease etiology is usually based on infarct size, clinical syndromes, and exclusion of an identifiable potential mechanism such as larger vessel thromboembolism or vasospasm. A thromboembolic mechanism may account for approximately 10% to 15% of lacunar infarctions20,23; these infarctions can be larger than other lacunar infarctions due to occlusion of proximal, primary perforating branches or several smaller branches.20,24 Patients with suspected thromboembolism have a higher prevalence of coronary artery disease, previous transient ischemic attacks, asymptomatic carotid stenoses, and atrial fibrillation as well as a lower prevalence of hypertension and diabetes compared with patients who have lacunar infarction due to intrinsic small vessel disease.25,26 Patients with a thromboembolic etiology may benefit from administration of thrombolytic agents.27
Leukoaraiosis, similar to lacunar infarctions, predominantly affects anatomic regions supplied by terminal vessels. The periventricular white matter is supplied by either terminal branches of the pial vessels or branch vessels from subependymal arterial vessels.28 Short vessels between the white matter and the adjacent cortex supply the immediate subcortical white matter.
Histopathologic changes in leukoaraiosis include demyelination, glial cell loss, axonal damage, spongiotic and microvascular changes of thickened sclerotic vessel walls, decreased lumen size, and decreased microvascular density.1,29,30 Generalized decreased capillary density in normal-appearing brain parenchyma in patients with leukoaraiosis implies a widespread alteration in microvascular function.30
Leukoaraiosis can in part result directly from microvascular structural abnormalities resulting in vascular leakage.31 Pathologic changes in arterioles, leading to reduced cerebrovascular reactivity, can predispose tissue at the terminal zones of perfusion to ischemia during normal variations in blood pressure.28 Ischemia-induced microvascular and blood–brain barrier damage can lead to vascular leakage with associated reactive gliosis and demyelination. Support for these theories includes immunohistochemical evidence of blood–brain barrier disruption in white matter in Binswanger disease32 and contrast-enhanced MRI studies correlating altered blood–brain barrier permeability with the degree of leukoaraiosis.31,33 Prothrombotic changes from chronic endothelial dysfunction can also contribute to the pathogenesis of leukoaraiosis.21
Diagnostic Evaluation Strategies and Recommendations
Protocol Recommendations
Patients presenting to the authors’ emergency room with acute neurologic symptoms from lacunar infarction are imaged following the same algorithm for large vascular territory infarctions. A noncontrast CT is performed to evaluate for intracranial hemorrhage and hypoattenuation in greater than one-third of the middle cerebral artery territory, factors that preclude the administration of intravenous tissue plasminogen activator. Subsequently, a CT angiogram (CTA) of the head and neck vessels is performed to identify arterial occlusions as well as possible etiologic factors such as atheromatous disease with severe internal carotid and other artery stenoses, dissection, vasculitis, vasospasm, moyamoya disease, and other vascular abnormalities.
Following CTA, the majority of patients undergo an MRI with DWI, FLAIR, and MR perfusion (MRP). MRP is performed using a dynamic susceptibility contrast
gradient-recalled echo (GRE) – echo planar imaging (EPI) technique, in which serial echoplanar gradient-echo images are acquired at 1.5 tesla with repetition time/echo time 1,500/40 ms, flip angle 60, field of view 22 cm, matrix 128 × 128, and 5-mm slice thickness with a 1-mm gap. Fourteen to 15 slices are acquired every 1.5 seconds for a total of 80 images per slice. Twenty milliliters of gadopentetate dimeglumine 0.5 mmol/mL (Magnevist, Bayer) is injected via a peripheral intravenous catheter at 5 mL/s, beginning 10 seconds after initiation of scanning, followed by 20 mL normal saline at the same flow rate.
gradient-recalled echo (GRE) – echo planar imaging (EPI) technique, in which serial echoplanar gradient-echo images are acquired at 1.5 tesla with repetition time/echo time 1,500/40 ms, flip angle 60, field of view 22 cm, matrix 128 × 128, and 5-mm slice thickness with a 1-mm gap. Fourteen to 15 slices are acquired every 1.5 seconds for a total of 80 images per slice. Twenty milliliters of gadopentetate dimeglumine 0.5 mmol/mL (Magnevist, Bayer) is injected via a peripheral intravenous catheter at 5 mL/s, beginning 10 seconds after initiation of scanning, followed by 20 mL normal saline at the same flow rate.
Perfusion-weighted imaging data are processed using locally written, fully automated software. Signal-versus-time curves for each pixel from the GRE-EPI images are converted to delta-R2*-versus-time curves, and cerebral blood volume (CBV) is calculated by integrating the area under these curves. CBF is calculated as the amplitude of the scaled residue function yielded by delay-insensitive block-circulant singular value deconvolution with oscillation index regularization with automated selection of an arterial input function. Maximum time (Tmax) is calculated as the time at which the scaled residue function reaches its maximum, and mean transit time (MTT) is calculated by dividing CBV by CBF.
If a patient is unable to undergo an MRI, CT perfusion is performed to increase the sensitivity for detecting an ischemic lesion and to approximate the infarct core and ischemic penumbra. At the authors’ institution, CT perfusion is acquired using shuttle perfusion mode during administration of 45 mL of nonionic contrast at a rate of 5 mL/s followed by 40 mL of saline at a rate of 4 mL/s (time of acquisition 91.4 seconds, 80 kV, 375 mA, rotation time 0.5 seconds), providing 16 slices with 5-mm thickness (8-cm coverage). Postprocessing is performed with automated CT perfusion analysis software provided by the authors’ CT vendor. An arterial input region of interest is selected from the anterior cerebral artery. The venous input region of interest is selected from the superior sagittal sinus. CBV, CBF, and MTT maps are produced. The CT dose index volume is 349 mGy, dose length product, <2790 mGy*cm. The 0.5 Gy value referred to the peak skin dose, not a CTDI measurement, and the FDA recommends that each facility set its own alert, reviewed by a physicist, radiologist and qualit assurance committee.
Perfusion Findings: Lacunar Infarctions
Perfusion imaging of lacunar infarctions is most frequently used in the emergent evaluation for suspected stroke in patients presenting to an emergency room with an acute neurologic deficit. In this setting, perfusion imaging may aid in the diagnosis of lacunar infarctions and suggest the possible etiology. In the outpatient setting, perfusion imaging may have diagnostic value in the workup of dementia to determine vascular etiologies that may relate to lacunar infarctions or leukoaraiosis (Table 46.2).
TABLE 46.2 HALLMARKS, IMAGING SIGNS AND KEY OBSERVATIONS: UTILITY of PERFUSION IMAGING IN LACUNAR INFARCTIONS | ||
|---|---|---|
|
On imaging, lacunar infarctions are classically defined as infarctions less than 15 mm in diameter located in the deep gray nuclei, deep white matter, or brainstem. Although the presence of a specific syndrome can suggest the diagnosis of lacunar infarction, overall, clinical lacunar syndromes have poor positive predictive values for lacunar infarctions34,35,36,37 because similar syndromes can be produced by small cortical infarctions.35 Noncontrast CT (NCCT) is insensitive for identifying acute lacunar infarctions.34,38,39 The combined use of clinical symptoms and CT for diagnosis of a lacunar infarction may have a sensitivity of only 53%38 and a positive predictive value of 67%.40
In the evaluation of acute neurologic abnormalities, following NCCT, CTA is obtained to assess for vascular occlusion. The absence of both proximal arterial occlusion and regional hypoenhancement on CTA source images suggests a lacunar infarction from intrinsic small vessel disease. In addition, CTA source images may increase the sensitivity for detecting lacunes compared with NCCT alone.
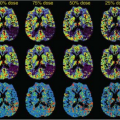
Following NCCT and CTA at the authors’ institution, patients typically undergo MRI. DWI is highly reliable for the detection of lacunar infarctions with mean sensitivities ranging from 82% to 100% and specificities close to 100%.39,41 Nevertheless, perfusion imaging can provide additional information. If DWI is not available, CT perfusion may increase the sensitivity of detecting lacunes (with low CBF and prolonged MTT) compared with NCCT and CTA source images (Fig. 46.1). In patients with normal DWI images, MRP imaging (prolonged MTT) may occasionally identify small ischemic brainstem and deep gray nuclei lesions. Furthermore, lacunar infarctions with perfusion abnormalities (prolonged MTT) that are larger than the DWI lesions may have increased infarct size on follow-up imaging, suggesting a possible embolic etiology rather than intrinsic small vessel pathology.37 Case reports
identifying reversible perfusion abnormalities42 and neurologic improvement27 following thrombolysis also support an embolic mechanism for some lacunar infarctions. In addition, lacunar infarctions with abnormal perfusion on MR and CT (prolonged MTT on MRP; prolonged MTT and lower CBF on CT perfusion) have been associated with early clinical deterioration with persistence of symptoms beyond 24 hours.43,44
identifying reversible perfusion abnormalities42 and neurologic improvement27 following thrombolysis also support an embolic mechanism for some lacunar infarctions. In addition, lacunar infarctions with abnormal perfusion on MR and CT (prolonged MTT on MRP; prolonged MTT and lower CBF on CT perfusion) have been associated with early clinical deterioration with persistence of symptoms beyond 24 hours.43,44
Generalized cerebral perfusion abnormalities have also been associated with lacunar infarctions. Cerebrovascular reactivity reflects the vasodilatory capacity of vessels in response to changes in perfusion pressure, which may be measured following administration of carbon dioxide or acetazolamide. The majority of transcranial Doppler, single-photon emission CT (SPECT) and blood oxygenation level–dependent contrast functional MRI studies in patients with lacunar infarctions demonstrate generalized impaired cerebrovascular reactivity following acetazolamide challenge, supporting a diffuse small vessel arteriolosclerotic pathology.45,46,47,48,49 Furthermore, the reduction in cortical blood flow and cerebrovascular reactivity is greater with increased numbers of lacunar infarctions and a higher rate of diabetes.45,47
Lacunar infarctions may also be associated with hypoperfusion diaschisis or perfusion abnormalities remote from the ischemic insult (Table 46.3). For example, striatocapsular infarctions have been associated with decreased CBF on SPECT in the ipsilateral frontoparietal region.50,51 These phenomena are likely due to hypometabolism from interruption of basal ganglia–cortical neuronal pathways.50 Pontine infarctions have been associated with decreased regional CBF in either the ipsilateral or contralateral cerebellum and decreased regional CBF in the ipsilateral frontal and temporal lobes and thalamus due to interruption of the cerebello–thalamo–cortical pathways passing through the pons.52,53 Interruption of the cerebello–thalamo–cortical pathways can also account for crossed cerebellar diaschisis in thalamic infarctions.54 Acute left anterior thalamic infarctions have corresponding persistent reduced regional CBF and oxygen metabolism in the ipsilateral frontal cortex as well as the supramarginal gyrus and superior temporal gyrus.55,56,57 This phenomenon is likely due to interruption of thalamocortical circuits.55,57,58 Furthermore, these remote perfusion abnormalities observed with thalamic infarctions have been associated with acute anterograde amnesia, executive dysfunction, and dysphasia among other features of dementia.58 Although most studies on altered cortical perfusion have used positron emission tomography (PET) or SPECT, dynamic susceptibility contrast-enhanced MRI has demonstrated similar findings.59 In the acute stage, perfusion abnormalities must be interpreted with other imaging findings in order to differentiate hypoperfusion due to acute ischemia from hypoperfusion due to fiber tract interruption.
Stay updated, free articles. Join our Telegram channel

Full access? Get Clinical Tree


