- •
Cardiovascular magnetic resonance (CMR) is the most accurate and comprehensive method available for assessment of left ventricular structure and function. It provides high spatial and temporal resolution and volumetric quantitation throughout the cardiac cycle without any geometric assumptions.
- •
CMR is a powerful method for serial follow-up of ventricular remodeling of any cause. High test-retest reproducibility permits accurate detection of changes in left ventricular volumes, mass, and ejection fraction.
- •
CMR achieves statistical power in research protocols and clinical trials, while reducing sample sizes required compared with other imaging methods.
- •
Normal CMR values for left ventricular volumes, mass, and ejection fraction have been defined and can be adjusted for age and gender. Variations in methods may require development of laboratory-specific normal values.
- •
Using CMR LV mass and mass/volume ratio, left ventricular remodeling in hypertensive heart disease can be classified as concentric left ventricular hypertrophy, concentric remodeling without hypertrophy, or eccentric hypertrophy. Regression of hypertrophy with treatment, which reduces cardiovascular risk, is readily documented with CMR.
- •
CMR can depict complex patterns of interrelated changes in left ventricular volumes, systolic function, and mass that may be seen with treatment in hypertension, valvular regurgitation, and ischemic and idiopathic dilated cardiomyopathies.
- •
CMR is highly effective in quantitation of the left ventricular response to volume overload and resultant changes in left ventricular volumes and ejection fraction. Regurgitant volume and fraction are easily determined.
- •
CMR is a preferred method for assessment of left ventricular size and global and segmental myocardial function in ischemic heart disease. Combined with CMR viability imaging, it is a powerful tool for clinical decision making.
- •
CMR can detect patients regarded as having nonischemic cardiomyopathy who in fact have ischemic cardiomyopathy.
Accurate and reproducible quantitative assessment of left ventricular (LV) structure and function is an essential prerequisite in the diagnosis and management of almost all forms of adult cardiovascular disease. CMR is an extremely powerful noninvasive imaging modality that provides comprehensive anatomic and physiologic assessment of the left ventricle, including chamber volume, ejection fraction, myocardial mass, and shape. It offers three-dimensional (3D) visualization of the left ventricle through the cardiac cycle with high spatial and temporal resolution without use of ionizing radiation or contrast agents. CMR is especially useful in patients deemed technically difficult for echocardiography but is also more reliable than two-dimensional (2D) echocardiography when LV size and function are abnormal, particularly in ischemic heart disease. In addition, CMR permits assessment of regional structure and function parameters in correct spatial registration with powerful imaging methods for tissue characterization, such as delayed enhancement imaging of myocardial infarction.
CMR determinations of ejection fraction (EF), end-diastolic and end-systolic volumes (EDV, ESV), and left ventricular mass (LVM) have shown high levels of agreement with existing alternative invasive and noninvasive reference methods, including biplane invasive ventriculography, thermodilution and Fick stroke volumes, cardiac CT, and 3D echocardiography. These measurements also have shown excellent intraobserver, interobserver, and test-retest reproducibility. CMR reproducibility is superior to that of 2D echocardiography ( Table 3-1 ).
| VARIABLE | 2D ECHO SD | CMR SD |
|---|---|---|
| LVEDV (ml) | 24 | 7.4 |
| LVESV (ml) | 16 | 6.5 |
| LVEF (%) | 6.6 | 2.5 |
| LVM (g) | 36 | 6.4 |
Because the confidence limits of an image-based measurement are a function of the variability of the measurement, including the sum of intraobserver or interobserver variability and imaging variability (expressed as standard deviation), this enables CMR to reliably detect abnormalities and changes in ventricular structure and function that conventional 2D echocardiography cannot ( Table 3-2 ). The smallest changes in left ventricular structure and function detectable in an individual patient are two times the test-test standard deviation in either direction. The smallest changes reliably detected by echocardiography are, in fact, rather large, perhaps larger than those likely to be seen in most patients with chronic cardiac disease.
| VARIABLE | 2D ECHO SD | CMR SD |
|---|---|---|
| LVEDV (ml) | 48 | 14.8 |
| LVESV (ml) | 32 | 13 |
| LVEF (%) | 13.2 | 5 |
| LVM (g) | 72 | 12.8 |
METHODS AND NORMAL VALUES
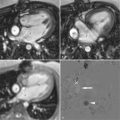
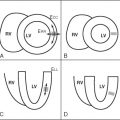
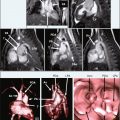
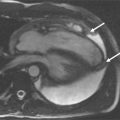
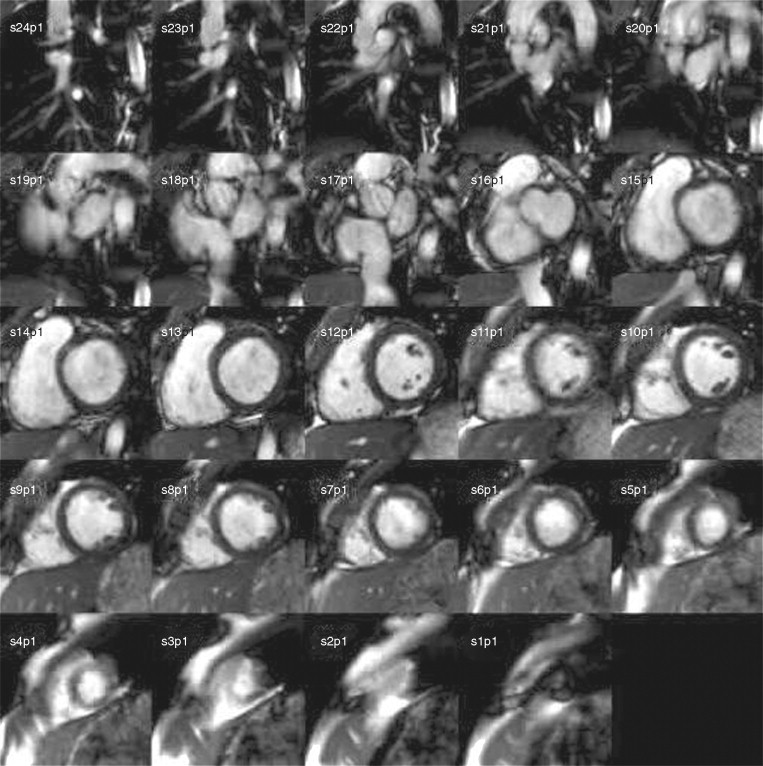
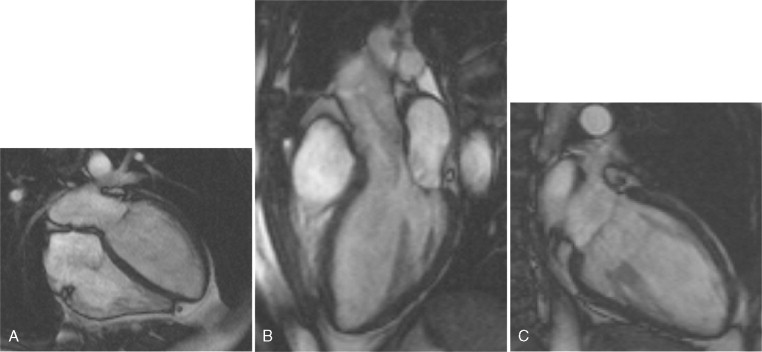
CMR LV evaluation is typically performed using ECG-gated segmented breath-held cine imaging with a steady-state free procession (SSFP) sequence. A study is initiated by obtaining scout images in the axial, sagittal, and coronal planes. An iterative process is then used to define and confirm the LV long and short-axis planes as follows. The axial scouts are used to prescribe a scout two-chamber single-phase image. By imaging orthogonal to the two-chamber scout, an LV four chamber scout image is obtained. Prescription of a stack of short-axis scout images perpendicular to the long-axis on the four-chamber plane is then performed. A four-chamber cine image loop showing the left ventricular septal and lateral walls is then prescribed from the short-axis scout stack. Rotation of the imaging plane counterclockwise relative to the short-axis plane provides both a long-axis three-chamber plane extending from the aortic root to the LV apex showing the LV anteroseptal and posterolateral walls and a two-chamber cine showing the LV anterior and inferior walls. The four-chamber cine plane is then used to prescribe the stack of adjacent short-axis cine loops from the LV apex through the aortic and mitral valve planes. Although in normally shaped ventricles with uniform regional function, biplane long-axis analyses assuming rotational uniformity of the LV may provide clinically useful results, most laboratories use full analysis of the LV short-axis stack for quantitative assessments because they are independent of any geometric assumptions and integrate much more 3D data, and hence are more reproducible ( Figs. 3-1 and 3-2 ).
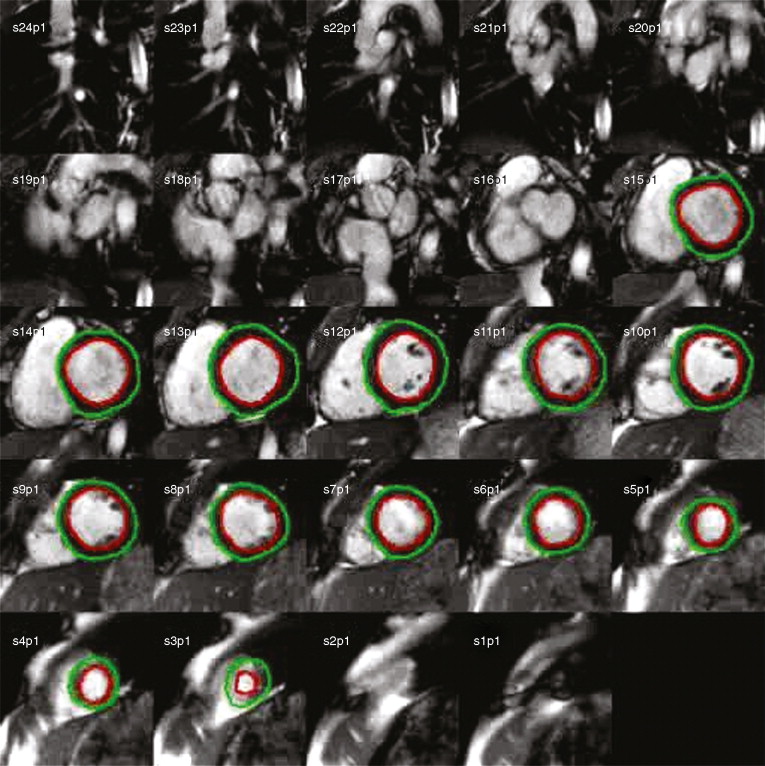
By adding the LV cavity areas on all the slices at end-diastole and multiplying by the slice thickness, EDV is obtained by the analytic software. End-systolic volume is determined in a similar manner and EF calculated. A summation of all end-diastolic LV myocardial areas, multiplied by slice thickness and the specific gravity of the myocardium (1.055) provides LV mass.
CMR LV imaging and analysis is not entirely standardized at present, so local laboratory normal values are extremely valuable. Among variations in methods that can differ among CMR laboratories and may affect normal values and results in abnormal hearts are temporal and spatial resolution of CMR images, use of retrospective versus prospective gating, inclusion of papillary muscles and trabeculae in the LV cavity or myocardial mass, method of determining end-systole, analytic software package used, and intra observer and interobserver variability.
Our laboratory developed a reference set of normal LV values in an extensively screened normal cohort of over 200 normotensive, nondiabetic, nonobese (body mass index [BMI] < 28) volunteers without history of cardiovascular disease or symptoms thereof, additionally screened with 2D echocardiography ( Table 3-3 ). We used maximal available temporal and spatial resolution in each subject, which are functions of heart rate and body size. CMR was performed using prospectively gated SSFP cine imaging with contiguous 8-mm slices in the LV short-axis plane. LV end-diastolic and end-systolic volumes, ejection fraction, and mass were determined using MASS software (Medis, New York, NY), including papillary muscles and trabeculae in LV cavity and defining end-systole as the time of aortic valve closure. Results were indexed (i) to body surface area.
| VARIABLE | MALE | FEMALE |
|---|---|---|
| LVEDVi (ml/m 2 ) | 74 ± 14 | 67 ± 11 |
| LVESVi (ml/m 2 ) | 32 ± 8 | 26 ± 7 |
| LVEF (%) | 57 ± 6 | 61 ± 6 |
| LVMi (g/m 2 ) | 67 ± 11 | 54 ± 9 |
| LVM/EDV (g/ml) | 0.9 ± 0.2 | 0.8 ± 0.2 |
Note that women have higher EF and lower EDVi, ESVi, and LVMi compared with men, despite correction for body size. This finding also has been described in several large population studies. In addition, even within the normal range, systolic blood pressures are somewhat higher in men than women, which accounts for the higher LV mass/volume ratio in men than women. We and others have also noted that chamber volumes diminish with age, but development of age-specific laboratory normal values is hampered by the very large sample sizes required to cover the age range needed. Steady-state free procession cine left ventricular volume indices are higher and mass lower than those obtained using echocardiography or using older CMR gradient echo cine methods. The different results between gradient echo and SSFP CMR are likely caused by higher contrast between blood pool and myocardium found with SSFP and resultant differences in partial volume effects at the endocardium.
Figures 3-3 and 3-4 were taken in a normotensive, nonobese, nondiabetic, healthy 48-year-old female volunteer without any history of cardiovascular disease or symptoms thereof. Quantitative results: BP 118/70 mm Hg; BSA 1.42 m 2 ; EDV 109 ml; EDVi 77 ml/m 2 ; ESV 38 ml; ESVi 27 ml/m 2 ; LVM 78 g; LVMi 55 g/m 2 ; LVEF 65%.

Stay updated, free articles. Join our Telegram channel

Full access? Get Clinical Tree


