(1)
Department of Medical Imaging, Linkou Chang Gung Memorial Hospital, Taoyuan, Taiwan
(2)
Department of Medical Imaging and Radiological Sciences, Institute of Radiological Research Chang Gung University, Taoyuan, Taiwan
5.1 Renal Calyceal Calculi
Case 1
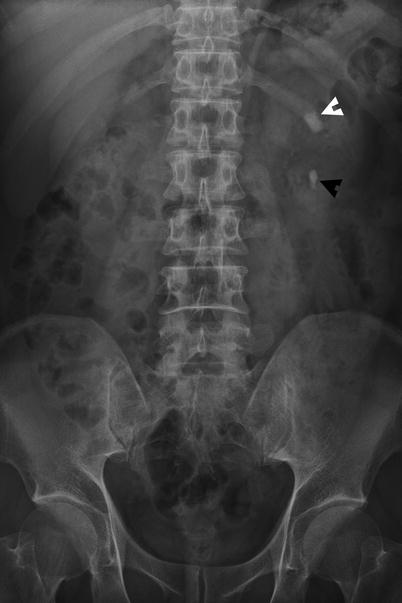
Fig. 5.1
Plain radiograph of the kidney, ureter, and bladder (KUB) shows two left renal calculi. Figure 5.1, KUB shows one radiopaque foci (white arrowhead) at the left renal upper pole, consistent with left renal upper calyceal calculus. Another smaller radiopaque lesion (black arrowhead) at the left renal lower pole is shown as left renal lower calyceal calculus.
Case 2
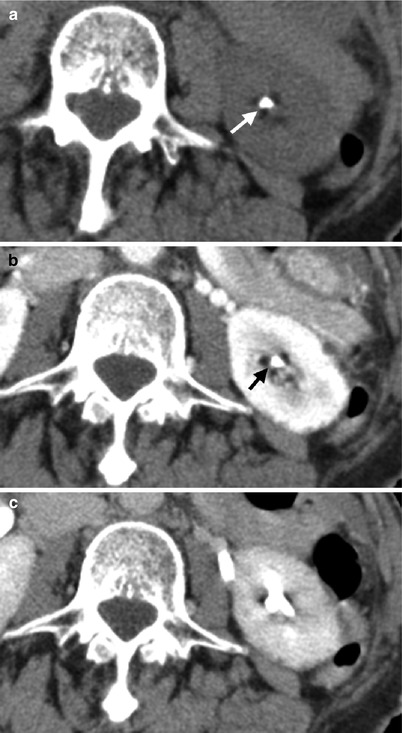
Fig. 5.2
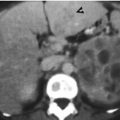
Computed tomography (CT) shows imaging findings of a left renal calyceal calculus. Figure 5.2a, unenhanced CT image shows a calyceal calculus (arrow) showing high density. Figure 5.2b, enhanced CT image at corticomedullary phase shows visualization of this calyceal calculus (arrow) which is less conspicuous than that on Fig. 5.2a, c, enhanced CT image at excretory phase shows opacification on the left renal calyces by contrast medium with resultant obscuration of the calyceal calculus.
Case 3
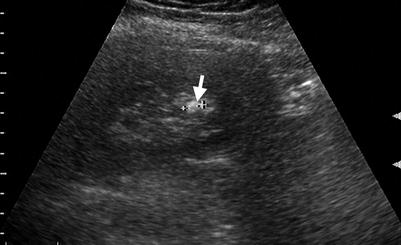
Fig. 5.3
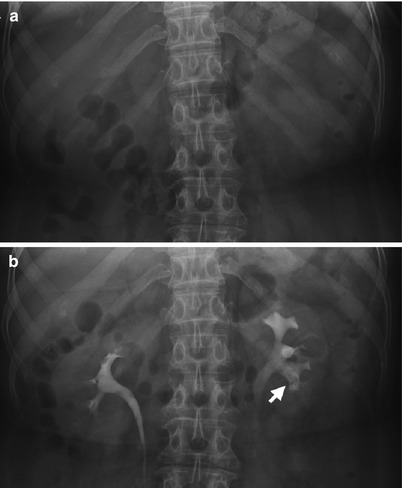
Fig. 5.4

Fig. 5.5
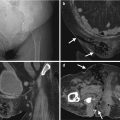
Renal ultrasound (US), excretory urography (EU), and computed tomography show imaging findings of a radiolucent renal calyceal calculus. Figure 5.3, renal US shows a hyperechoic foci (arrow) with some acoustic shadowing at renal calyx, consistent with renal calyceal calculus. Figure 5.4a, magnification view of the kidneys of EU before contrast medium administration shows no visible radiopaque calculus of both kidneys. Figure 5.4b, EU magnification view of the kidneys at 10 min after contrast medium administration shows a filling defect (arrow) at the left renal lower calyx. Figure 5.5a, unenhanced CT image of the left kidney shows a left renal calyceal calculus (arrow) showing high density. Figure 5.5b, enhanced axial CT image of the left kidney of excretory phase shows contrast opacification of the left renal calyces. The left calyceal calculus is not detectable on this image.
Key Diagnostic Features
Urinary tract calculus could be categorized by their anatomical locations such as the kidney, ureter, urinary bladder, and urethral calculus. Renal calyceal calculus shows high echogenic foci in renal calyx with acoustic shadowing on renal ultrasound. On plain radiographs of the kidney, ureter, and bladder (KUB), urinary tract calculus could be visualized as radiopaque calculus. On the other hand, urinary tract calculus not visible on KUB is called radiolucent calculus [1]. On excretory urography, radiolucent renal calyceal calculus could sometimes appear as a filling defect by its lower density than that of excreted contrast medium. On unenhanced computed tomography (CT), nearly all urinary tract calculi appear as high density foci regardless of its radiolucent or radiopaque appearances on KUB [1]. Nonetheless, when there is contrast opacification on the renal calyces, the detection of renal calyceal calculus becomes much more difficult. The use of a wide window setting could sometimes help in differentiating calculus from opacified contrast medium. However, if the density of the excretory contrast medium is identical to that of urinary calculus, they could not be distinguished from each other even in high window setting. Therefore, in detecting urinary tract calculus, such as renal calculus, unenhanced CT is most useful for its diagnosis.
5.2 Ureteropelvic Junction Calculi
Case 4
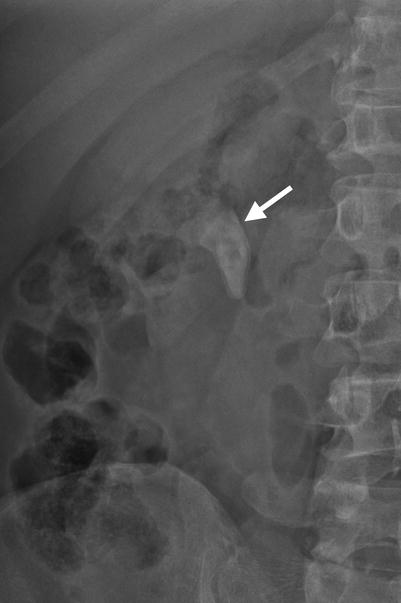
Fig. 5.6
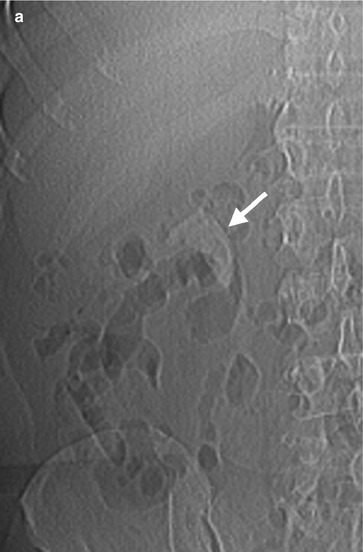
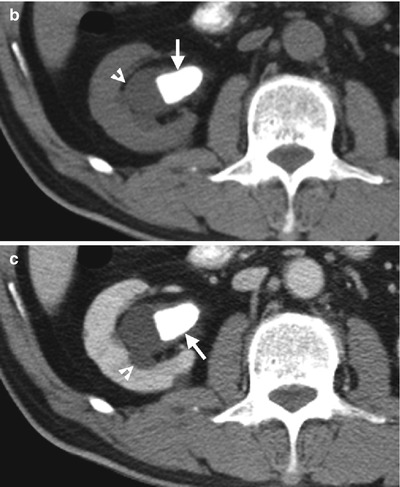
Fig. 5.7
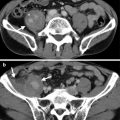
Plain radiograph of the kidney, ureter, and bladder (KUB) and computed tomography (CT) show a ureteropelvic junction (UPJ) calculus. Figure 5.6, magnification view of the right kidney shows a radiopaque calculus (arrow) at the right renal pelvis and UPJ. Figure 5.7a, magnification view of the CT scout image of the right kidney shows visualization of the calculus (arrow). Figure 5.7b, axial unenhanced CT image of the right kidney shows a calculus (arrow) showing high density at the right renal pelvis extending to the right UPJ with resultant right hydronephrosis (arrowhead). Figure 5.7c, axial enhanced CT image of the right kidney shows similar high density of the calculus (arrow) associated with right hydronephrosis (arrowhead).
Case 5
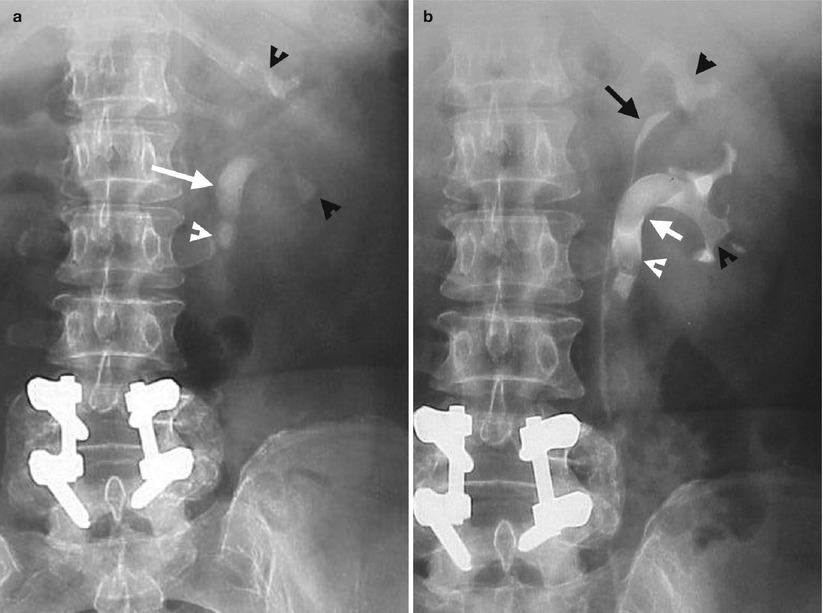
Fig. 5.8
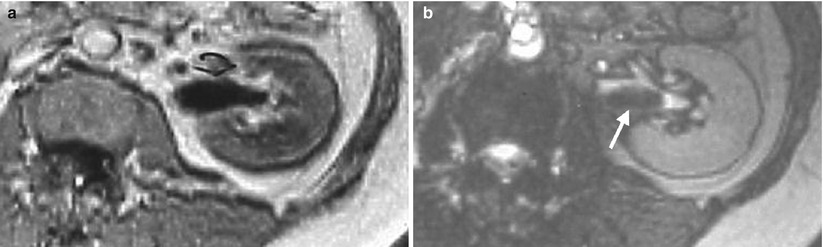
Fig. 5.9
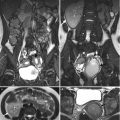
Excretory urography (EU) and magnetic resonance imaging (MRI) show urinary calculi at the left renal pelvis, ureteropelvic junction (UPJ), proximal ureter, and calyces. Figure 5.8a, magnification view of the EU of the left kidney before contrast medium administration shows a radiopaque calculus at the left renal pelvis and UPJ (white arrow). There are left proximal ureteral calculus (white arrowhead) and two renal calyceal calculi (black arrowhead) as well. Figure 5.8b, magnification view of the EU of the left kidney at 10 min after contrast medium administration shows filling defects at the left renal pelvis and UPJ (white arrow) as well as left renal calyces (black arrowheads) and left proximal ureter (white arrowhead) due to calculi. Note there is duplex left kidney (black arrow). Figure 5.9a, axial T1-weighted image (T1WI) of MRI shows homogeneous low signal intensity of the left renal pelvis which does not allow depiction of the calculus. Figure 5.9b, axial T2-weighted image (T2WI) of MRI shows low signal intensity lesion (arrow) in the left renal pelvis and left UPJ, consistent with a calculus.
Case 6
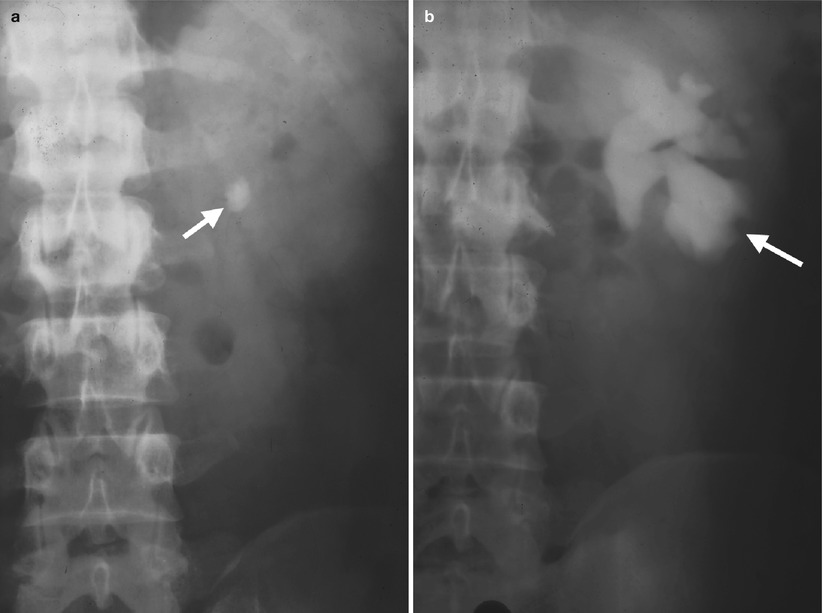
Fig. 5.10
Excretory urography (EU) shows a left ureteropelvic junction (UPJ) stone with resultant left hydronephrosis. Figure 5.10a, magnification view of the EU of the left kidney before contrast medium administration shows a left UPJ stone (arrow) of an oval shape and radiopaque density. Figure 5.10b, magnification view of the EU of the left kidney at 10 min after contrast medium administration shows left hydronephrosis (arrow) due to complete obstruction by the left UPJ stone. The left ureter distal to the UPJ stone is not opacified at all. The UPJ stone itself is not visualized on this image due to insufficient density differences between the stone and contrast-opacified renal collecting system.
Key Diagnostic Features
Urinary calculus at the ureteropelvic junction (UPJ) could be a renal pelvis calculus extending to the UPJ or a discrete calculus at the UPJ area. Because the UPJ is an anatomical narrowed point, a UPJ calculus may be associated with variable degrees of urinary tract obstruction and thus resultant proximal hydronephrosis. Similar to urinary tract calculus of other locations, UPJ calculus is detectable on plain radiograph of the kidney, ureter, and bladder (KUB) if it is dense enough as the so-called “radiopaque” calculus. On excretory urography (EU), a UPJ calculus could be visualized as a radiopaque calculus before contrast medium administration or as a filling defect in UPJ after contrast medium excretion. However, in the absence of adequate opacification of the corresponding renal pelvis and UPJ, EU could fail to illustrate radiolucent UPJ calculus. Computed tomography (CT) could not only demonstrate the UPJ calculus itself but also the presence or absence of hydronephrosis regardless of excretory function of the corresponding kidney. Although magnetic resonance imaging (MRI) is much more expensive than CT, MRI has lower sensitivity than unenhanced CT for detecting urinary calculus. On MRI, urinary calculus usually appears as low signal intensity on both T1-weighted image (T1WI) and T2-weighted image (T2WI). Therefore, a UPJ calculus could be unrecognizable on T1WI because urine in the UPJ and renal pelvis shows identical low signal intensity as that of a calculus, which does not allow their differentiation. In contrast, urine in the UPJ and renal pelvis upon T2WI shows high signal intensity which highlights the presence of a low signal intensity lesion by a calculus. Nonetheless, the presence of low signal intensity lesion on MRI is not specific for diagnosis of urinary tract calculus because hematoma in the urinary tract could also appear as low signal intensity lesions on MRI. Generally speaking, unenhanced computed tomography is more sensitive and specific than other imaging modalities for diagnosing urinary tract calculus including UPJ calculus.
5.3 Renal Staghorn Stone
Case 7
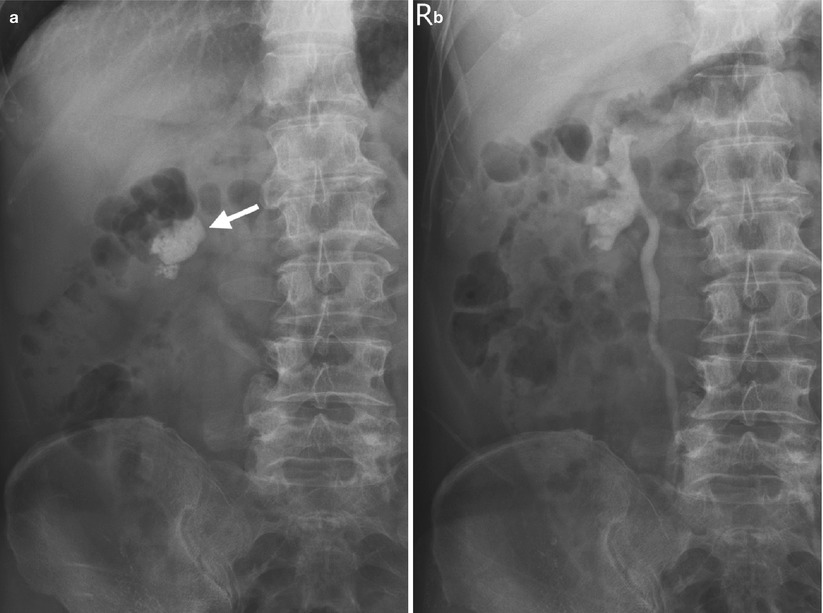
Fig. 5.11
Excretory urography (EU) shows a right renal staghorn stone. Figure 5.11, magnification view of the EU of the right kidney before contrast medium administration shows a radiopaque calculus (arrow) at the right renal pelvis and right middle and lower calyces, consistent with right renal staghorn stone. Figure 5.11b, magnification view of the EU of the right kidney at 10 min after contrast medium administration shows contrast opacification of the right renal pelvicalyceal system and right ureter without obvious dilatation.
Case 8
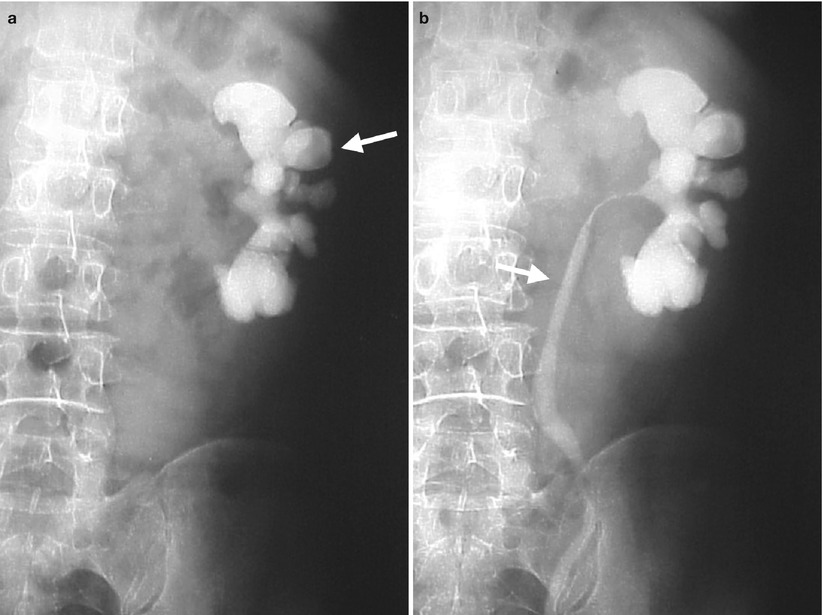
Fig. 5.12
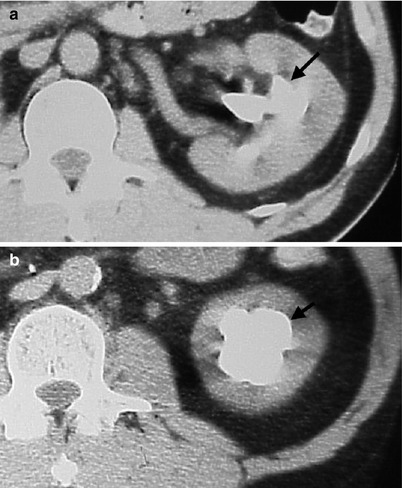
Fig. 5.13
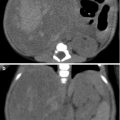
Excretory urography (EU) and computed tomography (CT) show a left renal staghorn stone. Figure 5.12a, magnification view of the EU of the left kidney before contrast medium administration shows a radiopaque calculus (arrow) occupying the whole left renal pelvicalyceal system as complete staghorn stone. Figure 5.12b, magnification of the EU of the left kidney at 10 min after contrast medium administration shows opacification in the left ureter (arrow) suggestive of no complete obstruction caused by the left renal staghorn stone. Figure 5.13a, unenhanced CT image of the left kidney shows a renal calculus (arrow) occupying the left renal pelvis and middle calyx. Figure 5.13b, unenhanced CT image, 4 cm caudal to Fig. 5.13a, shows the renal stone (arrow) also involving the left renal lower calyx.
Case 9

Fig. 5.14
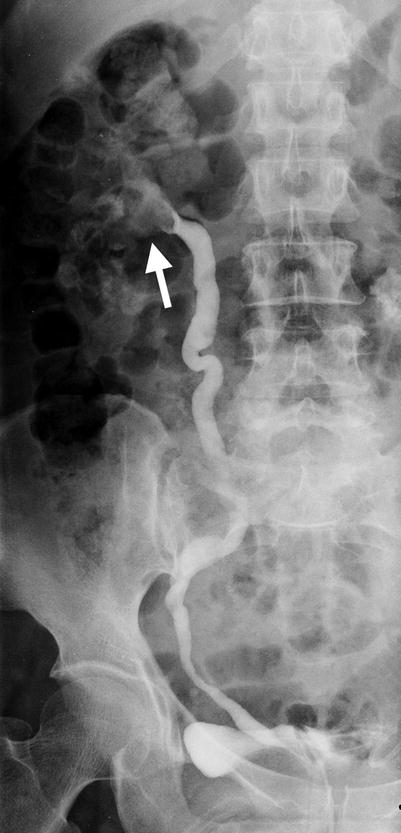
Fig. 5.15

Fig. 5.16
Plain radiography of the kidney, ureter, and bladder (KUB), retrograde pyelography (RP), and computed tomography (CT) show imaging findings of a patient with bilateral renal staghorn stones. Figure 5.14, KUB shows a left proximal ureteral stone (black arrowhead) in addition to right (white arrow) and left (black arrow) renal staghorn stones. Figure 5.15, right RP shows a filling defect (arrow) of the right renal pelvicalyceal system due to the right renal staghorn stone. Figure 5.16a, unenhanced axial CT image at the kidney level shows a left renal stone (black arrow) occupying the renal pelvis and calyces. Dilatation of the right renal calyces (white arrowheads) is shown. A part of the right renal staghorn stone is visualized at the right renal pelvis and posterior middle calyx. Figure 5.16b, unenhanced axial CT image, 1 cm, caudal to Fig. 5.16a, shows the right renal staghorn stone (white arrow) at the right renal pelvis and multiple calyces with resultant hydrocalicosis (white arrowheads). The left renal staghorn stone also involves left renal calyces (black arrow). Figure 5.16c, axial enhanced CT image of excretory phase during prone positioning shows contrast opacification of the right renal pelvicalyceal system (arrow) in spite of the right renal staghorn stone. However, fluid-contrast layering appearance is noted in the dilated right middle calyx (arrowhead), which is located at the nondependent part during prone positioning. Contrast opacification of the left renal collecting system is noted as well. Focal renal scarring is depicted in both kidneys.
Key Diagnostic Features
A renal staghorn stone means a renal calculus involving not only the renal pelvis but also one or more calyces at the same time. A staghorn stone is used to describe the picture of the stone simulating horns of a stag. If a renal staghorn stone involves the whole renal collecting system, complete renal staghorn stone is considered and incomplete staghorn stone if otherwise. Nearly all of renal staghorn stones are radiopaque on plain radiography of the kidney, ureter, and bladder (KUB). Therefore, KUB could readily detect and diagnose renal staghorn stones without difficulty. In spite of the large sizes of renal staghorn stones, obstruction and associated functional impairment of the corresponding kidneys are only shown in some of them. Excretory urography (EU), renal ultrasound (US), and computed tomography (CT) are useful in detecting hydronephrosis or hydrocalicosis due to obstructions by renal staghorn stones. Delayed or faint opacification of the ipsilateral renal collecting system on EU or enhanced CT of excretory phase suggests the presence of ipsilateral renal functional impairment. Furthermore, xanthogranulomatous pyelonephritis should be listed in the differential diagnosis if there are imaging findings of ipsilateral renal enlargement, hypodense areas surrounding the stone, and absence of excretion function of the ipsilateral kidney associated with a renal staghorn stone.
5.4 Ureteral Calculus
Case 10

Fig. 5.17
Excretory urography (EU) shows imaging findings of a left proximal ureteral calculus. Figure 5.17a, baseline plain radiography of anteroposterior image of the EU of the kidney, ureter, and bladder before contrast medium administration shows a radiopaque calculus (arrow) likely to be on the course of the left ureter. Figure 5.17b, EU of posteroanterior image at 10 min after contrast medium administration shows left hydronephrosis (arrowheads) and left hydroureter with contrast medium column obstruction just above this ureteral calculus (arrow).
Case 11
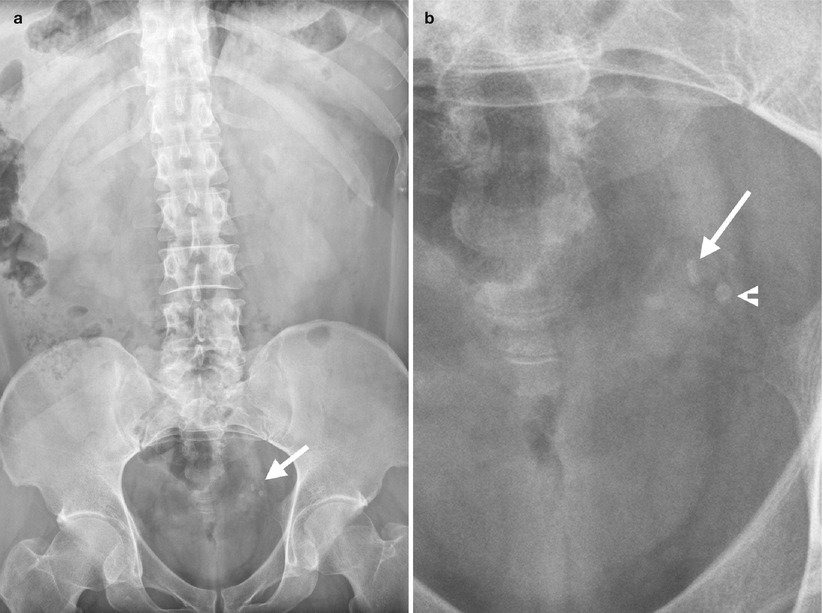
Fig. 5.18
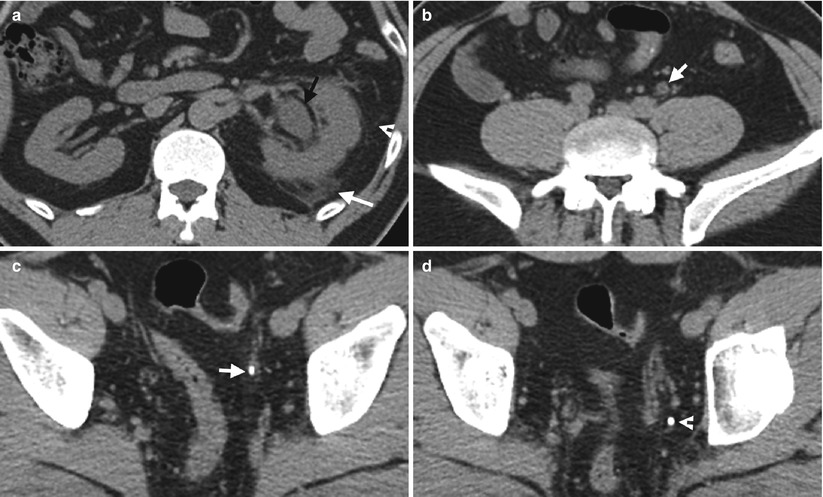
Fig. 5.19
Plain radiography of the kidney, ureter, and bladder (KUB) and unenhanced helical computed tomography (CT) images show a left distal ureteral calculus. Figure 5.18a, KUB shows two calcification foci (arrow) at the left pelvic cavity. Figure 5.18b, magnification view of the pelvic cavity of Fig. 5.18a shows elongated appearance of the medial upper calcification (arrow) which could be a left distal ureteral calculus. Another calcification (arrowhead) has a round shape with lucent center which is typical for a phlebolith. Figure 5.19a, unenhanced axial CT image of the left kidney shows left hydronephrosis with left perinephric stranding (arrowhead) and fluid (arrow), consistent with indirect sign of left ureteral calculus. Figure 5.19b, unenhanced axial CT image of the left middle ureter level shows mild dilatation of the left ureter (arrow). Figure 5.19c, unenhanced axial CT image of the left distal ureter level shows a left distal ureteral calculus (arrow) showing high density. Note there is soft tissue density surrounding the calculus representing ureteral wall edema. Figure 5.19d, unenhanced axial CT image, 0.5 cm caudal to Fig. 5.19c, shows the phlebolith (arrow) without surrounding soft tissue density.
Case 12
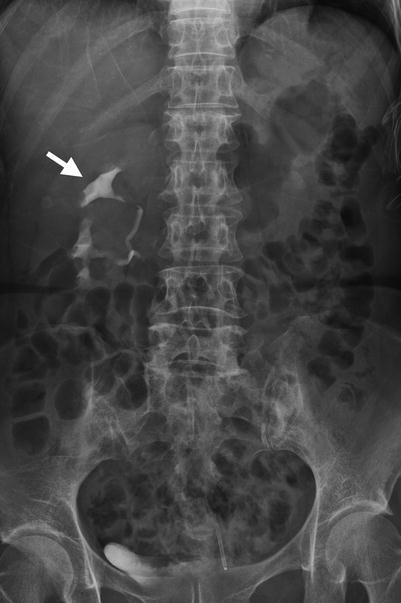
Fig. 5.20
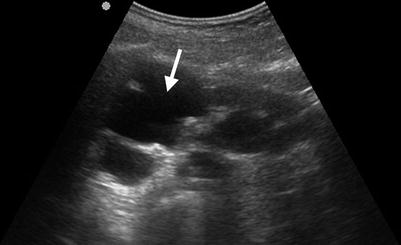
Fig. 5.21
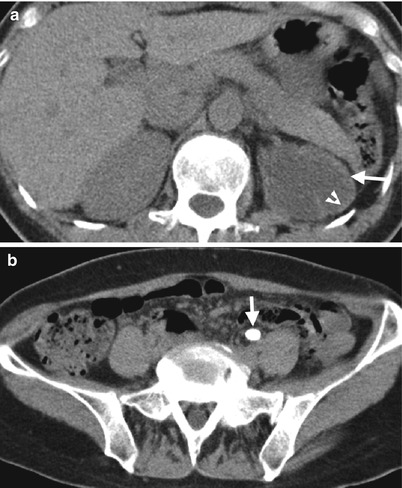
Fig. 5.22
Excretory urography (EU), renal ultrasound (US), and unenhanced helical computed tomography (CT) images show imaging findings identified in a patient with left middle ureteral calculus. Figure 5.20, EU (10 min after contrast medium administration) shows normal opacification (arrow) of the right renal pelvicalyceal system. Note absence of contrast medium opacification of the left renal pelvicalyceal system. There is no radiopaque calculus detectable on this image. Figure 5.21, left renal US of longitudinal scan shows obvious dilatation (arrow) of the left renal pelvicalyceal system as hydronephrosis. Figure 5.22a, unenhanced CT image at the kidney level shows left hydronephrosis (arrow) with thinning of the left renal parenchyma (arrowhead). Figure 5.22b, unenhanced CT image at the left middle ureter level shows a large calculus (arrow) in the left middle ureter readily detected by its high density.
Case 13
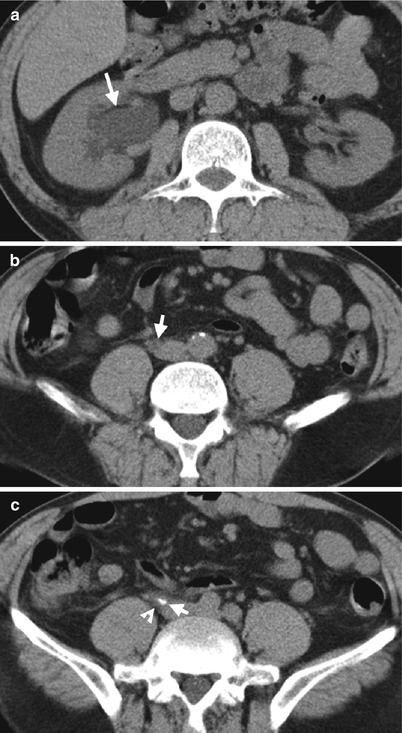
Fig. 5.23
Key Diagnostic Features
Ureteral calculus is best diagnosed by unenhanced helical computed tomography (CT) by high sensitivity, specificity, and accuracy shown in numerous studies of the literature. On unenhanced CT, ureteral calculus is diagnosed by direct and indirect signs [2, 3]. Direct sign on unenhanced CT means the recognition of a calculus with confirmation of its anatomical location being in the ureter [3]. Since nearly all ureteral calculus displays high density foci on unenhanced CT, there is no difficulty to recognize the calculus itself. Nonetheless, there are other alternative conditions (e.g., phlebolith, calcified lymph node, arterial calcification) which show similar calcification foci in the abdomen and pelvic cavity on unenhanced CT. Thus, it is necessary to confirm a calcified foci being within the ureteral lumen for diagnosis of a ureteral calculus. Tracing down the ureteral course from the ureteropelvic junction to the ureterovesical junction (UVJ) on unenhanced CT whenever possible is a must for clarifying the anatomical location of a ureteral calculus. On the other hand, the presence of associated indirect signs of a ureteral calculus on unenhanced CT adds confidence in making a diagnosis and provides information on the altered anatomical and functional status secondary to ureteral calculi [2]. Indirect signs of ureteral calculi on unenhanced helical CT include hydronephrosis, hydroureter, perinephric or periureteral stranding or fluid, tissue rim sign, ipsilateral nephromegaly, and ipsilateral decreased renal density [4]. Tissue rim sign is typically a soft tissue rim surrounding the whole calculus caused by ureteral wall edema, which is highly specific for diagnosing ureteral calculus. Patients with ureteral calculus usually present with acute flank pain, especially in emergency settings. Unenhanced helical CT provides alternative diagnoses other than ureteral calculus for patients presenting with acute flank pain in addition to its high accuracy of diagnosing ureteral calculus, which is thus a highly valuable tool for clinical decision making [2]. The detectability of ureteral calculus on plain radiographs of the kidney, ureter, and bladder (KUB) is affected by the size, location, and composition of the calculus itself as well as by the overlying anatomical structures and body habitus of the patient. Ureteral calculus located in the middle ureter has lower detectability than other locations on KUB because the overlying sacrum has similar density to that of a ureteral calculus [5]. Uric acid stones are usually radiolucent and thus undetectable on KUB. Renal US is usually used for detecting the presence or absence of hydronephrosis in a patient suspected of having a ureteral calculus instead of identifying the stone itself. Nonetheless, if hydronephrosis is shown on renal US in a patient showing a radiopaque calculus of ipsilateral ureter on KUB, a confidence diagnosis of a ureteral calculus with resultant hydronephrosis could be made by their association.
5.5 Ureterovesical Calculus
Case 14
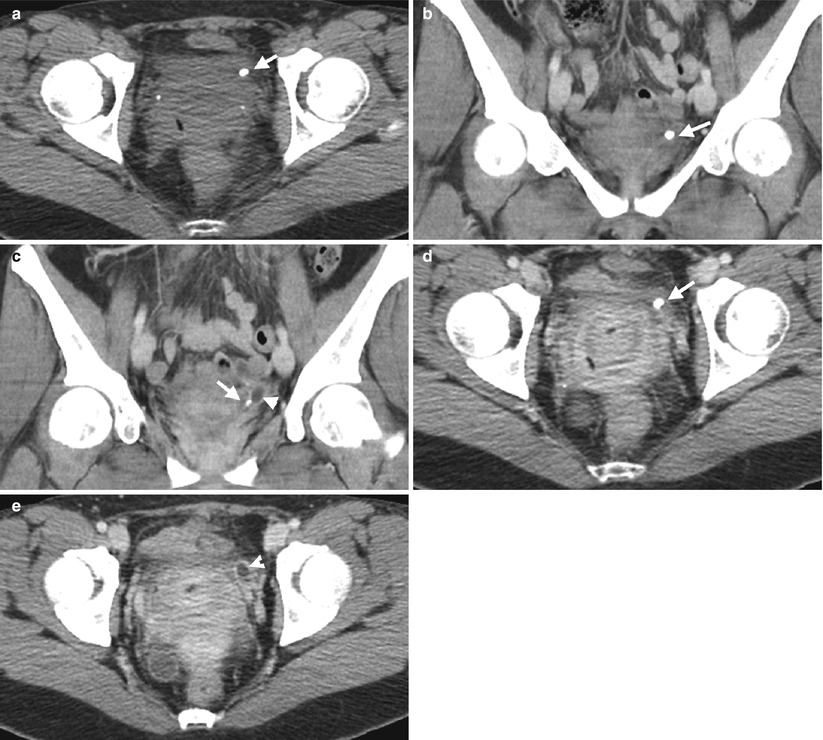
Fig. 5.24
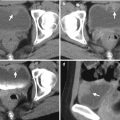
Computed tomography (CT) shows imaging finding of a left ureterovesical calculus with dilatation of the left distal ureter. Figure 5.24a, unenhanced axial CT image shows a calcified focus (arrow) at the left anterior pelvic cavity. Figure 5.24b, enhanced coronal CT image shows this left pelvic cavity calcification (arrow) at the left ureterovesical junction (UVJ). Figure 5.24c, enhanced coronal image, contiguous to Fig. 5.24b, shows a part of the left UVJ calculus (arrow) with dilatation of most distal part of the left distal ureter (arrowhead). Figure 5.24d, enhanced axial CT image shows this calcified focus (arrow) at the left UVJ, consistent with left UVJ calculus. Figure 5.24e, enhanced axial CT, 0.5 cm superior to Fig. 5.24d, shows dilated left distal ureter (arrowhead) due to obstruction by the left UVJ calculus.
Case 15

Fig. 5.25
Computed tomography (CT) illustrates a left ureterovesical (UVJ) calculus with left urotract obstruction. Figure 5.25a, enhanced axial CT at the renal level shows left hydronephrosis (black arrowhead) and hydroureter (white arrowhead). A calculus (white arrow) in the left renal lower calyx is noted. Note there is no contrast opacification of the left urotract. Figure 5.25b, enhanced axial CT image of the distal ureter level shows dilatation of the left distal ureter (arrow) without contrast medium opacification. In contrast, the right distal ureter is normal sized with contrast opacification. Figure 5.25c, enhanced axial CT image of the urinary bladder level shows a left UVJ calculus (arrow) with faint visualization of a segment of the left dilated ureter (arrowheads). Figure 5.25d, enhanced axial CT image, 0.5 cm, inferior to Fig. 5.25c, shows a small part of the left UVJ calculus (arrow) with more clear visualization of dilatation of the left distal ureter (arrowheads).
Key Diagnostic Features
Ureterovesical calculus is diagnosed by the depiction of a calculus on the ureterovesical junction (UVJ). It is not uncommon for a UVJ calculus to be associated with urotract obstruction. Computed tomography (CT) is usually the best imaging modality for its location and depiction, especially before contrast medium opacification of the urotract.
5.6 Urinary Bladder Calculus
Case 16
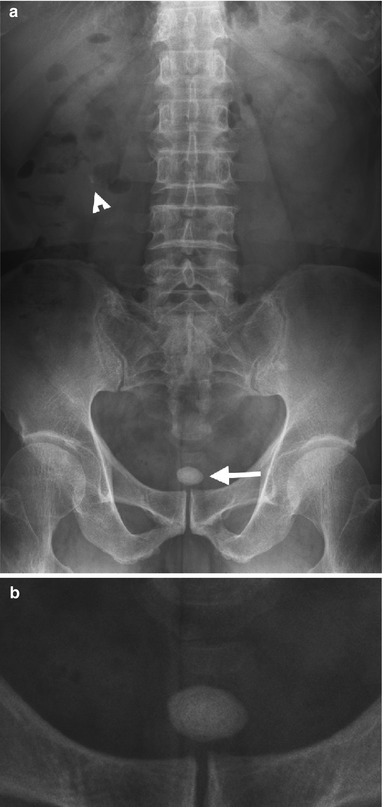
Fig. 5.26
Plain radiography of the kidney, ureter, and bladder (KUB) shows a urinary bladder calculus. Figure 5.26a, KUB shows a calcification lesion (arrow) in lower pelvic cavity, consistent with bladder calculus. There is a calculus (arrowhead) at the right renal lower pole as well. Figure 5.26b, magnification view of the pelvic cavity of Fig. 5.26a shows laminated appearance of the urinary bladder calculus (arrow).
Case 17
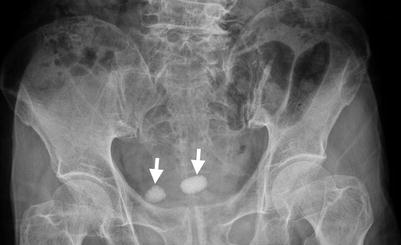
Fig. 5.27
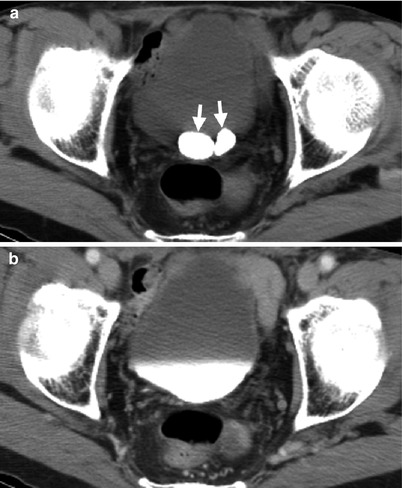
Fig. 5.28
Plain radiography of the kidney, ureter, and bladder (KUB and computed tomography (CT) images show two urinary bladder calculi. Figure 5.27, magnification view of KUB shows two oval-shaped calculi (arrows) in the urinary bladder. Figure 5.28a, unenhanced CT image shows two dense foci (arrows) in the urinary bladder as calculi. Figure 5.28b, enhanced axial CT image of excretory phase shows contrast opacification of the urinary bladder, obscuring the two calculi.
Case 18
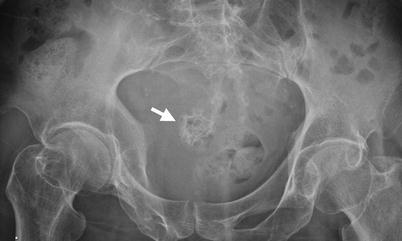
Fig. 5.29
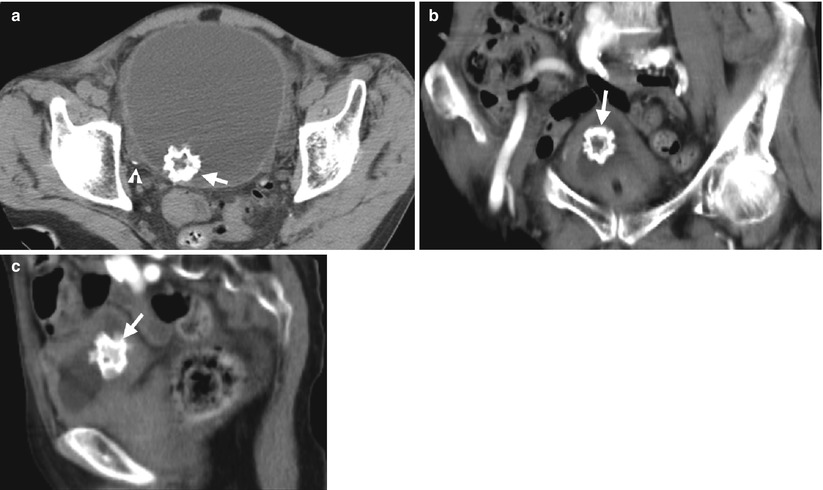
Fig. 5.30
Plain radiography of the kidney, ureter, and bladder (KUB and computed tomography (CT) images show a bladder jackstone. Figure 5.29, magnification view of the KUB shows a urinary bladder calculus (arrow) with faint radiopaque density and spiculations. Figure 5.30a, unenhanced axial CT image shows this calculus (arrow) with multiple spiculations and a more lucent center. There is another tiny calculus (arrowhead) in a right urinary bladder diverticulum. Figure 5.30b, enhanced coronal image shows the speculated calculus (arrow) within the upper part of the urinary bladder. Figure 5.30c, enhanced sagittal CT image shows this jackstone (arrow) in posterior part of the urinary bladder.
Case 19
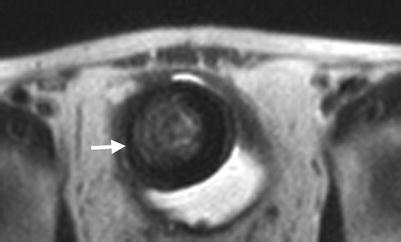
Fig. 5.31
Magnetic resonance imaging (MRI) shows a large calculus in the urinary bladder. Figure 5.31, T2-weighted image of MRI shows a round low signal intensity lesion (arrow) within the urinary bladder cavity, consistent with a bladder calculus.
Key Diagnostic Features
Urinary bladder calculus has a variety of shapes, appearances, and densities. Bladder calculus may appear as laminated and oval in shape, has a round contour, and resembles a child’s toy jacks (so-called jackstone) [6]. Similar to urinary tract calculi at other anatomical locations, urinary bladder calculus may appear as dense radiopaque, faint radiopaque, or radiolucent (i.e., undetectable) stone on plain radiography of the kidney, ureter, and bladder (KUB). On unenhanced computed tomography, urinary bladder calculus appears as a high density focus which makes it readily detectable. On magnetic resonance imaging, urinary bladder calculus appears as a low signal intensity lesion on both T1-weighted and T2-weighted images.
5.7 Urethral Calculus
Case 20

Fig. 5.32
Excretory urography (EU) shows a urethral calculus in a man. Figure 5.32a, plain radiography of the kidney, ureter, and bladder shows two calcified foci (arrow and arrowhead). Figure 5.32b, magnification view of Fig. 5.32a illustrates one calculus (arrow) located between the symphysis pubis and another (arrowhead) at the left lower pelvic cavity. Figure 5.32c, magnification view of the EU of the pelvic cavity at 10 min after contrast medium administration using anterior oblique position shows the calculus (arrow) inferior to the urinary bladder base. Figure 5.32d, magnification view of the EU of the pelvic cavity after voiding shows mild contrast medium stasis at the urethra (arrow) by the urethral calculus located between the symphysis pubis. There is mild dilatation of the left distal ureter (arrowhead) due to the left distal ureteral calculus located at the left lower pelvic cavity.
Case 21
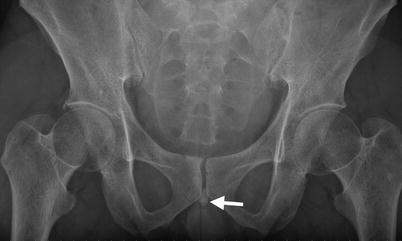
Fig. 5.33
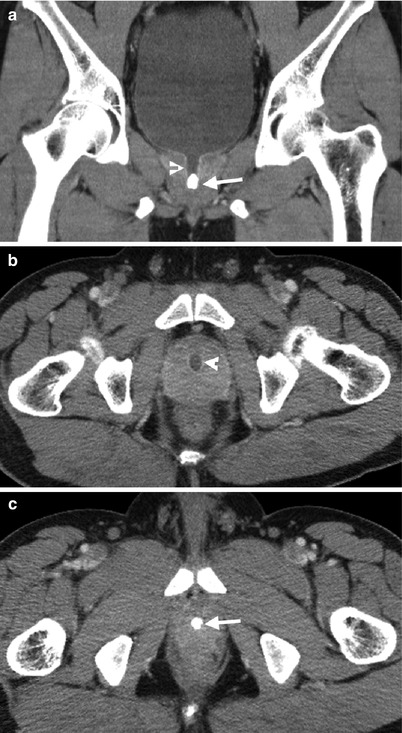
Fig. 5.34
Plain radiography of the kidney, ureter, and bladder (KUB and computed tomography (CT) images show a urethral calculus in a man. Figure 5.33, magnification view of KUB shows a calculus (arrow) between inferior margins of the symphysis pubis, consistent with urethral calculus. Figure 5.34a, enhanced coronal CT image shows a dense calculus (arrow) at the urethra with proximal urethral dilatation (arrowhead). Figure 5.34b, enhanced axial CT image at the prostate gland base level shows mild dilatation of the prostate urethra (arrowhead). Figure 5.34c, enhanced axial CT image at the prostate gland apex level shows a calculus (arrow) occupying the whole lumen of the urethra.
Key Diagnostic Features
Urethral calculus is more common in men than in women. It is because the male urethra has an anatomical narrowing point at the membranous urethra and is longer than the female urethra. On plain radiograph of the kidney, ureter, and bladder, urethral calculus is highly suggested if a dense focus is shown between the symphysis pubis. On excretory urography, stasis of contrast medium surrounding the calculus after voiding could further support the location of the calculus being in the urethra. On computed tomography, urethral calculus is diagnosed by the depiction of a calcified focus in the urethra with possible associated obstruction findings.
5.8 Cystocele
Case 22
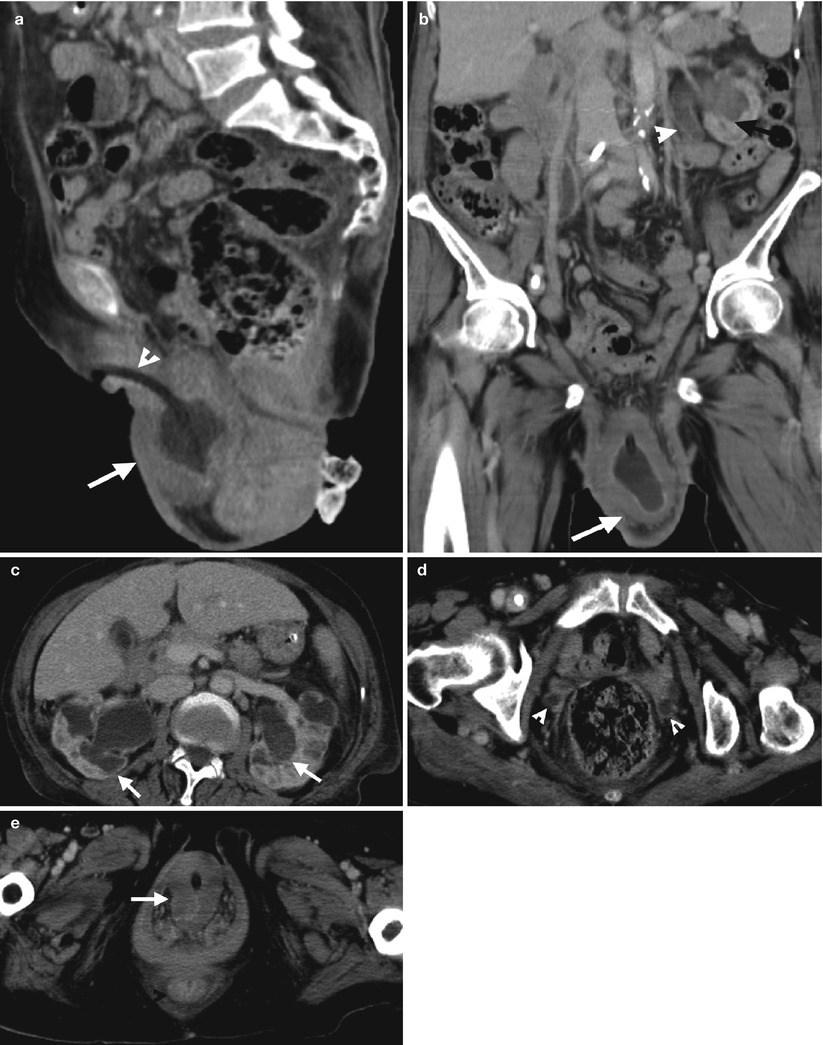
Fig. 5.35
Computed tomography (CT) shows imaging findings of a cystocele with bilateral hydronephrosis. Figure 5.35a, sagittal enhanced CT image shows abnormally low position of the urinary bladder (arrow) with caudal angulation of the urethra marked by the Foley catheter (arrowhead). Figure 5.35b, coronal enhanced CT image shows the whole urinary bladder (arrow) below the pubic bone, consistent with cystocele. Figure 5.35c, enhanced axial CT image at the kidney level shows bilateral hydronephrosis (arrows). Figure 5.35d, enhanced axial CT image at the symphysis pubis level shows nonvisualization of the urinary bladder. Dilatation of bilateral ureters (arrowheads) is identified. Figure 5.35e, enhanced axial CT image at the perineal level shows a prolapsed urinary bladder (arrow) with thick wall.
Case 23
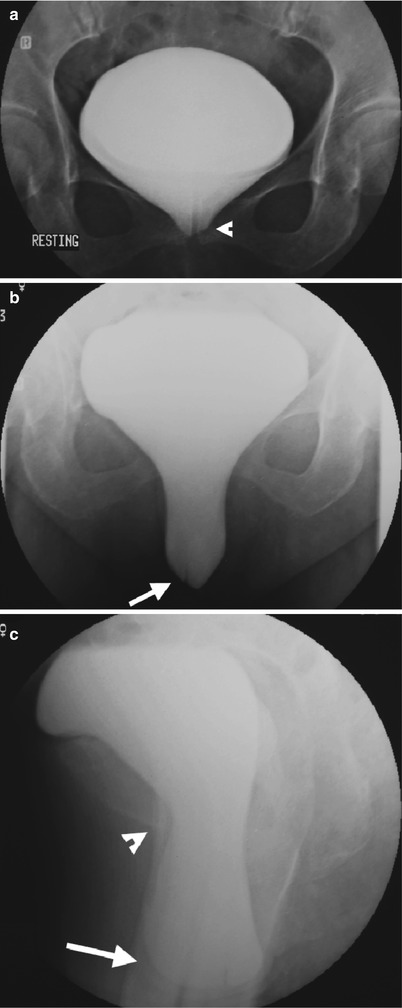
Fig. 5.36
Cystography shows cystocele in a female patient. Figure 5.36a, cystography of anteroposterior film in resting status shows focal descent (arrowhead) of central part of the bladder, suggestive of poor central support. However, it is still above the inferior margin of the symphysis pubis. Figure 5.36b, cystography of anteroposterior film in straining status shows the central bladder base (arrow) moving to below the level of the symphysis pubis. Figure 5.36c, cystography of lateral film in straining status of upright positioning shows dropped bladder base (arrow) well below the inferior margin of the symphysis pubis (arrowhead). After several trials for voiding, the patient fails to empty the bladder, suggestive of cystocele with bladder outlet obstruction.
Key Diagnostic Features
The urinary bladder base is normally above the symphysis pubis. Cystocele means abnormally low position of the urinary bladder below the inferior margin of the symphysis pubis. The underlying cause of cystocele is pelvic floor laxity. Therefore, cystocele could occur with prolapse of other pelvic organs including uterine prolapse, rectocele, or enterocele. Cystocele is therefore diagnosed on images by illustrating the urinary bladder base below the symphysis pubis. Nonetheless, the positioning of bladder base changes in different status. The bladder base descends in straining status as compared to that in resting status. Thus, mild cystoceles are only diagnosed in straining status and upright positioning. Dynamic magnetic resonance imaging (MRI) obtained at resting and straining status has recently become a popular imaging tool to assess pelvic floor dysfunction [7]. Hydronephrosis is associated with cystoceles due to bladder outlet obstruction or ureteral stretching effect.
5.9 Bladder Herniation
Case 24

Fig. 5.37
Magnetic resonance imaging (MRI) shows imaging findings of bladder herniation of the right inguinal canal. Figure 5.37a, sagittal T2-weighted image (T2WI) of MRI shows the urinary bladder (arrowhead) herniation into the inguinal canal (arrow). Figure 5.37b, sagittal T1-weighted fat-suppressed image after contrast enhancement shows contrast medium opacification of the urinary bladder (arrowhead). However, the herniated part into the inguinal canal (arrow) of the urinary bladder has no contrast-opacified urine. Figure 5.37c, axial T2WI of MRI shows anterior part of the urinary bladder going in the direction of the right inguinal canal (arrow). Figure 5.37d, axial T2WI of MRI shows the urinary bladder passing through the inguinal ring to enter the right inguinal canal (arrow). Figure 5.37e, axial T2WI of MRI shows the herniated part (arrow) of the urinary bladder in the right inguinal canal. There is bowel loop herniation into the left inguinal canal.
Case 25
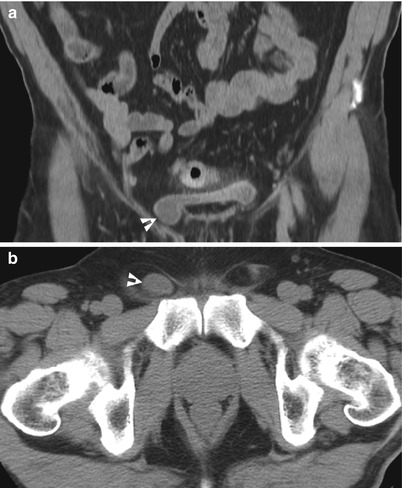
Fig. 5.38
Computed tomography (CT) shows imaging findings of small herniation of the urinary bladder into the right inguinal canal. Figure 5.38a, enhanced coronal CT imaging shows a small part (arrowhead) of the urinary bladder herniation into the right inguinal canal. Figure 5.38b, unenhanced axial CT image shows a small cystic part (arrowhead) in the right inguinal canal as bladder herniation.
Case 26

Fig. 5.39
Cystography shows urinary bladder herniation into the right inguinal canal and scrotum. Figure 5.39a, cystography of right anterior oblique view shows bladder herniation into the right inguinal canal (arrow). Figure 5.39b, cystography of anteroposterior view shows enlargement of the herniated part (arrow) into the right scrotum after more urine fills in.
Key Diagnostic Features
Bladder herniation to the inguinal canal is an uncommon entity [8]. In severe bladder herniation to the inguinal canal, the urinary bladder shows a dumbbell appearance. The diagnosis of bladder herniation into the inguinal canal or even scrotum on images is based on the identification of the herniated part being contiguous to the main part of the urinary bladder regardless of contrast medium opacification or not. On the other hand, the opacification of the herniated part of the urinary bladder on excretory phase of computed tomography, magnetic resonance imaging, or on excretory urography and cystography helps in confirmation of the presence of bladder herniation. Patients with severe bladder herniation could suffer from incomplete emptying of the urinary bladder after voiding, due to the partial obstructive effect through the inguinal canal. Mild bladder herniation is usually detected as an incidental findings on images because it causes no symptom. Furthermore, some infants less than 1 year old have temporary bladder herniation to the inguinal canal due to incompetent inguinal ring, which is under development, usually called “bladder ear” rather than “bladder herniation.” If the child has persistent bladder herniation after 1 year of age, then existence of true bladder herniation is considered.
Related posts:
Stay updated, free articles. Join our Telegram channel

Full access? Get Clinical Tree


