(1)
Department of Medical Imaging, Linkou Chang Gung Memorial Hospital, Taoyuan, Taiwan
(2)
Department of Medical Imaging and Radiological Sciences, Institute of Radiological Research Chang Gung University, Taoyuan, Taiwan
9.1 Benign Prostate Hyperplasia
Case 1
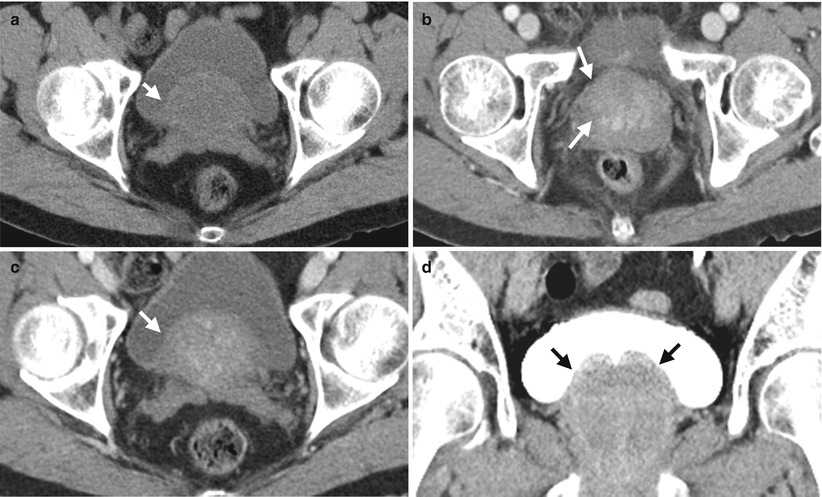
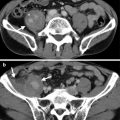
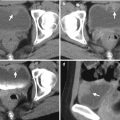
Fig. 9.1
Computed tomography (CT) shows imaging findings of benign prostate hyperplasia (BPH). Figure 9.1a, unenhanced axial CT image at the urinary bladder level shows an oval soft density mass (arrow) at the posterior half of the urinary bladder cavity. Figure 9.1b, enhanced axial CT image at the prostate level shows enhancement of the enlarged central gland (arrow) of the prostate, distinguishable from the peripheral zone of the prostate gland. Figure 9.1c, enhanced axial CT image of the urinary bladder level shows similar enhancement of the oval soft tissue structure (arrow) as that of the central gland in Figure 9.1b, suggestive of its continuity with prostate central gland. Figure 9.1d, enhanced coronal CT image of excretory phase of the urinary bladder shows protrusion (arrows) of medial parts of both lobes of the prostate gland into the urinary bladder cavity. The smooth surfaces and protruding parts of the prostate gland favor BPH.
Case 2
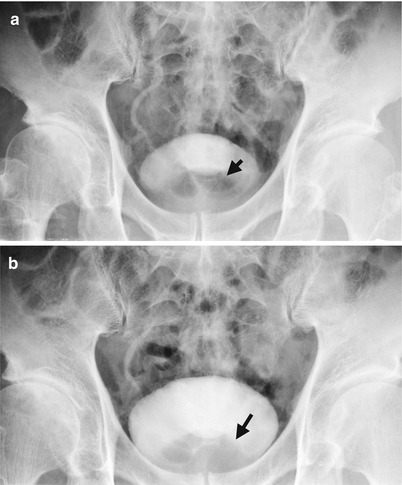
Fig. 9.2
Excretory urography (EU) shows imaging findings of prostate enlargement due to benign prostate hyperplasia (BPH). Figure 9.2a, magnification image of the urinary bladder of EU at 10 min after contrast medium administration shows indentation of the bladder base by an enlarged prostate gland (arrow). Figure 9.2b, magnification image of the urinary bladder of EU at 30 min after contrast medium administration shows smooth contour of enlarged prostate gland (arrow) favoring BPH.
Case 3

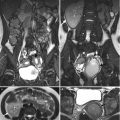
Fig. 9.3
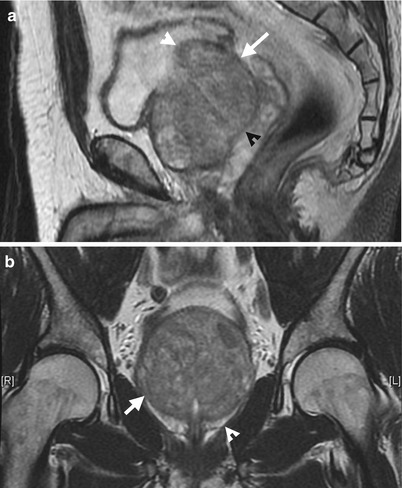
Fig. 9.4
Transrectal ultrasound (TRUS) and magnetic resonance imaging (MRI) illustrate typical findings of BPH. Excretory urography (EU) shows imaging findings of prostate enlargement due to benign prostate hyperplasia (BPH). Figure 9.3, TRUS shows obviously diffuse enlargement of the prostate gland (arrow) with protrusion (arrowhead) into the urinary bladder. Figure 9.4a, sagittal T2-weighted image of prostate MRI shows enlargement of the central gland of the prostate (arrow) as BPH. The visible dark line of the surgical capsule (black arrowhead) ensures the enlarged part located in the central gland. The BPH protrudes into the bladder cavity (white arrowhead). Figure 9.4b, coronal T2-weighted image shows enlargement of the central gland of the prostate by benign prostate hyperplasia. Both prostate capsule (arrowhead) and surgical capsule (arrow) show normal low signal intensity lines.
Key Diagnostic Features
Benign prostate hyperplasia is hyperplasia of the transitional zone of the prostate gland. On EU, BPH usually shows indentation on the urinary bladder base and, sometimes, elevation of the urinary bladder base away from the symphysis pubis as well as hooking appearance of the most distal segment of the ureter by elevation effect. However, the distinction of the transitional zone and central zone of the prostate gland could not be clearly shown on images. Thus, the transitional and central zones of the prostate gland are named as “central gland” even on computed tomography (CT) or magnetic resonance imaging (MRI). On CT, the central gland is occasionally distinguishable from the peripheral zone after contrast medium administration by its higher density. BPH usually shows an enlarged prostate gland with its central part protruding into the urinary bladder showing a smooth outline. The similar density of the intravesicular protruding part with visible contiguity with the central gland of the prostate gland on CT could make the diagnosis of BPH confident. On magnetic resonance image (MRI), the anatomical differentiation of the central gland from the peripheral zone is best identified on T2-weighted image (T2WI) by the surgical capsule showing a dark line. Sagittal or coronal T2WI of MRI could clearly delineate the anatomical relationship of the intravesicular protrusion of the enlarged central gland of the prostate and thus suggest the diagnosis of BPH.
9.2 Prostate Tuberculosis
Case 4
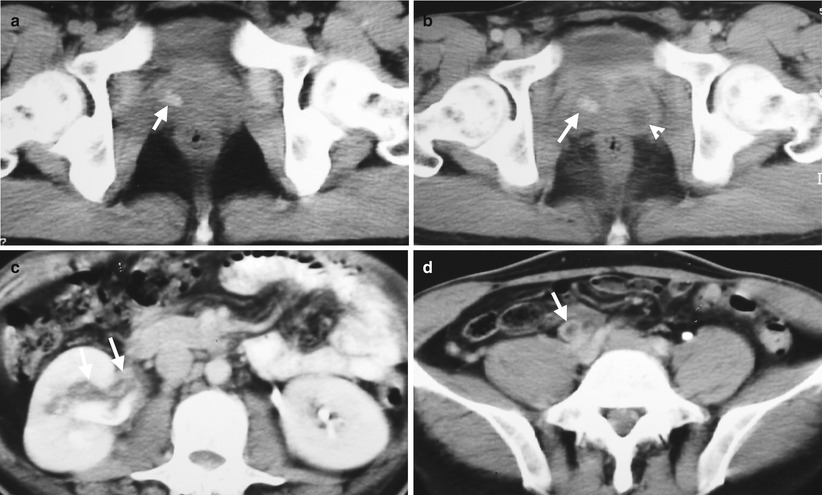
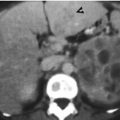
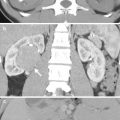
Fig. 9.5
Computed tomography (CT) shows a patient having prostate as well as right renal and ureteral tuberculosis. Figure 9.5a, unenhanced axial CT image shows calcification (arrow) of the right lobe of the prostate gland. Figure 9.5b, enhanced axial CT shows an abscess (arrowhead) on the left lobe in addition to right lobe calcification (arrow). Figure 9.5c, axial enhanced CT image shows wall thickening and dirty fat (arrows) along the right renal pelvis. Figure 9.5d, axial enhanced CT shows enhanced and thickened wall of the right middle ureter (arrow).
Key Diagnostic Features
Prostate TB could appear as prostate abscess with or without calcifications on images. If prostate abscess is associated with calcifications on images, prostate TB should be taken into consideration first [1]. On the other hand, in the absence of concurrent prostate calcification, it may not be possible to differentiate prostate TB abscess from prostate pyogenic abscess by prostate imaging findings alone. However, prostate TB often comes from upper urinary tract TB. Thus, the presence of renal or ureteral TB findings in addition to prostate abscess may imply the diagnosis of prostate TB.
9.3 Tuberculosis of the Seminal Vesicles
Case 5
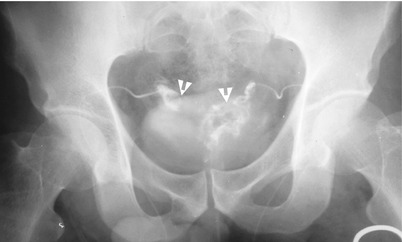
Fig. 9.6
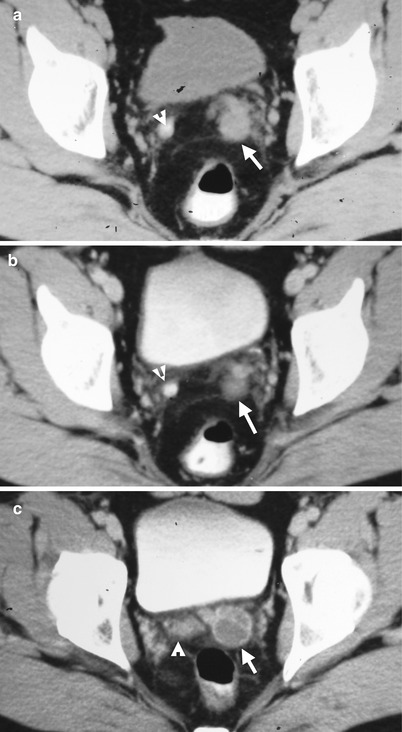
Fig. 9.7
Seminal vesiculography and computed tomography (CT) illustrate findings of tuberculosis of the seminal vesicles. Figure 9.6a, seminal vesiculography shows filling defects (arrowheads) in bilateral seminal vesicles, more obvious on the left side. The urinary bladder is opacified by contrast medium before this examination. Figure 9.7a, unenhanced axial CT shows faint calcification (arrowhead) of the right seminal vesicle and enlarged size (arrow) of the left seminal vesicle. Figure 9.7b, enhanced axial CT of the same level as Fig. 9.7a shows mildly heterogeneous enhancement of the left seminal vesicle (arrow) with adjacent dirty fat. There is also mild dirty fat adjacent to right seminal vesicle calcification (arrowhead). Figure 9.7c, enhanced axial CT shows multiloculated cystic appearance of the left seminal vesicle (arrow). There are also tiny cystic areas in the right seminal vesicle (arrowhead).
Key Diagnostic Features
Tuberculosis (TB involvement of the seminal vesicles leads to TB abscess formation, calcifications, and caseous necrosis. Therefore, TB involvement of the seminal vesicles appears as calcification and abscess formation with variable degrees of dirty adjacent fat on computed tomography (CT) [1]. On seminal vesiculography, the caseous materials by TB become filling defects in seminal vesicles. Nonetheless, in the absence of calcification of the seminal vesicles, the imaging appearance of abscesses of the seminal vesicle by bacteria or TB infection could be similar and lack clear distinction [1]. In contrast, abscess in the seminal vesicles with calcifications or concurrent findings of TB involvement on other sites including prostate or urinary tract should alert the readers of the possibility of TB infection.
9.4 TB Orchitis and Epididymitis
Case 6
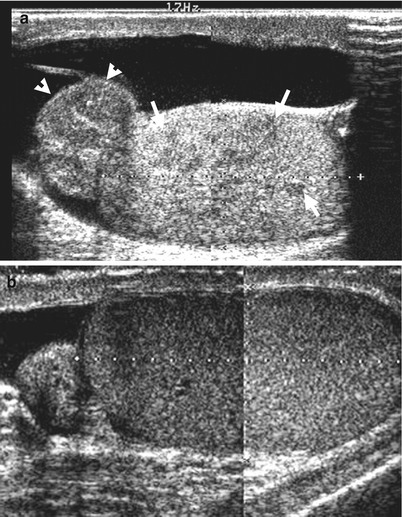
Fig. 9.8
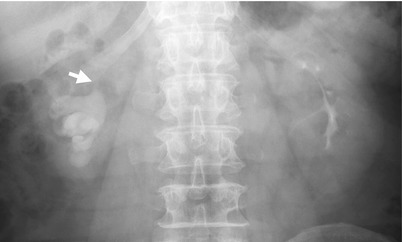
Fig. 9.9
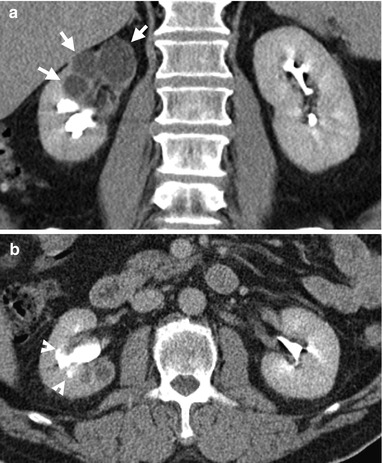
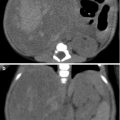
Fig. 9.10
Scrotal ultrasound (US), excretory urography (EU), and computed tomography (CT) show a patient with right tuberculosis (TB) epididymo-orchitis and right renal TB. Figure 9.8a, right scrotal US shows enlargement of the right epididymis (arrowheads) and multiple hypoechoic areas (arrows) in the right testis. Figure 9.8b, left scrotal US shows normal size and echogenicity of the left epididymis and testis. Figure 9.9, EU shows an amputated infundibulum (arrow) on the right renal upper infundibulum. The right upper calyx is not opacified by contrast medium. Figure 9.10a, coronal CT image of excretory phase shows dilated right upper calyx (arrows) without contrast opacification. Neither tumor nor stone is detected on CT explaining for the hydrocalicosis. Figure 9.10b, axial CT image of excretory phase shows moth-eaten calyx (arrowheads) adjacent to the dilated and nonopacified calyx of the right kidney.
Key Diagnostic Features
TB orchitis usually occurs with epididymitis at the same time [2]. Unilateral TB epididymo-orchitis is more common than bilateral diseases [2]. TB epididymo-orchitis appears as intratesticular focal or diffuse low-echogenicity areas with epididymal involvement on ultrasound (US) [2]. US findings of TB epididymo-orchitis are nonspecific. Nonetheless, pyogenic orchitis usually has more blood flow than TB orchitis. Since male genital TB usually results from renal TB via infected urine, most cases of genital TB have detectable renal TB lesions as well. Thus, imaging findings of renal TB in the presence of nonspecific scrotal US findings may support the diagnosis of TB epididymo-orchitis.
9.5 Prostate Cancer Confined in the Prostate Gland
Case 7
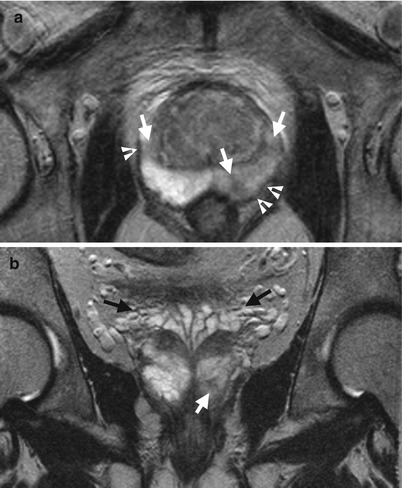
Fig. 9.11
A patient with prostate cancer has tumors confined in the prostate gland shown on magnetic resonance imaging (MRI). Figure 9.11a, axial T2-weighted imaged (T2WI) of MRI shows multiple tumors (arrows) located in both lobes of the prostate presenting as low signal intensity areas or nodules. The prostate capsule overlying the tumors shows normal dark signal intensity (arrowheads), suggestive of tumors confined in the prostate. Note the normal peripheral zones of the prostate gland shows high signal intensity on T2WI. Figure 9.11b, coronal T2WI of MRI shows normal seminal vesicles as thin-walled tubular structures with high signal intensity contents. A small prostate cancer (arrow) is noted in the peripheral zone of the left lobe.
Case 8
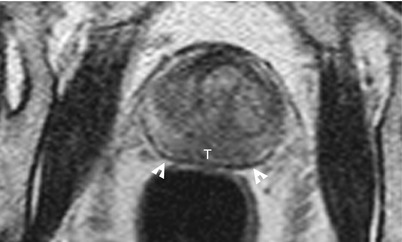
Fig. 9.12
Magnetic resonance imaging (MRI) shows prostate cancer confined in the gland. Figure 9.12, axial T2-weighted imaged (T2WI) of MRI shows abnormal low signal intensity area in the peripheral zone of both lobes of the prostate, compatible with prostate cancer (T). The prostate capsule (white arrowheads) shows normal dark line.
Case 9
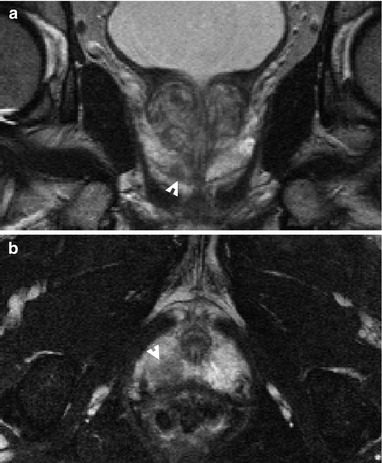
Fig. 9.13
Magnetic resonance imaging (MRI) shows prostate cancer confined in the right lobe of the prostate gland. Figure 9.13a, coronal T2-weighted imaged (T2WI) of MRI shows a prostate cancer nodule (arrowhead) within peripheral zone of the right lobe of the prostate gland. Figure 9.13b, axial T2WI of MRI shows a tumor (arrowhead) confined in the right prostate apex.
Key Diagnostic Features
Magnetic resonance imaging (MRI) is better than computed tomography (CT) and transrectal ultrasound (TRUS) for localizing and local staging of prostate cancer. Prostate cancers in peripheral zones usually show low signal intensity areas or nodules on T2-weighted images (T2WI) of MRI [3]. In contrast, normal peripheral zone of the prostate gland shows high signal intensity on T2WI of MRI [3]. Diffusion-weighted image (DWI) and apparent diffusion coefficient (ADC) of MRI could also help in localizing prostate cancer by showing water restriction of prostate cancers [4]. If prostate cancers in peripheral zones do not abut the prostate capsule, confinement in the prostate gland of the tumors could be assured. When a prostate cancer abuts the prostate capsule, recognition of a normal dark line of prostate capsule on T2WI of MRI confirmed tumor confinement in the prostate gland.
Main Differential Diagnoses
1.
Post-biopsy hemorrhage of the prostate gland
The diagnosis of prostate cancer is confirmed by histological examination of prostate biopsy. MRI is usually done for local staging of prostate cancer after histological proof of prostate cancer. It is therefore common to have post-biopsy hemorrhage of the prostate gland on prostate MRI. Prostate hemorrhage after biopsy could appear as low signal intensity areas of peripheral zones on T2WI of MRI, similar to those of prostate cancers. Nonetheless, prostate hemorrhage usually shows high signal intensity areas on T1-weighted or T1-fat suppressed images. In contrast, prostate cancers are usually similar to the adjacent normal prostate areas. Thus, low signal intensity areas on T2WI of MRI with high signal intensity appearance on T1WI at the same sites suggest post-biopsy hemorrhage rather than prostate cancer.
9.6 Prostate Cancer with Extracapsular Extension
Case 10
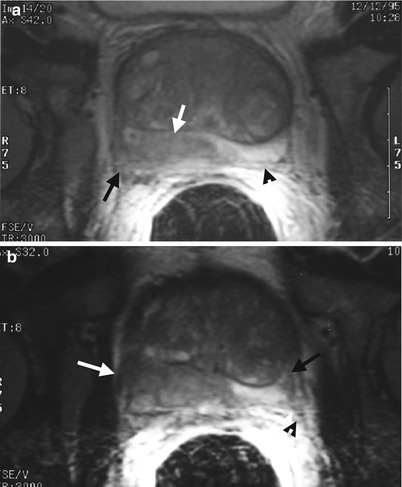
Fig. 9.14
A patient with prostate cancer has right extracapsular extension with right neurovascular bundle tumor invasion. Figure 9.14a, axial T2-weighted imaged (T2WI) of magnetic resonance image (MRI) using an endorectal coil shows abnormal low signal intensity in the peripheral zone of the right lobe of the prostate gland (white arrow), representing prostate cancer. The prostate cancer has a bulky extracapsular extension posteriorly (black arrow). The peripheral zone of the left lobe of the prostate shows normal high signal intensity with visible prostate capsule as a dark line (arrowhead). Figure 9.14b, axial T2WI of MRI, contiguous of Fig. 9.14a, shows right lateral (white arrow) and posterior extracapsular extension of the right prostate cancer. Nonvisualization of the right neurovascular bundle is noted in contrast to normally visualized left neurovascular bundle (black arrowhead), suggestive of tumor invasion in the right neurovascular bundle. A small prostate cancer (black arrow) in the lateral part of the left peripheral zone is also depicted. There are multiple hyperplastic nodules in the central gland of the prostate.
Case 11
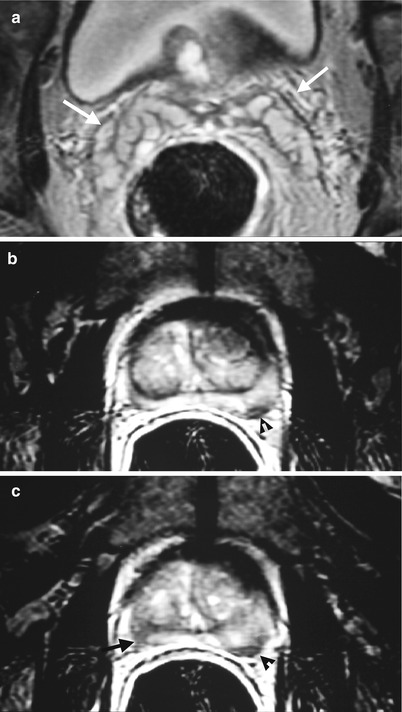
Fig. 9.15
Magnetic resonance imaging (MRI) using an endorectal coil shows imaging findings of prostate cancer in both lobes with left extracapsular extension and without bilateral neurovascular invasions. Figure 9.15a, axial T2WI MRI at seminal vesicle level shows thin walls of the seminal vesicles having high signal intensity content (arrows). No seminal vesicle invasion by prostate cancer is considered. Figure 9.15b, axial T2WI MRI at prostate level shows a small low density area (arrowhead) in the left peripheral zone with posterior smooth bulging appearance, consistent with prostate cancer. Figure 9.15c, axial T2WI MRI, contiguous of Fig. 9.15b, shows irregular posterior surface (arrowhead) of the left prostate cancer, suggestive of left extracapsular extension. Another cancer confined in the right peripheral zone of the prostate gland is noted as small low signal area (black arrow) with posterior smooth contour. Note bilateral neurovascular bundles are visible without tumor invasion.
Case 12
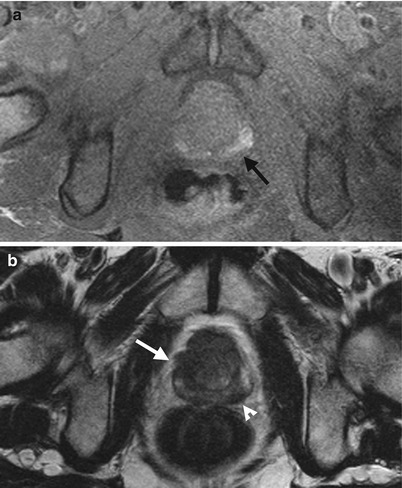
Fig. 9.16
Magnetic resonance imaging (MRI) shows imaging findings of bilateral prostate cancers with bilateral extracapsular extension. Figure 9.16a, axial T1-weighted image of MRI shows high signal intensity areas (black arrow) of bilateral peripheral zones of the prostate gland due to post-biopsy hemorrhage. Figure 9.16b, axial T2-weighted image of MRI shows abnormal low signal intensity area in the left peripheral zone, just posterior to hemorrhage area, consistent with prostate cancer. The posterior surface of the left prostate cancer has triangular protruding appearances (arrowhead), suggestive of left posterior extracapsular tumor extension. Another prostate cancer (arrow) is located at the right lateral part of the prostate gland, showing sawtooth surface, suggestive of extracapsular extension as well. Histological examinations of surgical specimen of radical prostatectomy revealed bilateral extracapsular extension of prostate cancers.
Case 13
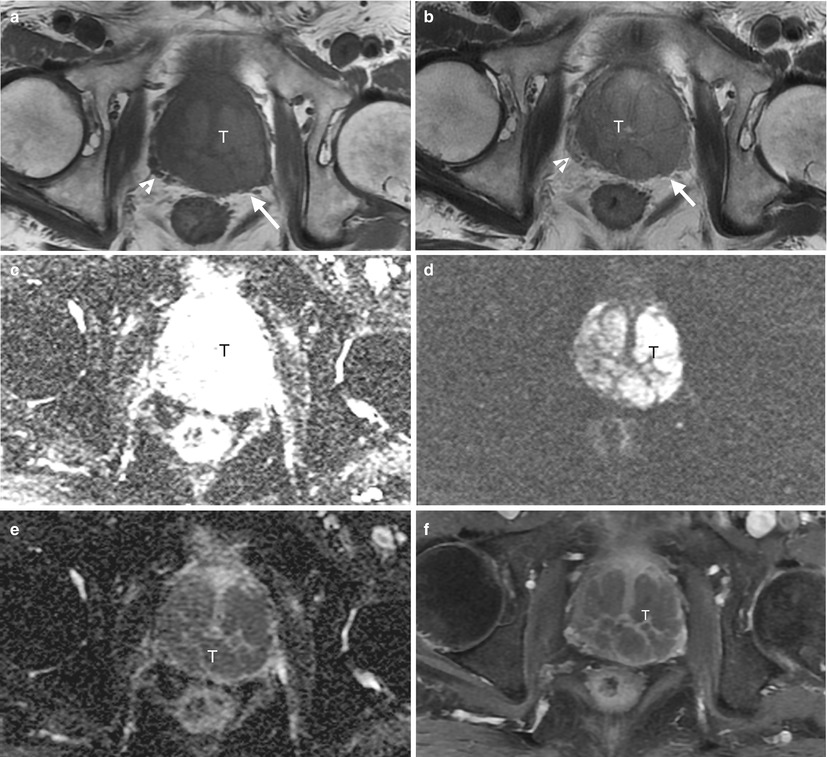
Fig. 9.17
Magnetic resonance imaging (MRI) shows imaging findings of a patient having a large prostate tumor with left extracapsular extension and left neurovascular bundle invasion. Axial T1-weighted imaged (T1WI) (Fig. 9.17a), axial T2-weighted image (T2WI) (Fig. 9.17b), diffusion-weighted images (DWI) of b = 0 (Fig. 9.17c) and b = 1,000 (Fig. 9.17d), apparent diffusion coefficient (ADC) (Fig. 9.17e), and enhanced axial T1 fat-suppressed image (T1FS) (Fig. 9.17f) of MRI show a large tumor (T) involving both lobes of the prostate gland. This tumor has intermediate signal intensity appearance on both T1WI and T2WI, which is an atypical appearance for prostate cancer. Nonetheless, this tumor appears as persistent high signal intensity areas on DWI of both b = 0 and b = 1,000 as well as low signal intensity areas on ADC, suggestive of water restriction by prostate cancer. This tumor has heterogeneous enhancement on enhanced T1FS image. Note obliteration of left neurovascular bundle by the tumor (arrow) in contrast to normal visualized right neurovascular bundle (arrowhead), suggestive of tumor invasion of left neurovascular bundle.
Key Diagnostic Features
Magnetic resonance imaging (MRI) is the best imaging modality for identifying and assessing extracapsular extension of prostate cancers. Other imaging modalities such as transrectal ultrasound and computed tomography are insensitive for this purpose. On MRI, the evaluation of presence or absence of extracapsular extension relies mostly on T2-weighed images with or without fat-suppression techniques [4]. Other pulse sequences of MRI could however provide complimentary information. The loss of normal dark line of prostate capsule at the site of prostate cancer on T2WI MRI suggests the prostate cancer at least abutting the prostate capsule with possible extracapsular extension. Nonetheless, a gross extra-prostate mass, triangular appearance, irregular surface, large bulging appearance, and loss of prostate-rectal or prostate-seminal angle suggest the diagnosis of extracapsular extension on MRI [3–5]. When extracapsular extension of prostate cancer is present, it would have neurovascular bundle involvement at the same time. The right neurovascular bundle is located at the right posterior-lateral aspect of the prostate gland, so-called 5 o’clock location, and the left neurovascular bundle, at the left posterior-lateral aspect, 7 o’clock location. If the neurovascular bundle is not involved by the tumor, several small dots and nodules with some surrounding fat could be recognized in the expected positions mentioned above. On the other hand, extracapsular extensions of prostate cancer in either 5 or 7 o’clock location with loss of normal visualization of neurovascular bundles suggest tumor invasion upon MRI. The use of endorectal coils in MRI provides better signal to noise ratio in recognizing prostate capsule and neurovascular bundles [5]. Nonetheless, some patients could not tolerate the inserted endorectal coils despite of its theoretical advantages.
9.7 Prostate Cancer with Seminal Vesicle Invasion
Case 14
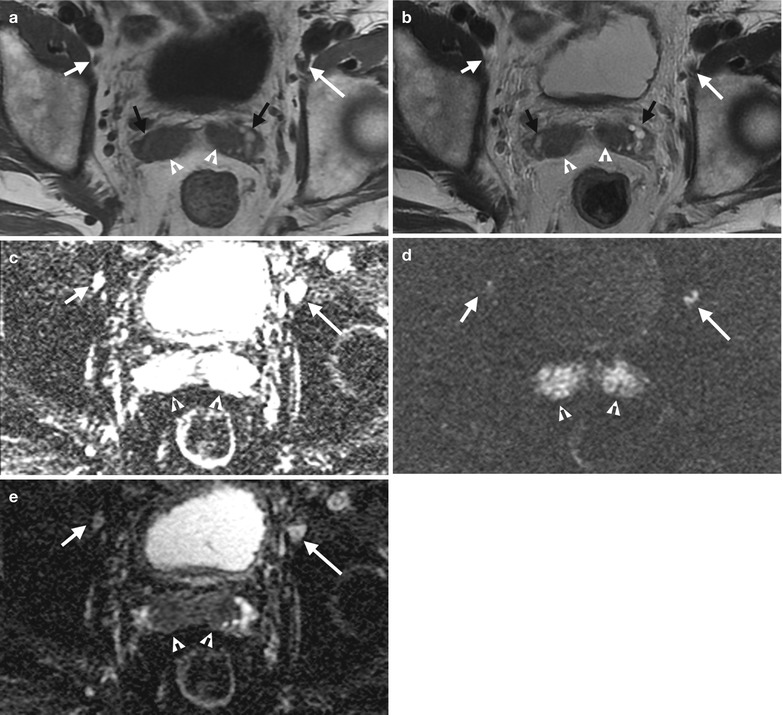
Fig. 9.18
Magnetic resonance imaging (MRI) shows imaging features of seminal vesicle invasion and lymph node metastasis in a patient with prostate cancer. Axial T1-weighted imaged (T1WI) (Fig. 9.18a), axial T2-weighted image (T2WI) (Fig. 9.18b), axial diffusion-weighted image (DWI) of b = 0 (Fig. 9.18c), axial DWI of b = 1,000 (Fig. 9.18d), and axial apparent diffusion coefficient (ADC) (Fig. 9.18e) MRI images show tumor invasion (white arrowheads) in the medial parts of the seminal vesicles bilaterally, as evidenced by low signal intensity areas on T2WI and intermediate to low signal intensity areas on T1WI as well as persistent high signal intensity on DWI of b = 1,000 and low signal intensity on ADC. The most lateral parts (black arrows) of bilateral seminal vesicles have high signal intensity on both T1WI and T2WI, representing subacute hemorrhage after biopsy. The right (short white arrows) and left external iliac lymph nodes (long white arrows) are smaller (1 cm) in diameter (size criteria for lymph node metastasis). However, they appear as abnormal high signal intensity of DWI of b = 1,000, which suggests high probability of lymph node metastasis.
Case 15
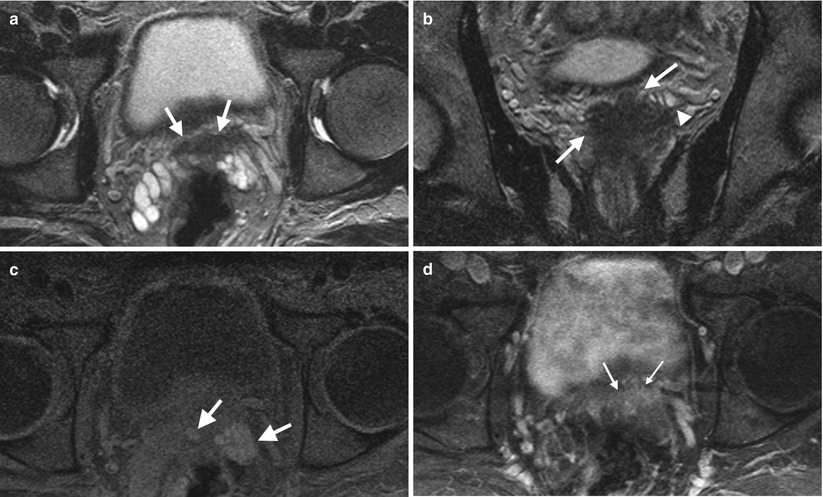
Fig. 9.19
A patient with prostate cancer has tumor invasion in the seminal vesicles. Figure 9.19a, axial T2-weighted imaged (T2WI) of magnetic resonance image (MRI) shows tumor invasion in the medial part of the seminal vesicles, presenting as an area of low signal intensity (arrows). Figure 9.19b, coronal T2WI of MRI shows superior extension of the prostate cancer (arrows) to the seminal vesicles. Note high signal intensity of the remaining normal part (arrowhead) of the seminal vesicles. Figure 9.19c, axial T1 fat-suppressed (T1FS) image shows hemorrhagic areas (arrows) in the seminal vesicles. Figure 9.19d, post-contrast axial T1FS image shows moderate enhancement of the tumor part (arrows) in the seminal vesicles. Note the hemorrhage area on T1FS image (Fig. 9.19c) is different from the low signal intensity area on axial T2WI (Fig. 9.19a) and enhanced area on post-contrast T1FS image (Fig. 9.19d).
Key Diagnostic Features
Normal seminal vesicles appear as tubules with smooth wall having high signal intensity content (i.e., semen) on T2-weighted images (T2WI) of magnetic resonance image (MRI). When prostate cancer involves the seminal vesicles, the tumor part in the seminal vesicles would lose normal high signal intensity appearance and is replaced by low signal intensity area on T2WI [3]. The remaining normal part of seminal vesicles would however keep the high signal intensity appearance on T2WI. Furthermore, the tumor invasion part of the seminal vesicles could also have heterogeneous contrast enhancement to highlight its presence on enhanced T1 fat-suppressed images. On the other hand, normal parts of the seminal vesicles have no contrast enhancements which enable their differentiation from the tumor invasion part of the seminal vesicles. Functional MRI such as diffusion-weighted image (DWI) and apparent diffusion coefficient (ADC) is helpful in identifying tumor invasion of the seminal vesicles and lymph node metastasis. Because malignant neoplasms usually restrict water diffusion, seminal vesicles and lymph nodes involved by prostate cancer could appear persistent high signal intensity on high-b-value DWI and low signal intensity on ADC, even of small sized lymph nodes.
Main Differential Diagnoses
1.
Post-biopsy hemorrhage of seminal vesicles in prostate cancer patients
The diagnosis of prostate cancer is validated by prostate cancer biopsy. Therefore, many patients suspected of prostate cancer by high prostate specific antigen (PSA) titers or positive findings of digital rectal examinations would undergo prostate biopsy first via transrectal ultrasound (TRUS) of the prostate gland. The patients with proved prostate cancer by histological examinations then undergo MRI for prostate cancer staging. However, post-biopsy hemorrhage in the prostate gland or seminal vesicle is a common finding, which may last 4–8 weeks or even longer after biopsy. However, hematoma could also appear as low signal intensity area of the seminal vesicles similar to that of invasion of prostate cancer cells in the seminal vesicles. There are two ways to differentiate hemorrhage from tumor part in the seminal part. First, hemorrhage usually appears as high signal intensity on T1WI or T1FS image of MRI. If the low signal intensity area on T2WI is completely identical to the hemorrhagic area on T1WI or T1FS image, hemorrhage in the seminal vesicles is likely. Otherwise, tumor invasion in the seminal vesicle should be considered.
9.8 Prostate Cancer with Bladder Invasion
Case 16
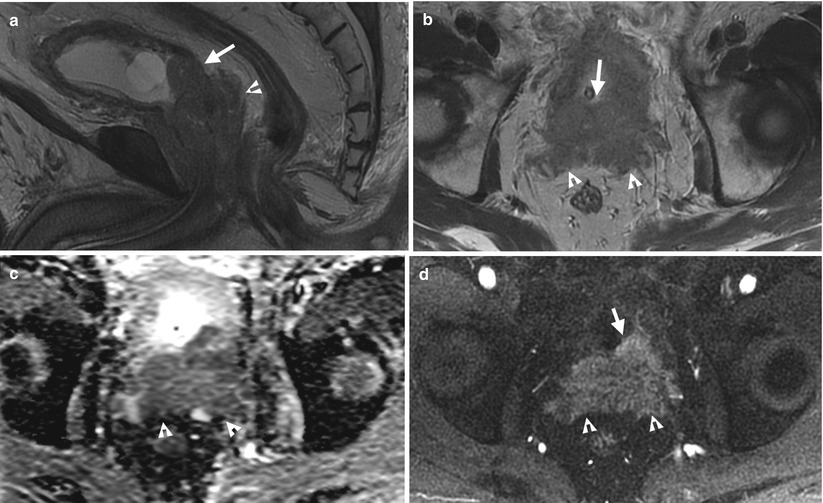
Fig. 9.20
A patient with prostate cancer has tumor invasion in the posterior wall of the urinary bladder and seminal vesicles upon MRI. Figure 9.20a, sagittal T2-weighted image (T2WI) shows a large prostate tumor involving the bladder neck, posterior wall of the urinary bladder (arrow), and seminal vesicles (arrowhead). Note the normal dark line appearance of the posterior wall of the urinary bladder disappears at the site of tumor invasion. Figure 9.20b, axial T2WI shows a tumor mass involving the posterior wall of the urinary bladder (arrow) and seminal vesicles (arrowheads), as tumor invasion by prostate cancer. Figure 9.20c, axial apparent diffusion coefficient image shows low signal intensity of the whole mass, involving the posterior wall of the urinary bladder and seminal vesicles (arrowheads) due to water restriction of the prostate cancer. Figure 9.20d, enhanced axial T1-weighted fat-suppressed image shows heterogeneous enhancement of the tumor at the posterior wall of the urinary bladder (arrow) and seminal vesicles (arrowheads).
Case 17
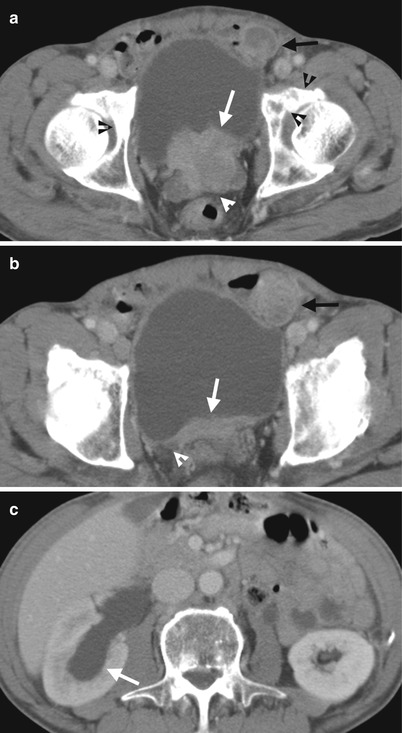
Fig. 9.21
A patient with prostate cancer shows tumor invasion in the seminal vesicles and right trigone of the urinary bladder with resultant right hydronephrosis. Figure 9.21a, enhanced axial CT image at seminal vesicles level shows a soft tissue enhancing tumor involving the posterior wall of the urinary bladder with irregular surface (arrow). The tumor also involves the seminal vesicles (arrowheads). Figure 9.21b, enhanced axial CT image, superior to Fig. 9.21a, shows irregular wall thickening of the posterior wall (arrow) of the urinary bladder with encasement of the most distal part of the right ureter (arrowhead) at the right bladder trigone. Figure 9.21c, enhanced axial CT at the right kidney level shows right hydronephrosis (arrow) which resulted from tumor invasion at the right bladder trigone by prostate cancer cells shown in Fig. 9.21b.
Related posts:
Stay updated, free articles. Join our Telegram channel

Full access? Get Clinical Tree


