Leukemias in Children


Leukemias in Children


Larry E. Kun


Leukemias are the most common cancer types in children, representing nearly 30% of all childhood cancers in North America. The most common leukemia is acute lymphoblastic leukemia (ALL), accounting for 80% of childhood leukemias and nearly 24% of all cancers in children. Approximately 3000 children present with ALL annually in the United States. ALL was the prototype childhood cancer documenting response and, subsequently, cure with chemotherapy and the importance of combined modality therapy that incorporated irradiation for “sanctuary sites.” The development of therapeutic approaches in ALL sets another precedent in oncology, demonstrating the value of serial, prospective clinical trials to introduce progressively more successful treatment regimens. It is no exaggeration to attribute the early success in leukemia control to the introduction of central nervous system (CNS) irradiation, a fundamental component of the earliest successful leukemia regimens developed in the late 1960s that has been extensively studied in serial intervals, identifying subsets of ALL at higher risk for CNS disease and weighing relative effectiveness and toxicities of CNS-directed chemotherapy or irradiation (Fig. 2.1).

Approximately 20% of childhood leukemias are acute myeloblastic leukemia (AML), a disease that is more common in adults. Successful management of AML has lagged behind that of ALL historically, and the role of radiation therapy remains poorly identified. However, AML has been one of the more common indications for bone marrow transplant (BMT) in children, and the impact of total body irradiation (TBI) in this setting has been significant. Transplant regimens continue to evolve, with increasing indications for radiation immuno suppression, as the host pool for allogeneic transplants now commonly includes matched unrelated and haploidentical donors.


ACUTE LYMPHOBLASTIC LEUKEMIA


Biology

ALL results from a clonal expansion of dysregulated, immature lymphoid cells. The linkage of ALL subtypes to the major immunophenotypic lymphocyte lines provided the first biologic understanding of the disease types that correlate biologic characteristics with common clinical features. B-precursor leukemias account for 85% of ALL cases in children. Most cases of B-precursor ALL consist of leukemic clones from early pre-B-cell lines (55%; cytoplasmic immunoglobulin [cIg] negative) or pre-B-cell lines (25%; cIg positive); only 2-3% of B-progenitor ALL cases show mature B-cell differentiation with surface immunoglobulin that characterizes mature B cells. T-precursor ALL accounts for 15% of cases of childhood ALL (1). B cell-derived ALL typically occurs in young children, associated with a wide range of clinical manifestations and initial white blood cell (WBC) counts. Classically, T-cell ALL occurs in older children (above 10 years) and has been associated with extramedullary involvement (in mediastinal lymph nodes and the CNS) and high presenting WBC (2).

Enormous advances in the understanding of ALL have accompanied studies of the cytogenetics of this disease (3) (Fig. 2.2). More than 60% of ALL cell lines in children are identifiable as specific genetic abnormalities. The earliest distinct molecular characteristic included chromosomal translocations: the demonstration of Philadelphia chromosome (Ph+), associated with chronic myelogenous leukemia in adults, in up to 5% of children with B-precursor ALL. P+h+ cases have translocation t(9;22) associated with the BRC-ABL fusion gene and a high risk of relapse, especially in adolescents (3,4). Unfavorable genetic findings include hypodiploidy and t(4;11) associated with the MLL-AF4 fusion gene, found in half of the infants below 1 year (5). Lymphoblasts with deletion or mutation of IKZF1 are associated with a twofold incidence of relapse and adverse events independent of age and initial WBC; the IKZF1 deletion is associated with a threefold likelihood of minimal residual disease (MRD) at completion of induction therapy (6). Several chromosomal translocations (e.g., t(4;11), t(11;19), and t(1;11)) result in mixed-lineage leukemia (MLL) gene rearrangements, a genetic factor associated with a significantly lower disease control rate (7). Infants below 1 year often show MLL gene rearrangements (8,9). Biologic characteristics associated with favorable outcome in B-lineage ALL include hyperdiploidy (>50 chromosomes) and t(12;21), associated with TELAML1 fusion gene present in 20% of children (3, 4, 5). Among the 12% of leukemic children and adolescents presenting with T-cell ALL, the finding of t(11;19) and related MLL-ENL is associated with positive outcome (3).


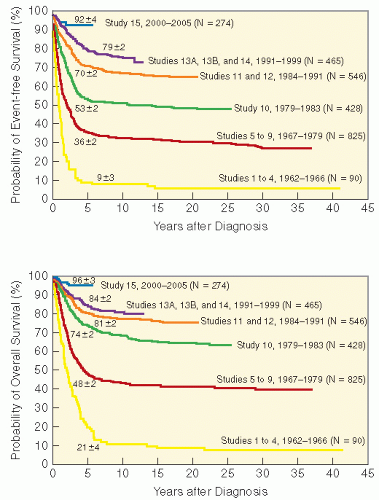
Figure 2.1 Outcome in childhood ALL—serial “total” therapy studies at St. Jude Children’s Research Hospital 1962-2005. EFS (top) and OS (bottom) for 2628 children treated on 15 consecutive trials. Reprinted from Pui CH, Evans WE. Treatment of acute lymphoblastic leukemia. N Engl J Med. 2006;354(2):166-178, with permission.


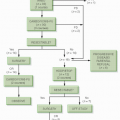
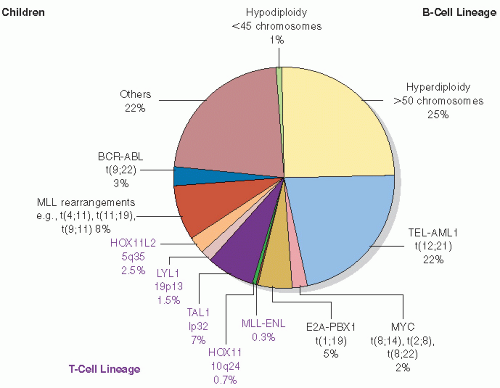
Figure 2.2 Genotypes in childhood ALL, including genetic findings in B-cell lineage or all ALL immunophenotypes; genetic findings unique to T-cell ALL are in purple shades. Reprinted from Pui CH, Relling MV, Downing JR. Acute lymphoblastic leukemia. N Engl J Med. 2004;350(15): 1535-1548, with permission.


Clinical Presentation

The median age at presentation for ALL is 4 years, with a peak occurrence between ages 2 and 4 years. Boys are more commonly affected than girls; the male sex predominance is particularly notable in T-cell ALL. ALL is less common in African-American children. Earlier studies demonstrated unfavorable outcome in adolescents and in African-American children; more recent results are similar among children with standard-risk ALL (10).

The most common presenting symptoms include fever, bleeding, and bone pain. Findings at diagnosis include ecchymoses or petechiae, signs of lymph node enlargement, and hepatosplenomegaly. The diagnosis is suspected with a complete blood count (CBC) demonstrating the presence of immature lymphoblasts in the peripheral blood or elevated WBC (WBC less than 10,000/mL in 50% of presentations, 10-50,000 in 30%, and more than 50,000 in 15-20% at diagnosis). Less often, clinical symptoms or signsare associated with extramedullary involvement of the CNS, testis, or kidney.

ALL is a systemic disease by definition, usually involving the bone marrow diffusely and associated with lymphoblastic infiltration, either microscopic or overt, in a number of organ systems (e.g., lymph nodes, liver, and spleen). CNS leukemia is usually asymptomatic; extensive leptomeningeal disease may be manifest clinically by irritability, headaches, sometimes vomiting or unanticipated weight gain (the “hypothalamic” syndrome), and, less often, cranial nerve palsies (especially VII; less often VI, III) or seizures. Advanced disease sometimes is manifest by papilledema and diffuse retinal infiltration (Fig. 2.3). The pathophysiology was demonstrated in Price and Johnson’s classic description of leukemic cells filling the subarachnoid space well into Virchow-Robin spaces and throughout the basal cisterns (11). CNS disease is associated with IL-15 expression (12).


Staging: Risk Categories for ALL

The clinical criteria used in determining “risk group” for pediatric ALL were agreed upon at an NIH-sponsored Consensus Conference in 1995. Low risk has been defined as B-precursor ALL in children between 1 and 10 years presenting with WBC less than 50 × 109/L (50,000/mL) (13). Other features currently identified as low risk include DNA index of >1.16 or presence of TEL-AML1 fusion (14). Infants below 1 year, children 10 years or older, B-cell lineage with WBC over 50,000/mL, all those with T-cell lineage, and cases with t(1;19)/E2A-PBX1 fusion are now classified as standard risk at St. Jude Children’s Research Hospital (SJCRH) and in several cooperative groups (14). High-risk disease at diagnosis is limited to those with
t(9;22)/BRC-ABL fusion (Ph+ ALL) (14,15). In addition to clinical and biological features at diagnosis, one of the most important predictors of outcome is early response to induction chemotherapy: patients with residual bone marrow leukemia (MRD quantitatively defined by immunohistochemistry or polymerase chain reaction [PCR] blasts defined as ≥1% on day 19 of induction therapy or 0.1-0.99% at completion of 6-week induction therapy) are at higher risk for relapse and are staged as standard risk (rather than low risk); those with ≥1% residual at the latter interval are all treated as high risk (14,16). Relative risk factors and the impact on therapeutic outcome are listed in Table 2.1. Recent studies show 45-50% of cases treated as low risk, 40-45% as standard risk, and 8-10% as high risk (14,17). With more aggressive, risk-adapted therapy, many of the outcome correlates are no longer significant, including mature B-cell or T-cell immunophenotypes, race, and gender (5,14,18).


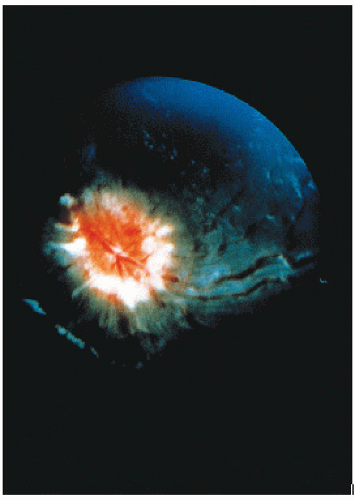
Figure 2.3 The retinal photograph demonstrates advanced CNS leukemia with papilledema and retinal infiltrate typical of ocular disease.


Staging: CNS Involvement in ALL

The diagnosis of CNS disease in leukemia was stand ardized by the Rome Workshop as the presence of ≥ 5 WBC/µL in the cerebrospinal fluid (CSF) with identifiable blasts or the presence of cranial nerve palsies believed to be related to CNS infiltration (19,20). Based on disease control in ALL studies through the 1990s, CNS disease is now classified as CNS 1 (no blasts), CNS 2 (blasts with <5 WBC/µL), or CNS 3 (as above: ≥5 WBC/µL and cytologic or biologic evidence of blasts in the CSF) (19). Studies at SJCRH showed that a traumatic lumbar puncture early in diagnosis/therapy (iatrogenic introduction of circulating blasts into the CSF) is equivalent to CNS 2 disease (21). The percentage of cases with positive CNS disease at diagnosis has been quite variable; recent large trials show 3-5% of children have CNS 3 status, but the proportion with CNS 2 status has varied between 5% and 10-30% (22). In most series, CNS 2 or CNS 3 at diagnosis is associated with a less favorable outcome; more intensive systemic and IT chemotherapy may reduce the impact of CNS 2, yet identifying CNS 3 as a negative finding at diagnosis (14,23).


Treatment: Chemotherapy

Therapy for ALL includes three components: remission induction, intensification (or consolidation), and continuation therapy. Typical induction therapy combines corticosteroids (prednisone or dexamethasone), vincristine, and asparaginase or anthracycline (daunorubicin). Dexamethasone is often substituted for prednisone due to greater CNS penetration and longer half-life (5). Remission induction is successful in 97-99% of children (14,15).

Intensification (or consolidation) follows remission induction and incorporates aggressive drugs and regimens to continue maximal early cytoreduction. The most commonly used agents include methotrexate (MTX; at “high” dosages, typically 1-5 g/m2 repeatedly during this phase), 6-mercaptopurine (6-MP), and asparaginase (also at high dosages). Reinduction is also a component of consolidation, shown to improve disease control (24,25). Patients with BRC-ÅBL fusion gene (Ph+) deficit and poor initial response (with (+) MRD) appear to benefit from allogeneic BMT in intensification (26).

Continuation therapy is a routine part of therapy for all ALL presentations except the rare mature B-cell type (the latter is treated with more intensive, less protracted chemotherapy). Continuation therapy is administered for ≥2 years (4,27). It is typically weekly MTX and 6-MP. The goal of continuation therapy is to eliminate residual, slowly replicating leukemic blasts or to sufficiently suppress leukemic cell division to allow programmed cell death to intervene.

Pharmacologic studies reveal biologically specific sensitivities to drug therapies: hyperdiploid cells show increased intracellular MTX, and lymphoblasts with TEL-AML1 expression are unusually sensitive to asparaginase— correlating with improved outcome in both biologic subsets given current therapeutic regimens (2,3,5). T-lineage lymphoblasts show lower concentrations of MTX’s active polyglutamate metabolites, correlating with improved outcome when treated with high-dose MTX regimens (2,3,5).

Long-term leukemia-free survival is now achieved in over 80% of children with ALL (28, 29, 30). Low-risk ALL can be cured in 90-95% of cases, while standard-risk patients can anticipate disease-free survival rates greater than 80%; children with high-risk features are reported to show EFS of 50-70% depending on the threshold for defining high risk (5,14,23,28,29).


Treatment: CNS Preventive Therapy


Evolution of CNS Preventive Therapy in ALL

The initial concept for preventive CNS irradiation was derived from animal experiments with the mouse L1210 leukemia model: “leukemia control” was possible only when CNS irradiation was added to intraperitoneal chemotherapy (31). Investigators at SJCRH first applied the experimental model to children with ALL in the 1960s. Taking a “total” approach to the disease, they used induction chemotherapy (vincristine, prednisone) in sequence with prolonged, nonaggressive maintenance therapy (oral MTX and 6-MP) (32, 33, 34).

Early studies incorporated 5-12 Gy craniospinal irradiation (CSI) following the observation that CNS relapse was the dominant event once chemotherapy prolonged “hematologic remission” beyond 6-12 months (32). CNS preventive therapy evolved through serial studies at SJCRH and in Cancer and Leukemia Group B. CSI or cranial irradiation (CrI) to 24 Gy (the latter combined with intrathecal methotrexate [IT-MTX]) reduced the incidence of CNS
relapse from >60% to <5-10% (32,35). Children in hematologic remission randomized to preventive CSI (24 Gy) or equivalent therapeutic CSI at the time of overt CNS relapse showed strikingly higher event-free and overall survival with preventive therapy (36). In addition, children cured following a CNS relapse had significantly greater functional deficits (e.g., seizure disorders and cognitive deficits) (37). Subsequent trials proved the relative equivalence of 18 Gy (at 1.5-1.8 Gy per fraction) and 24 Gy (similarly fractionated) for preventive CrI (38, 39, 40, 41).


Table 2.1 Preventive CNS Therapy in Acute Lymphoblastic Leukemia—Major Recent Series


Series (Interval)


Subset


pCrI (% CrI) (Alternative pCNS Therapy)


n


EFS at 5 Years (%)


Isolated CNS Relapse (First Event) (%)


DFCC-95a (1996-2000)


Standard risk (all)


CrI18 Gy (100%) versus TITj (0%)


272


86


0.7


(CrI18 Gy =81)


86


0


(TIT =83)


83


2.4


High risk


CrI18 Gy (100%)


219


76


0.5


Overall


491


82


SJCRH TXIIIAb (1991-1994)


All


CrI18 Gy (22%)


165


78


1.2


SJCRH TXIIIBc (1994-1998)


All


CrI18 Gy (12%)


247


81


1.7


SJCRH TXVd (2000-2007)


All


Systemic, IT-MTX (0%)


498


86


2.7


CNS 3


Systemic, IT-MTX (0%)


9


43


CCG-1952e (1996-2000)


Standard risk (all)


IT-MTXversus TIT


2027


82


4.9 (1.6% CrI)k (5.9%)


(3.4%)


ALL-BFM-95f (1995-2000)


Standard risk


Systemic, IT-MTX (0%)


758


90


1.1


Medium risk


Systemic, IT-MTX (0%)


1157


80


2.2


High risk (and all T cells)


CrI12 Gy (100%)


254


49


2.4


CNS 3


CrI18 Gy (≥ 2 year old)


16


59


Overall


2169


80


1.8


UK ALL 97/99 (1997-2002)g,h


Overall


CrI24 Gy (3%)


1935


74-81


2.5-5


Dutch COG ALL-9i (1999-52004)


Overall


TIT (0%)


601


81


2.6


TIT (0%)


21


67


14


a Moghrabi A, Levy DE, Asselin B, et al. Results of the Dana-Farber Cancer Institute ALL Consortium Protocol 95-01 for children with acute lymphoblastic leukemia. Blood. 2007;109(3):896-904.

b Pui CH, Boyett JM, Rivera GK, et al. Long-term results of Total Therapy studies 11, 12 and 13A for childhood acute lymphoblastic leukemia at St. Jude Children’s Research Hospital. Leukemia. 2000;14(12):2286-2294.

c Pui CH, Sandlund JT, Pei D, et al. Improved outcome for children with acute lymphoblastic leukemia: results of Total Therapy Study XIIIB at St. Jude Children’s Research Hospital. Blood. 2004;104(9):2690-2696.

d Pui CH, Campana D, Pei D, et al. Treatment of childhood acute lymphoblastic leukemia without prophylactic cranial irradiation. N Eng J Med. 2009;360(26):2730-2741.

e Matloub Y, Lindemulder S, Gaynon PS, et al. Intrathecal triple therapy decreases central nervous system relapse but fails to improve event-free survival when compared with intrathecal methotrexate: results of the Children’s Cancer Group (CCG) 1952 study for standard-risk acute lymphoblastic leukemia, reported by the Children’s Oncology Group. Blood. 2006;108(4):1165-1173.

f Moricke A, Reiter A, Zimmermann M, et al. Risk-adjusted therapy of acute lymphoblastic leukemia can decrease treatment burden and improve survival: treatment results of 2169 unselected pediatric and adolescent patients enrolled in the trial ALL-BFM 95. Blood. 2008;111(9):4477-4489.

g Mitchell CD, Richards SM, Kinsey SE, et al. Benefit of dexamethasone compared with prednisolone for childhood acute lymphoblastic leukemia: results of the UK Medical Research Council ALL97 randomized trial. Br J Haematol. 2005;129(6):734-745.

h Vora A, Mitchell CD, Lennard L, et al. Toxicity and efficacy of 6-thioguanine versus 6-mercaptopurine in childhood lymphoblastic leukemia: a randomized trial. Lancet. 2006;368(9544):1339-1348.

i Veerman AJ, Kamps WA, van den Berg H, et al. Dexamathasone-based therapy for childhood acute lymphoblastic leukemia: results of the prospective Dutch Childhood Oncology Group (DCOG) protocol All-9 (1997-2004). Lancet Oncol. 2009;10:957-966.

j Methotrexate (IT), hydrocortisone, cytosine arabinoside.

k CrI24 Gy + SpI 6 Gy during consolidation for CNS 3 only.


Other approaches to preventive CNS therapy were developed in the 1970s, with higher-dose systemic MTX and increased IT chemotherapy (39,40,42,43). Trials over the past 10-15 years have limited use of preventive CrI by progressively defining cohorts at higher risk for CNS relapse most likely to benefit from CrI—balancing the proven efficacy of CrI against radiation-related toxicities (in particular neurocognitive deficits and secondary neoplasms) and toxicities associated with the added CNS exposure to IT and systemic MTX (2,15,22,44, 45, 46, 47, 48). The Dana-Farber Cancer Institute (DFCI) Childhood ALL Consortium Protocol 95-01 included preventive CrI for 60% of children: all high risk (defined by WBC > 50,000/mL, T-cell ALL, Ph+ or t(9;22)) and, by randomization, half the standard risk (randomized to CrI vs. more intensive IT chemotherapy); girls with WBC < 20,000/mL were assigned to the IT arm. The high-risk cohort was randomized between 18 Gy in 10 fractions (180 cGy once daily) or in 20 fractions (90 cGy twice daily). The EFS and OS at 5 years were 82% and 90%, respectively; the rate of CNS relapse was 3% overall and 0.6% as an isolated event. CrI was associated with zero isolated or combined CNS relapses in the standard risk group; the IT group showed only <2% combined and 1% isolated CNS failures (2). There were no differences in neurocognitive function when intensive IT was compared to CrI18 Gy (49). The German-Austrian-Swiss ALL-BFM-95 study limited preventive CrI (dose = 12 Gy) to those with T-cell ALL and high-risk disease above 1 year old (high early MRD, t(9;22) or BRC-ABL, or t(14;11) or MLL-AF4). Compared to the earlier ALL-BFM-90 trial, CrI was used in 10% instead of more than 50% of cases; even at higher thresholds of CrI, the BFM-95 therapy resulted in EFS of 80% and OS of 87% at 6 years. The rate of CNS relapse was 1.8% isolated and 4.1% overall (50). Comparing the earlier BFM-90 cohort (medium risk, age >1 year with pre-B-cell disease) to equivalent cases that did not receive CrI on the BFM-95 trial, EFS was the same, but the overall (4.4% vs. 1.9%) and isolated CNS failure rates (2.2% vs. 0.5%) were statistically superior, if perhaps not clinically meaningful, following CrI12 Gy. Isolated CNS failures occurred early and were associated with poorer outcome after therapy for CNS relapse, but represented a low percentage of events (50). The investigators noted not only the superiority of CrI, but also the higher rates of secondary carcinogenesis. Comparative outcome has also been addressed following CNS relapse in the BFM-95 trial; 58% secondary survival was observed 6 years after relapse and secondary brain tumors are yet at zero (3-4 years following CSI) (15). St. Jude Total XV trial was designed specifically to test eliminating preventive CrI and “therapeutic” CrI (i.e., for those with CNS 3 involvement at diagnosis), the first major US prospective trial assessing intensive IT and systemic chemotherapy to totally replace CrI (14). The impetus was based largely on the high rate of secondary neoplasms identified in the preceding St. Jude Total XII trial (12-20%) (28,51, 52, 53) (Fig. 2.4). Trials XIIIA and XIIIB had shown CNS relapse rates of 1.2% and 1.7%, respectively, with thresholds for preventive CrI resulting in 22% and 12% of participants receiving CrI, respectively (24). Total XV trial was powered to document a low rate of CNS relapse even in the highest-risk category, defined in the key Italian BFM report as T-cell ALL with WBC > 100,000/mL (14,54); only children with persistent CNS disease at conclusion of induction therapy were scheduled for CrI. On comparing the highest-risk cohort regarding CNS disease in Total XV trial with the 12% of similarly presenting patients who had received CrI on the earlier trial, EFS was statistically equal or better in the Total XV group without CrI (14). Despite the high overall EFS and low rate of CNS relapse, one must note the low rate of overall disease control (43%) in the CNS 3 small cohort with initial disease in a without use of CrI in this presentation (14,22,55).


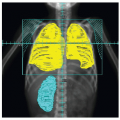
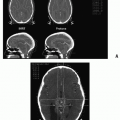
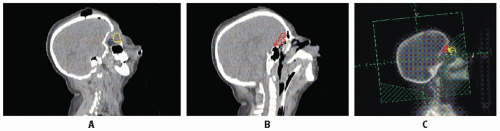
Figure 2.4 Craniospinal irradiation for CNS leukemia. A: Sagittal CT simulation reconstruction showing eye (yellow) and optic nerve (blue) at midorbital level; cranial irradiation for CNS leukemia includes the subarachnoid extension along the optic nerve sheath and the posterior retina (see Fig. 2.7). B: Midline sagittal CT simulation reconstruction showing the cribriform plate (red) along the lower midline skull base anteriorly; this is a critical target for full cranial irradiation. C: Outline of cranial irradiation volume providing margin at key anatomic regions (A and B) for craniospinal therapy in ALL.

Table 2.1 summarizes some of the major series reporting therapeutic approaches over the past 10-15 years. In sum, it is apparent that standard risk ALL can be treated without CrI (15,38,39,41,43). The group for which CrI may be beneficial is the cohort with T-cell ALL and presenting with WBC greater than 100,000/µL. Approximately 20% of children with T-cell ALL (or 2% of all children with ALL) present with high WBC and seem to benefit from preventive CrI (15,44). Because HD-MTX and IT-MTX have been associated with neurologic sequelae, there is also interest in considering
further CrI dosage reduction (12 Gy/8 fractions in the more recent BFM studies) (39).


Current Recommendations for Preventive CNS Therapy

It is unclear whether absolute avoidance of CrI (preventive or “therapeutically” for overt CNS disease at diagnosis) reflects the best current understanding of the relative effectiveness and major toxicities of CrI and the more intensive MTX (systemic and IT) required in high-risk settings when not using CrI. Contemporary ALL regimens include indications for preventive CrI in 2-20% of children (22). There remain cohorts with T-cell disease and high WBC, Ph+ (t(9;22)) presentations, CNS 3 (and possibly CNS 2) at diagnosis, and B-cell precursor ALL with t(1;19) where the risk of CNS relapse exceeds 10% and the use of 18 (or 12) Gy preventive or therapeutic CrI may offer superior disease control (CNS, overall) with acceptable balance regarding known late toxicities (14,22,54, 55, 56, 57). Major trials ongoing in 2009 are listed in Table 2.2, showing indications for preventive CrI.


Radiotherapeutic Management


Volume

For preventive CNS therapy, the target volume includes the entire intracranial subarachnoid space. The key margins are at the skull base: the cribriform plate (the lowest point of the anterior cranial fossa, located in the midline at a level that is typically below the orbital roof) and the lower limit of the temporal fossa. It is a good practice to outline the cribriform plate to ensure adequate coverage (Fig. 2.5) (58). By convention, the lower border is at the inferior margin of the second cervical vertebra.

Documentation of retinal involvement as a late manifestation of CNS leukemia has led to a standard requirement to include the posterior retina and orbital apex, subtending the extension of the subarachnoid space around the optic nerves. Several techniques allow one to encompass the posterior orbit and globe while sparing the sensitive anterior aspect of the globe and lens. One approach uses inferior rotation of the gantry (i.e., angling the beam posteriorly for the supine patient) to achieve a parallel anterior margin at the bony orbital rim (59). Detailed studies indicate that one needs to accept a dosage approximating 20% to the lens in order to adequately cover the cribriform plate (60). Dosimetric studies have suggested that custom beam blocking may improve treatment when compared with a multileaf collimator alone (58).


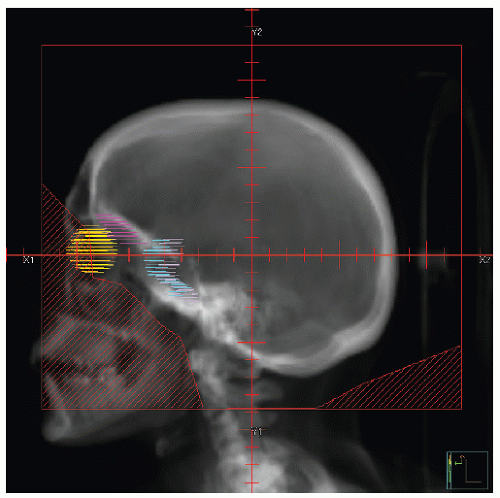
Figure 2.5 Lateral field for cranial irradiation in ALL. Note margin below cribriform plate (pink) and middle cranial fossa (blue). Targeted volume includes posterior eye (yellow) and orbit.


Dosage

Dosages for preventive CrI range from 12 to 18 Gy in current protocols. Fractionation typically is at 150-180 cGy once daily (2,22,25). A study at DFCI in Boston showed no difference in efficacy or apparent toxicity between conventional irradiation (180 cGy × 10) and hyperfractionated CrI (90 cGy twice daily to 18 Gy) (2,41,49).


Treatment of Established CNS Leukemia


CNS Leukemia at Diagnosis

CNS leukemia is present at diagnosis in 3-5% of children (19,50,61). Under the “CNS staging” system proposed by Mahmoud, up to 20% of children at diagnosis show positive CSF cytology, but the incidence of true CNS leukemia (CNS 3: positive CSF cytology and WBC greater than 5/µL) is approximately 5% (19,25,38,50,62). Earlier trials found CNS leukemia at diagnosis associated with a negative outcome. More intensive systemic and IT chemotherapy has successfully eliminated CNS relapse in children with CNS 2 disease (positive CSF cytology and WBC less than 5/µL) (19,25,38,50,62). Therapeutic CrI or CSI has been used in most series for children with CNS 3 disease; the impact of CNS involvement on outcome has been diminished and, in some series, eliminated with such intervention (50,61,63). Nevertheless, the ALL-BFM-95 trial showed 6-year EFS of only 58% with CNS 3 at diagnosis (following therapeutic CrI systematically at 18 Gy) compared to 80% overall 6-year EFS, and SJCRH Total XV trial showed 5-year EFS of 43% (with CrI only for residual CNS disease after induction) compared to 86% overall 5-year EFS (14,15). The latter series obviating irradiation except with residual CSF positivity after induction therapy showed excess CNS and hematologic relapse and death (14).

Only gold members can continue reading. Log In or Register to continue

Stay updated, free articles. Join our Telegram channel

Jun 19, 2016 | Posted by in GENERAL RADIOLOGY | Comments Off on Leukemias in Children

Full access? Get Clinical Tree

Get Clinical Tree app for offline access