Linear Energy Transfer and Relative Biologic Effectiveness
▪ THE DEPOSITION OF RADIANT ENERGY
If radiation is absorbed in biologic material, ionizations and excitations occur that are not distributed at random but tend to be localized along the tracks of individual charged particles in a pattern that depends on the type of radiation involved. For example, x-ray photons give rise to fast electrons, particles carrying unit electrical charge and having very small mass; neutrons, on the other hand, give rise to recoil protons, particles again carrying unit electrical charge but having mass nearly 2,000 times greater than that of the electron. α-particles carry two electrical charges on a particle four times as heavy as a proton. The charge-to-mass ratio for α-particles therefore differs from that for electrons by a factor of about 8,000.
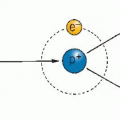
As a result, the spatial distribution of the ionizing events produced by different particles varies enormously. This is illustrated in Figure 7.1. The background is an electron micrograph of a human liver cell. The white dots generated by a computer simulate ionizing events. The lowest track represents a low-energy electron, such as might be set in motion by diagnostic x-rays. The primary events are well separated in space, and for this reason, x-rays are said to be sparsely ionizing. The second track from the bottom represents an electron set in motion by cobalt-60 γ-rays, which is even more sparsely ionizing. For a given particle type, the density of ionization decreases as the energy goes up. The third track from the bottom represents a proton that might be set in motion by a fission spectrum neutron from a nuclear reactor; a dense column of ionization is produced, so the radiation is referred to as densely ionizing. The uppermost track refers to a 10-MeV proton, such as may be set in motion by the high-energy neutrons used for radiotherapy. The track is intermediate in ionization density.
▪ LINEAR ENERGY TRANSFER
Linear energy transfer (LET) is the energy transferred per unit length of the track. The special unit usually used for this quantity is kiloelectron volt per micrometer (keV/µm) of unit density material. In 1962, the International Commission on Radiological Units defined this quantity as follows:
The LET (L) of charged particles in medium is the quotient of dE/dl, where dE is the average energy locally imparted to the medium by a charged particle of specified energy in traversing a distance of dl.
That is,
LET is an average quantity because at the microscopic level, the energy per unit length of track varies over such a wide range. Indeed, the range is so large that some believe that the concept of LET has little meaning. This can be illustrated by the story of a Martian visitor to Earth who arrives knowing that the Earth is inhabited by living creatures with an average mass of 1 g. Not only is this information of very little use, but it also may be positively misleading, particularly if the first
living creature that the Martian encounters is an elephant. An average quantity has little meaning if individual variation is great.
living creature that the Martian encounters is an elephant. An average quantity has little meaning if individual variation is great.
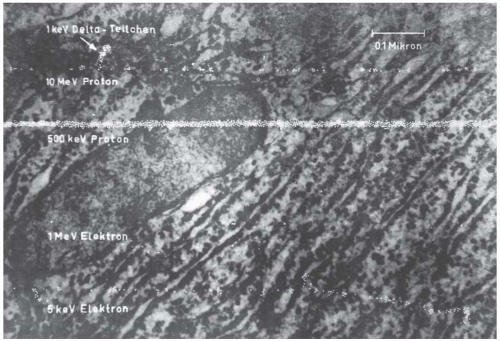 FIGURE 7.1 Variation of ionization density associated with different types of radiation. The background is an electron micrograph of a human cell. The white dots are a computer simulation representing ionizations. Top to bottom: A 10-MeV proton, typical of the recoil protons produced by high-energy neutrons used for radiotherapy. The track is intermediate in ionization density. Also shown is a secondary 1-keV δ-ray, an electron set in motion by the proton. A 500-keV proton, produced by lower-energy neutrons (e.g., from fission spectrum) or by higher-energy neutrons after multiple collisions. The ionizations form a dense column along the track of the particle. A 1-MeV electron, produced, for example, by cobalt-60 γ-rays. This particle is very sparsely ionizing. A 5-keV electron, typical of secondary electrons produced by x-rays of diagnostic quality. This particle is also sparsely ionizing but a little denser than the higher-energy electron. (Courtesy of Dr. Albrecht Kellerer.) |
The situation for LET is further complicated by the fact that it is possible to calculate an average in many different ways. The most commonly used method is to calculate the track average, which is obtained by dividing the track into equal lengths, calculating the energy deposited in each length, and finding the mean. The energy average is obtained by dividing the track into equal energy increments and averaging the lengths of track over which these energy increments are deposited. These methods are illustrated in Figure 7.2.
In the case of either x-rays or monoenergetic charged particles, the two methods of averaging
yield similar results. In the case of 14-MeV neutrons, by contrast, the track average LET is about 12 keV/µm and the energy average LET is about 100 keV/µm. The biologic properties of neutrons tend to correlate best with the energy average.
yield similar results. In the case of 14-MeV neutrons, by contrast, the track average LET is about 12 keV/µm and the energy average LET is about 100 keV/µm. The biologic properties of neutrons tend to correlate best with the energy average.
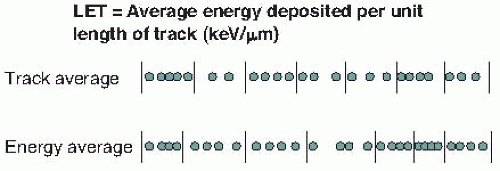 FIGURE 7.2 Linear energy transfer (LET) is the average energy deposited per unit length of track. The track average is calculated by dividing the track into equal lengths and averaging the energy deposited in each length. The energy average is calculated by dividing the track into equal energy intervals and averaging the lengths of the track that contain this amount of energy. The method of averaging makes little difference for x-rays or for monoenergetic charged particles, but the track average and energy average are different for neutrons. |
TABLE 7.1 Typical Linear Energy Transfer Values | ||||||||||||||||||||||||||||||||||||
|---|---|---|---|---|---|---|---|---|---|---|---|---|---|---|---|---|---|---|---|---|---|---|---|---|---|---|---|---|---|---|---|---|---|---|---|---|
|
As a result of these considerations, LET is a quantity condemned by the purists as worse than useless, because it can, in some circumstances, be very misleading. It is, however, useful as a simple and naive way to indicate the quality of different types of radiation. Typical LET values for various radiations are listed in Table 7.1. Included are x- and γ-rays used for radiotherapy protons, neutrons, and naturally occurring α-particles, as well as high-energy heavy ions encountered by astronauts in space. Note that for a given type of charged particle, the higher the energy, the lower the LET and, therefore, the lower its biologic effectiveness. At first sight, this may be counterintuitive. For example, γ-rays and x-rays both give rise to fast secondary electrons; therefore, 1.1-MV cobalt-60 γ-rays have lower LETs than 250-kV x-rays and are less effective biologically by about 10%. By the same token, 150-MeV protons have lower LETs than 10-MeV protons and therefore are slightly less effective biologically.
▪ RELATIVE BIOLOGIC EFFECTIVENESS
The amount or quantity of radiation is expressed in terms of the absorbed dose, a physical quantity with the unit of gray (Gy). Absorbed dose is a measure of the energy absorbed per unit mass of tissue. Equal doses of different types of radiation do not, however, produce equal biologic effects. For example, 1 Gy of neutrons produces a greater biologic effect than 1 Gy of x-rays. The key to the difference lies in the pattern of energy deposition at the microscopic level.
In comparing different radiations, it is customary to use x-rays as the standard. The National Bureau of Standards in 1954 defined relative biologic effectiveness (RBE) as follows:
The RBE of some test radiation (r) compared with x-rays is defined by the ratio D250/Dr, where D250 and Dr are, respectively, the doses of x-rays and the test radiation required for equal biologic effect.
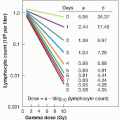
To measure the RBE of some test radiation, one first chooses a biologic system in which the effect of radiations may be scored quantitatively. To illustrate the process involved, we discuss a specific example. Suppose we are measuring the RBE of fast neutrons compared with 250-kV x-rays, using the lethality of plant seedlings as a test system. Groups of plants are exposed to graded doses of x-rays; parallel groups are exposed to a range of neutron doses. At the end of the period of observation, it is possible to calculate the doses of x-rays and then of neutrons that result in the death of half of the plants in a group. This quantity is known as the LD50, the mean lethal dose. Suppose that for x-rays, the LD50 turns out to be 6 Gy and that for neutrons, the corresponding quantity is 4 Gy. The RBE of
neutrons compared with x-rays is then simply the ratio 6:4 or 1.5.
neutrons compared with x-rays is then simply the ratio 6:4 or 1.5.
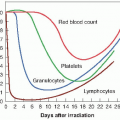
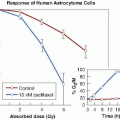
The study of RBE is relatively straightforward so long as a test system with a single, unequivocal end point is used. It becomes more complicated if, instead, a test system such as the response of mammalian cells in culture is chosen. Figure 7.3A shows survival curves obtained if mammalian cells in cultures are exposed to a range of doses of, on the one hand, fast neutrons and, on the other hand, 250-kV x-rays. The RBE may now be calculated from these survival curves as the ratio of doses that produce the same biologic effect. If the end point chosen for comparison is the dose required to produce a surviving fraction of 0.01, then the dose of neutrons necessary is 6.6 Gy; the corresponding dose of x-rays is 10 Gy. The RBE, then, is the quotient of 10/6.6 or about 1.5. If the comparison is made at a surviving fraction of 0.6, however, the neutron dose required is only 1 Gy and the corresponding x-ray dose is 3 Gy. The resultant RBE is 3:1 or 3.0. Because the x-ray and neutron survival curves have different shapes, the x-ray survival curve having an initial shoulder, and the neutron curve being an exponential function of dose, the resultant RBE depends on the level of biologic damage (and therefore the dose) chosen. The RBE generally increases as the dose is decreased, reaching a limiting value that is the ratio of the initial slopes of the x-ray and neutron survival curves.
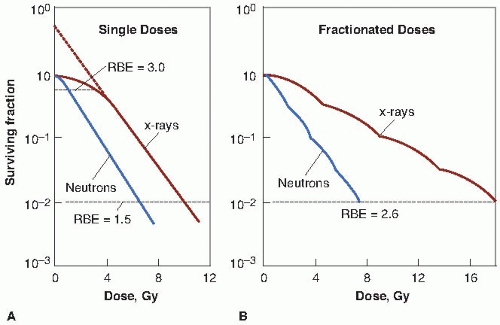 FIGURE 7.3 Typical survival curves for mammalian cells exposed to x-rays and fast neutrons. A: Single doses. The survival curve for x-rays has a large initial shoulder; for fast neutrons, the initial shoulder is smaller and the final slope is steeper. Because the survival curves have different shapes, the relative biologic effectiveness (RBE) does not have a unique value but varies with dose, getting larger as the size of the dose is reduced. B:
Get Clinical Tree app for offline access
Related posts:Stay updated, free articles. Join our Telegram channel
Full access? Get Clinical Tree


|